Indicator — VWAP
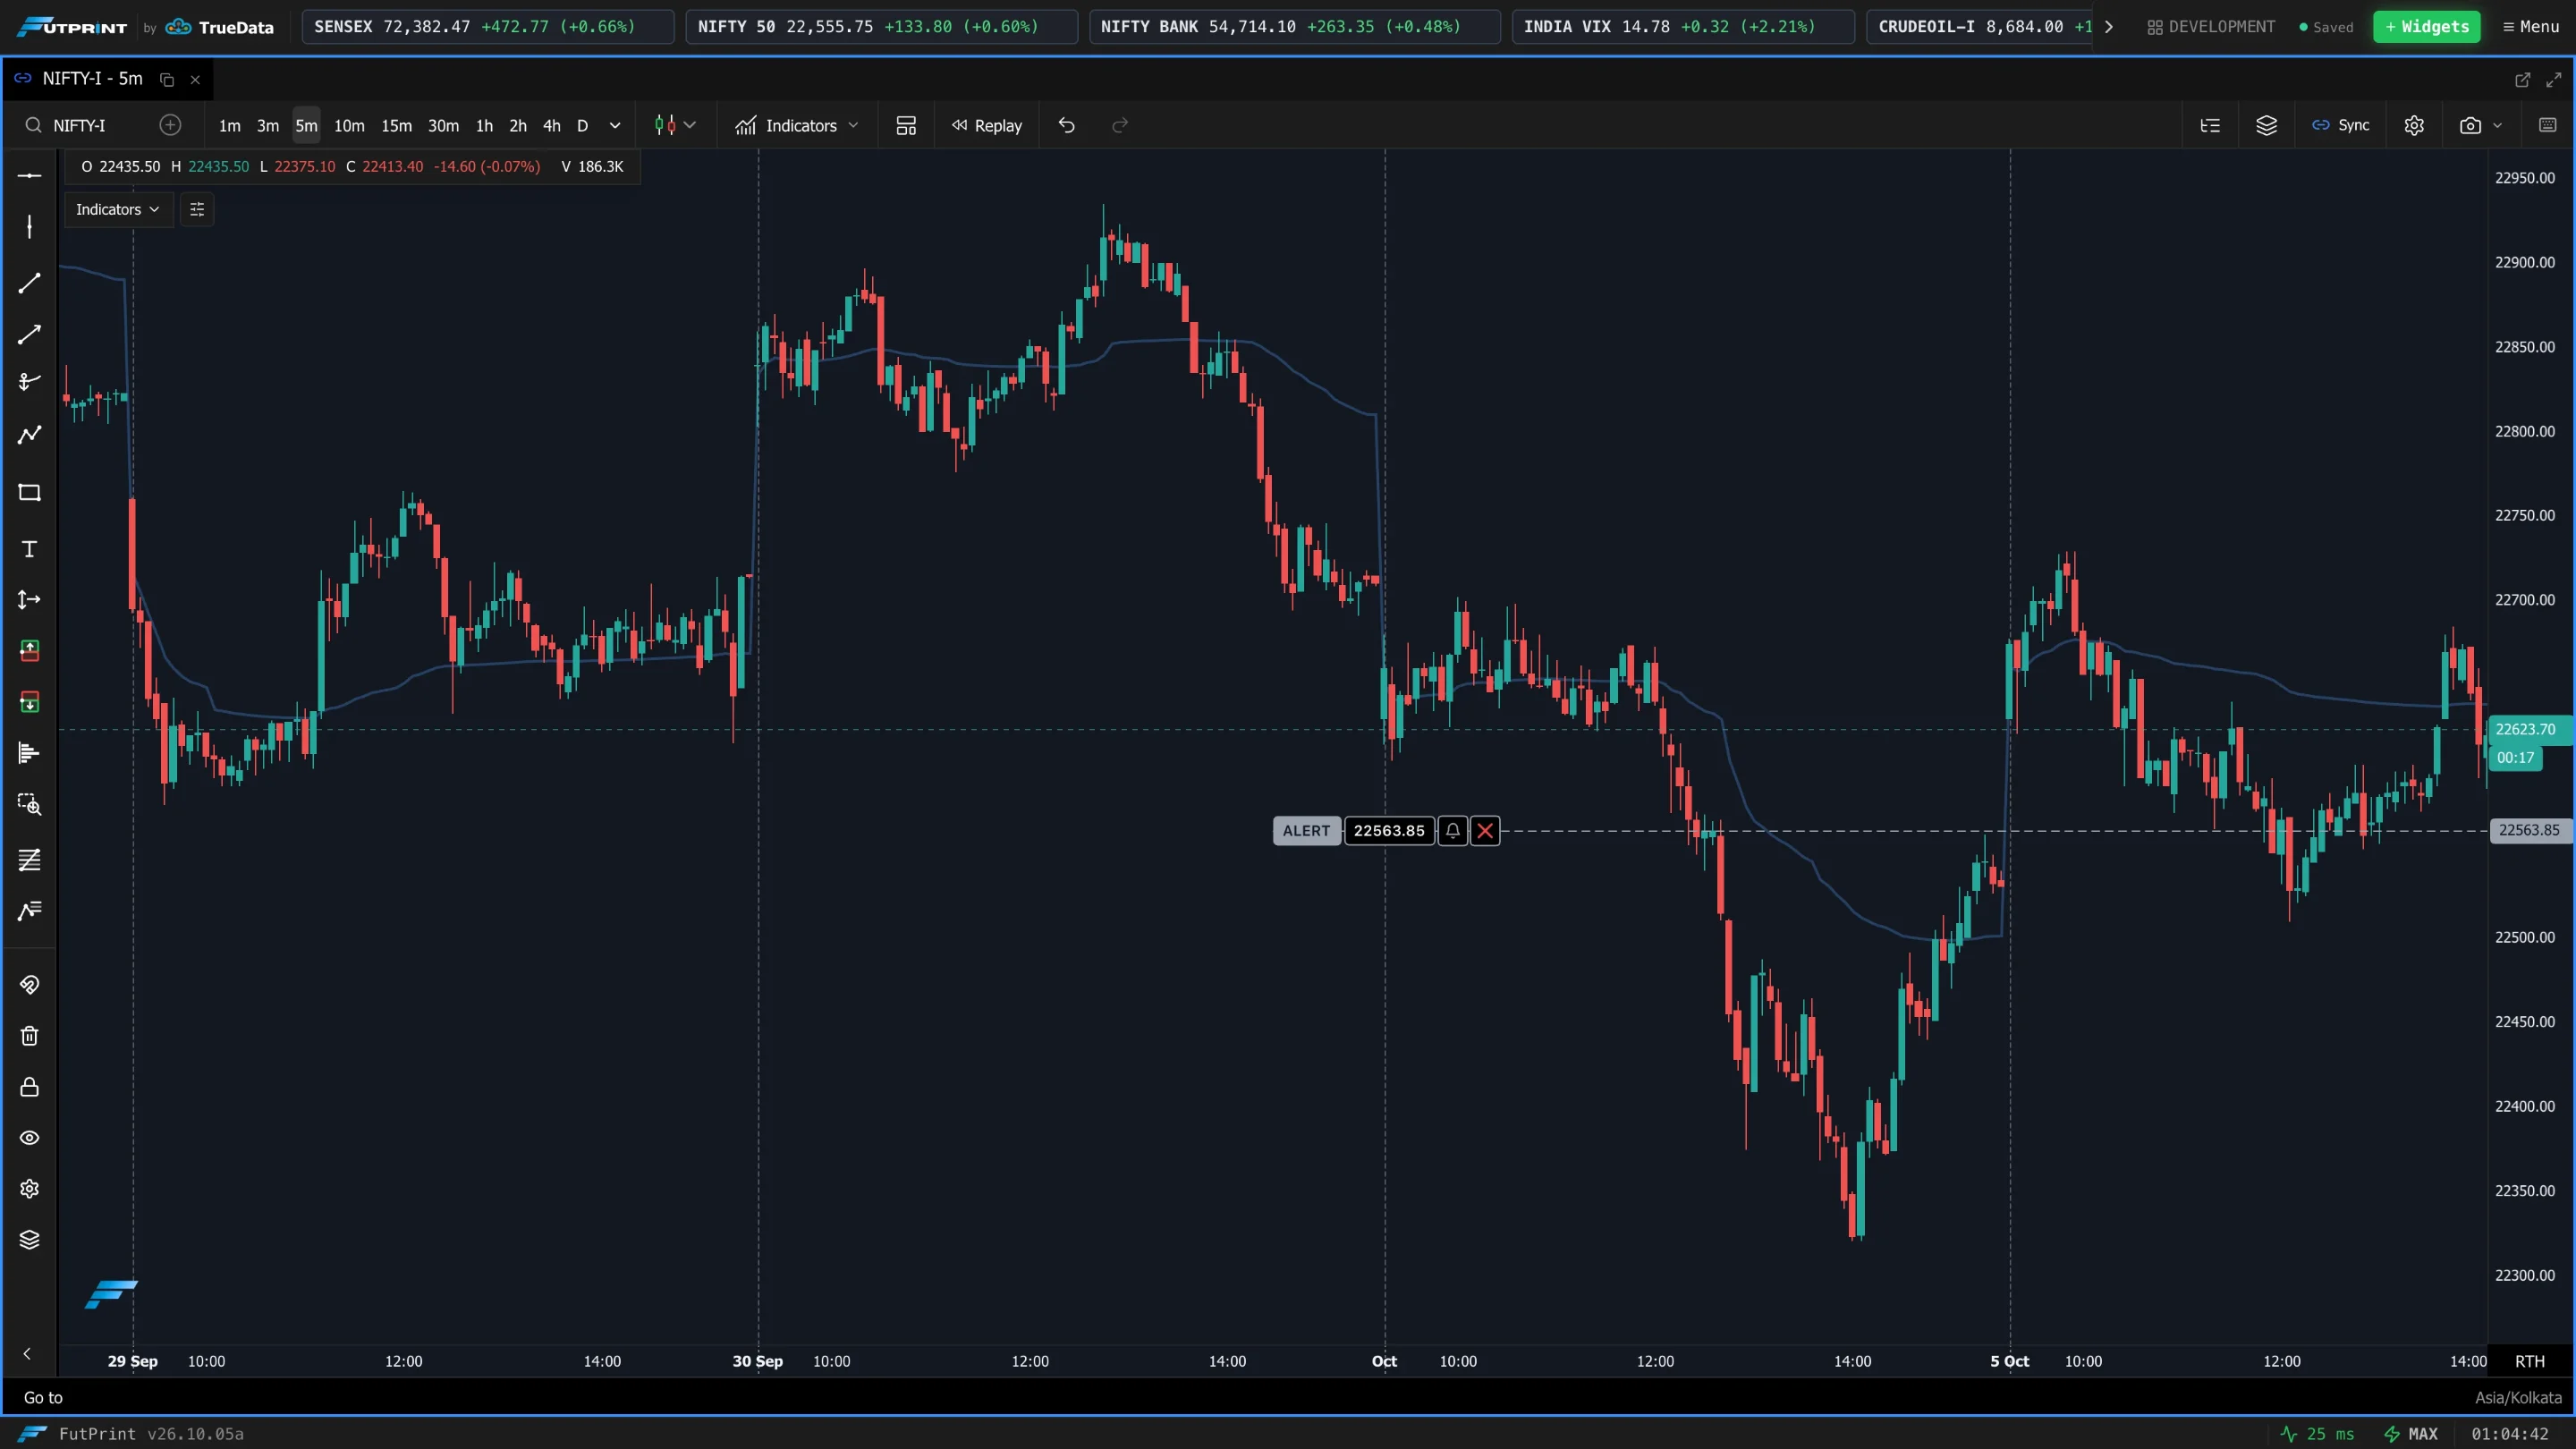
VWAP (volume-weighted average price) is the average price paid over a period, weighted by how much traded at each price. It is the benchmark most institutions are measured against, so price above VWAP is generally read as buyers in control for the period, and price below it as sellers.
Settings
Open Indicators, click the VWAP entry under Added, and use the Settings pane.
Inputs
| Setting | What it does |
|---|---|
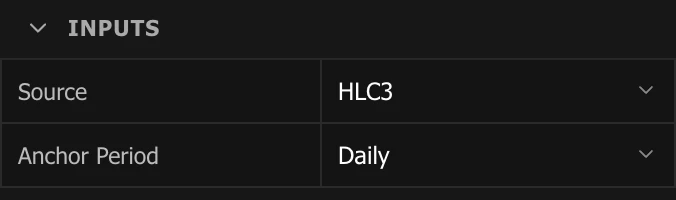
| Source | The price used for each candle: CLOSE, OPEN, HIGH, LOW, HL2 (high+low)/2, HLC3 (high+low+close)/3 or OHLC4. HLC3 is the usual choice. |
| Anchor Period | Where the calculation restarts: Daily, Weekly, Monthly, Yearly, Session, Custom or Lookback. |
| Anchor Time | (Custom) The date and time the VWAP starts from. |
| Lookback Candles | (Lookback) Number of candles to look back from the most recent candle. |
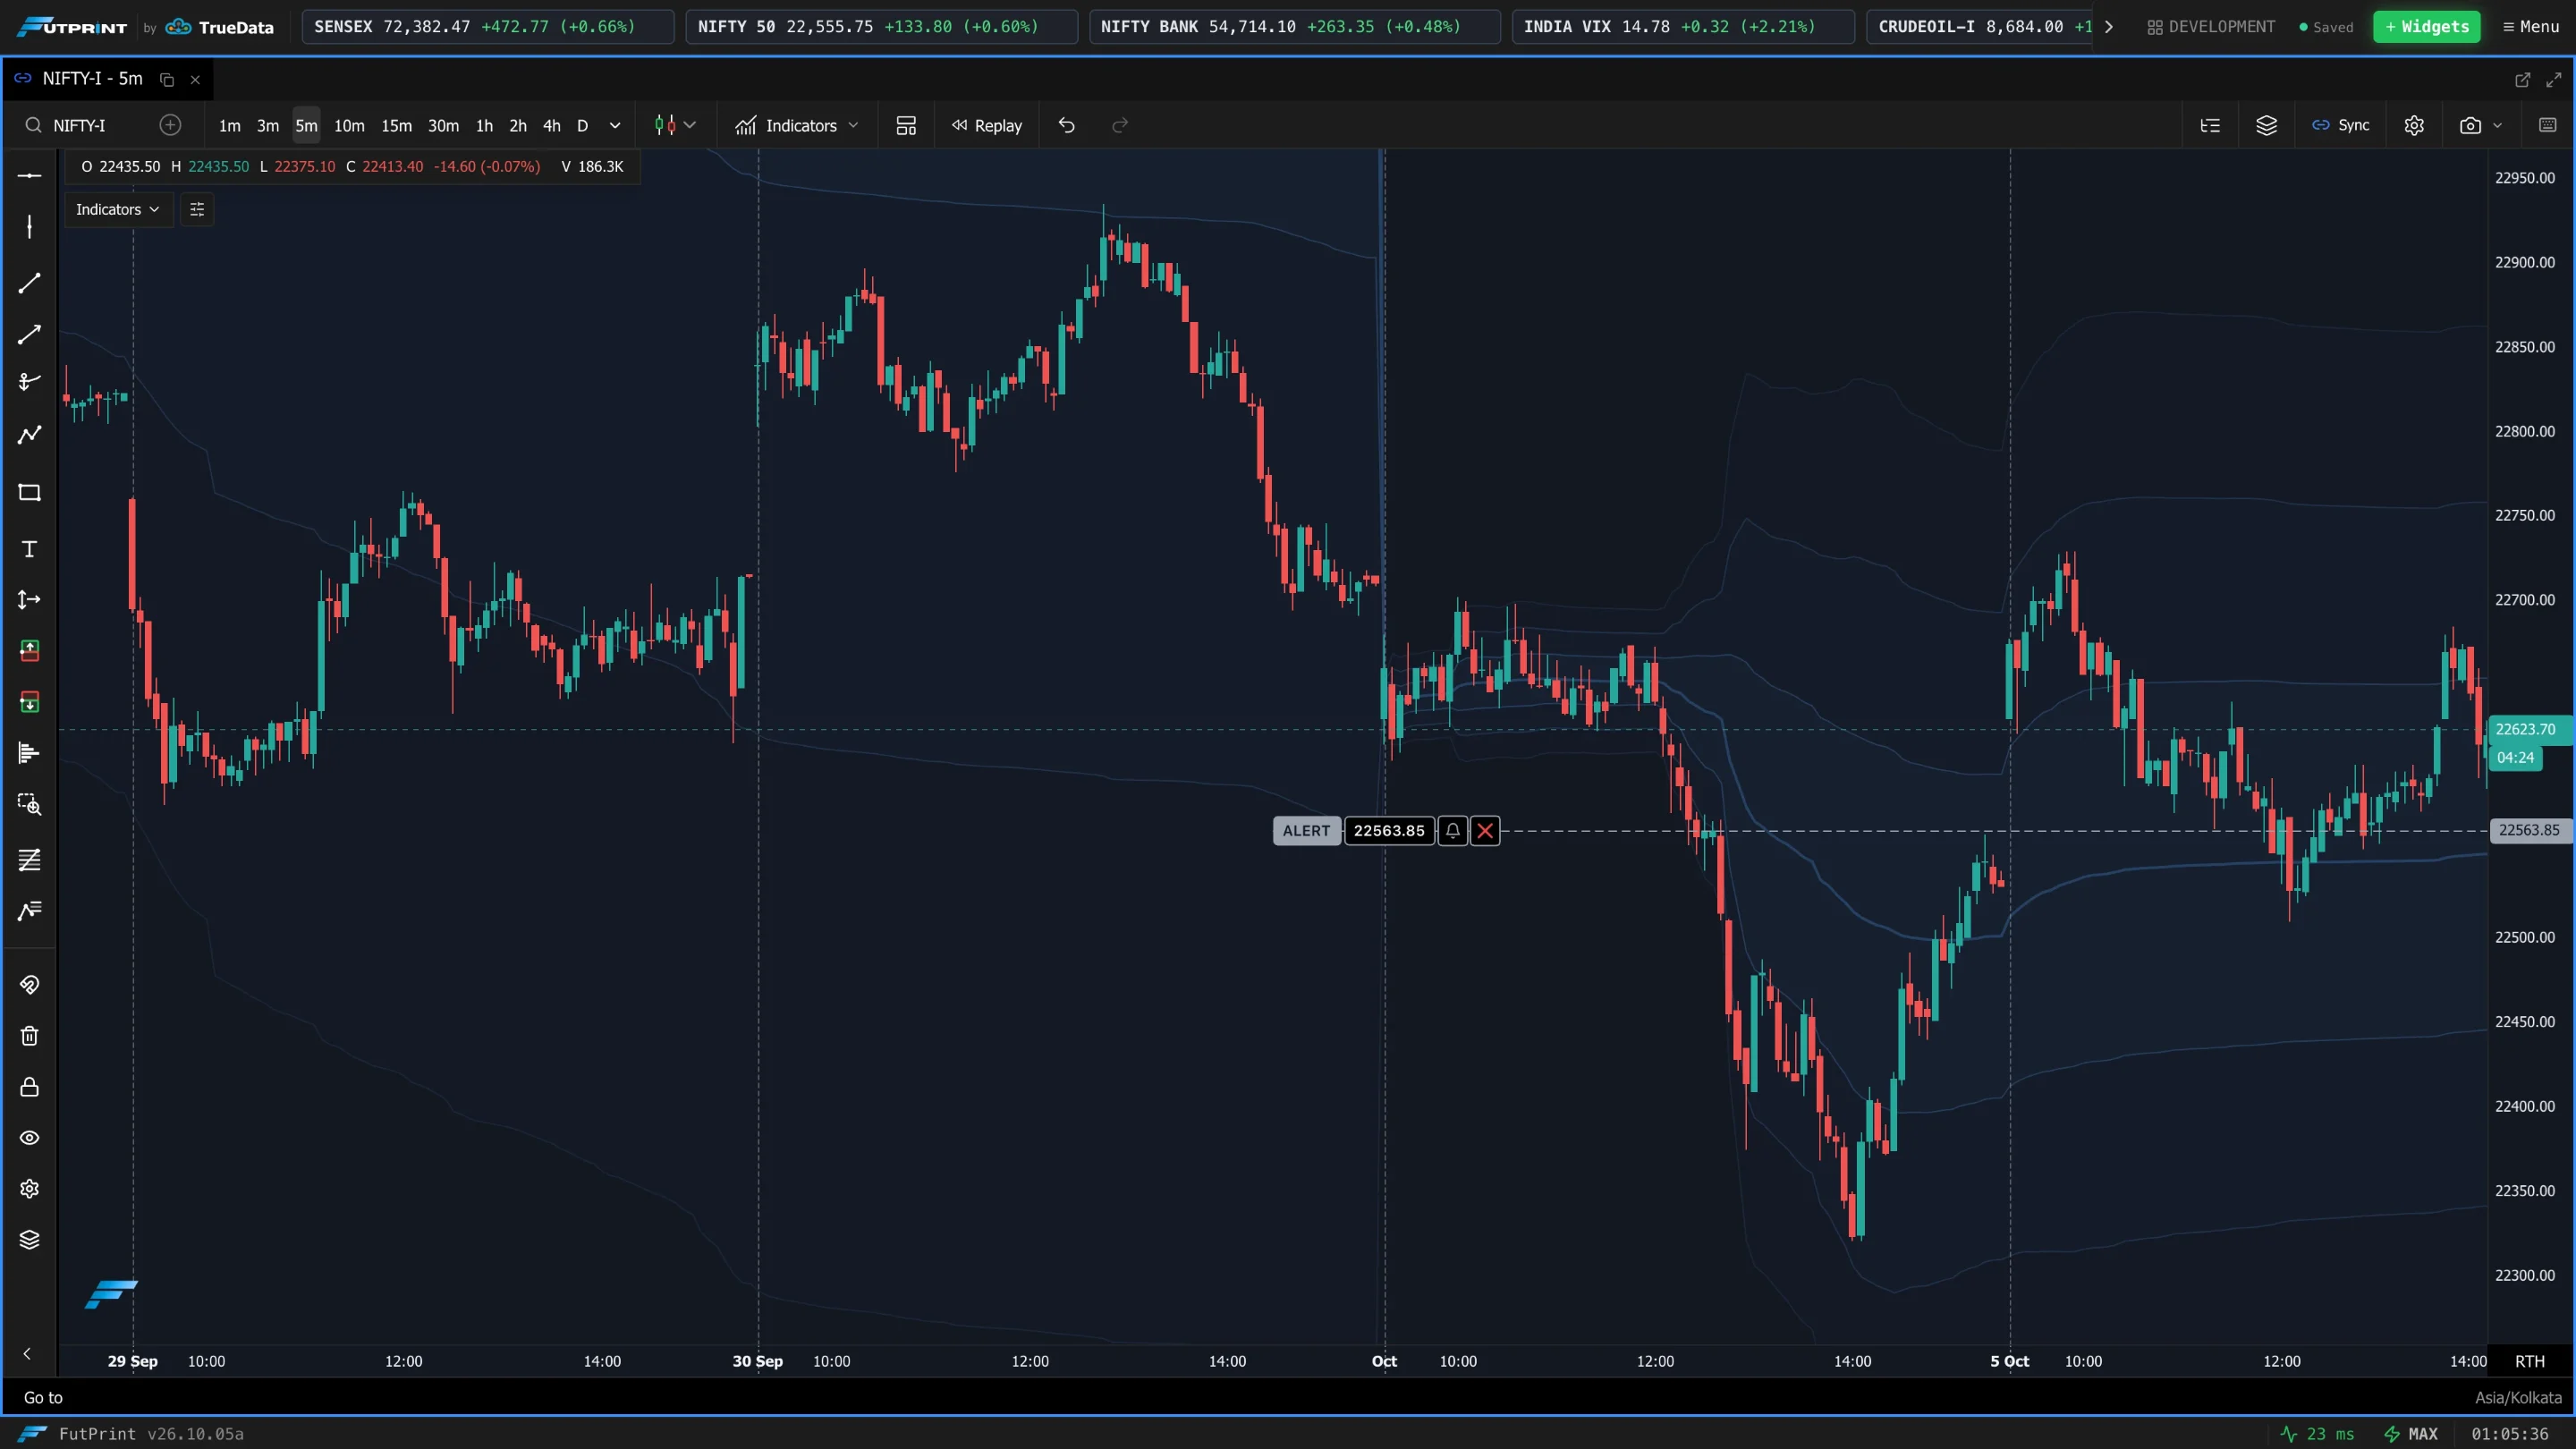
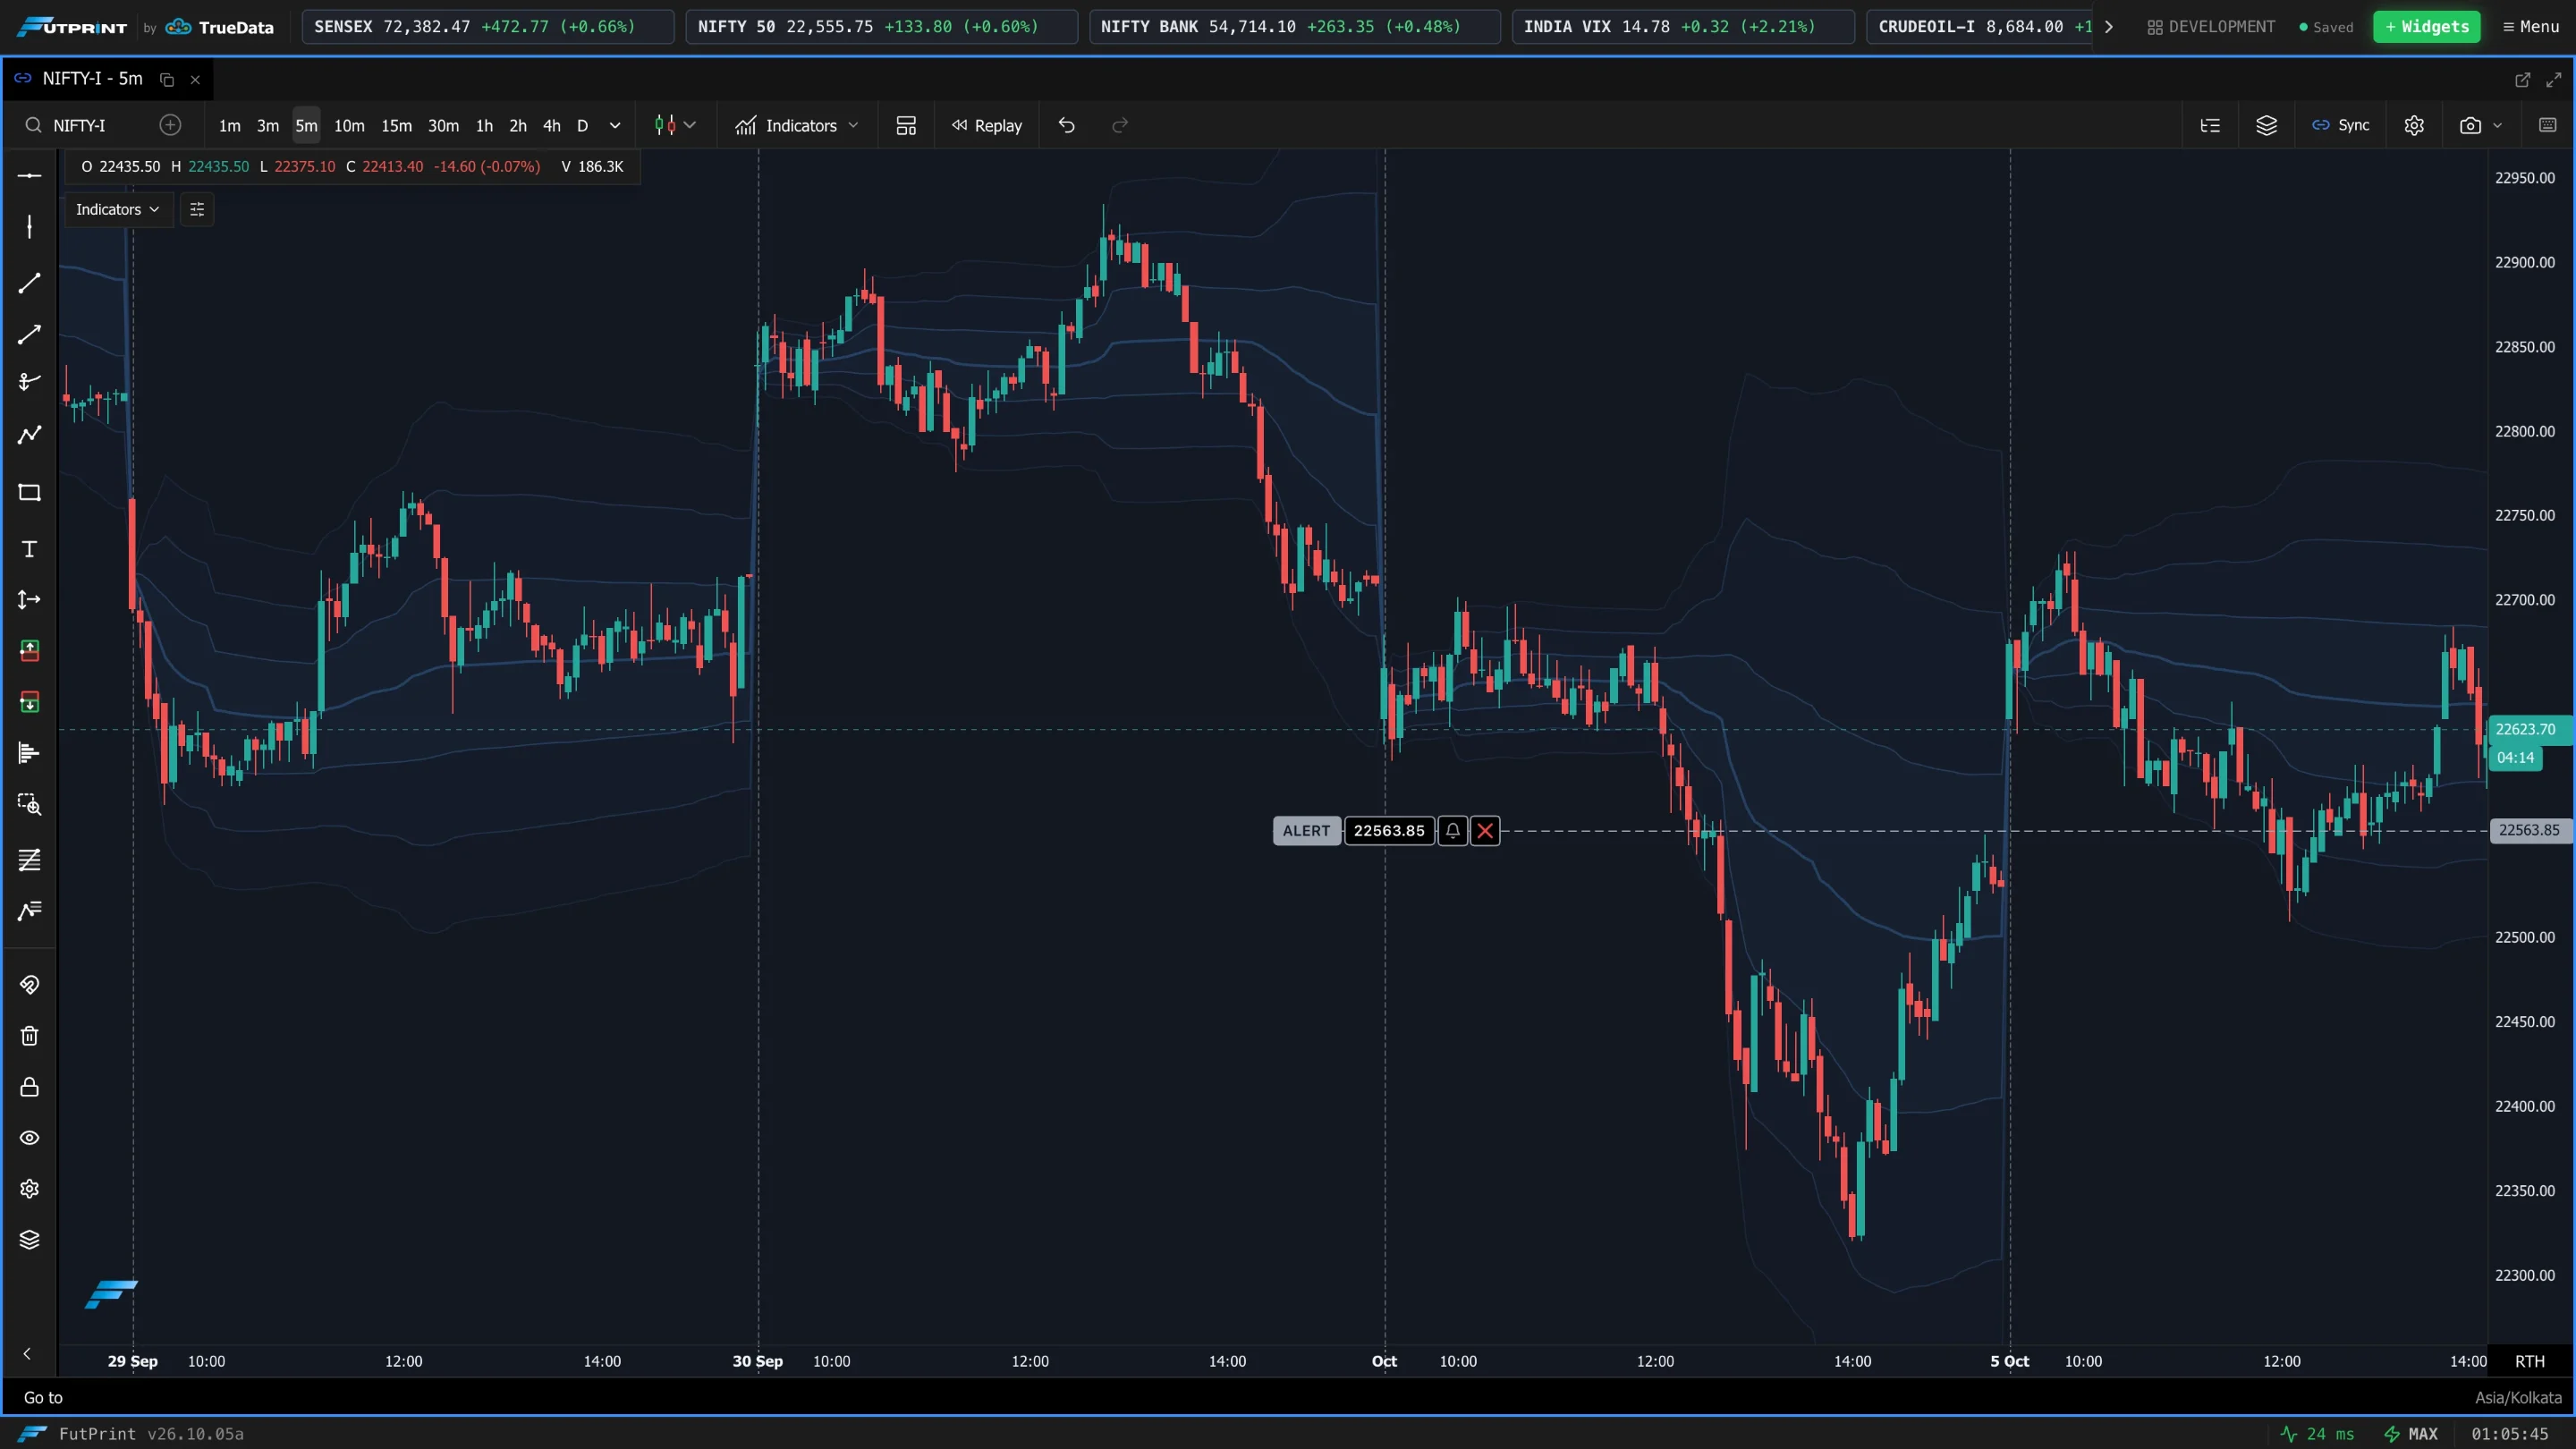
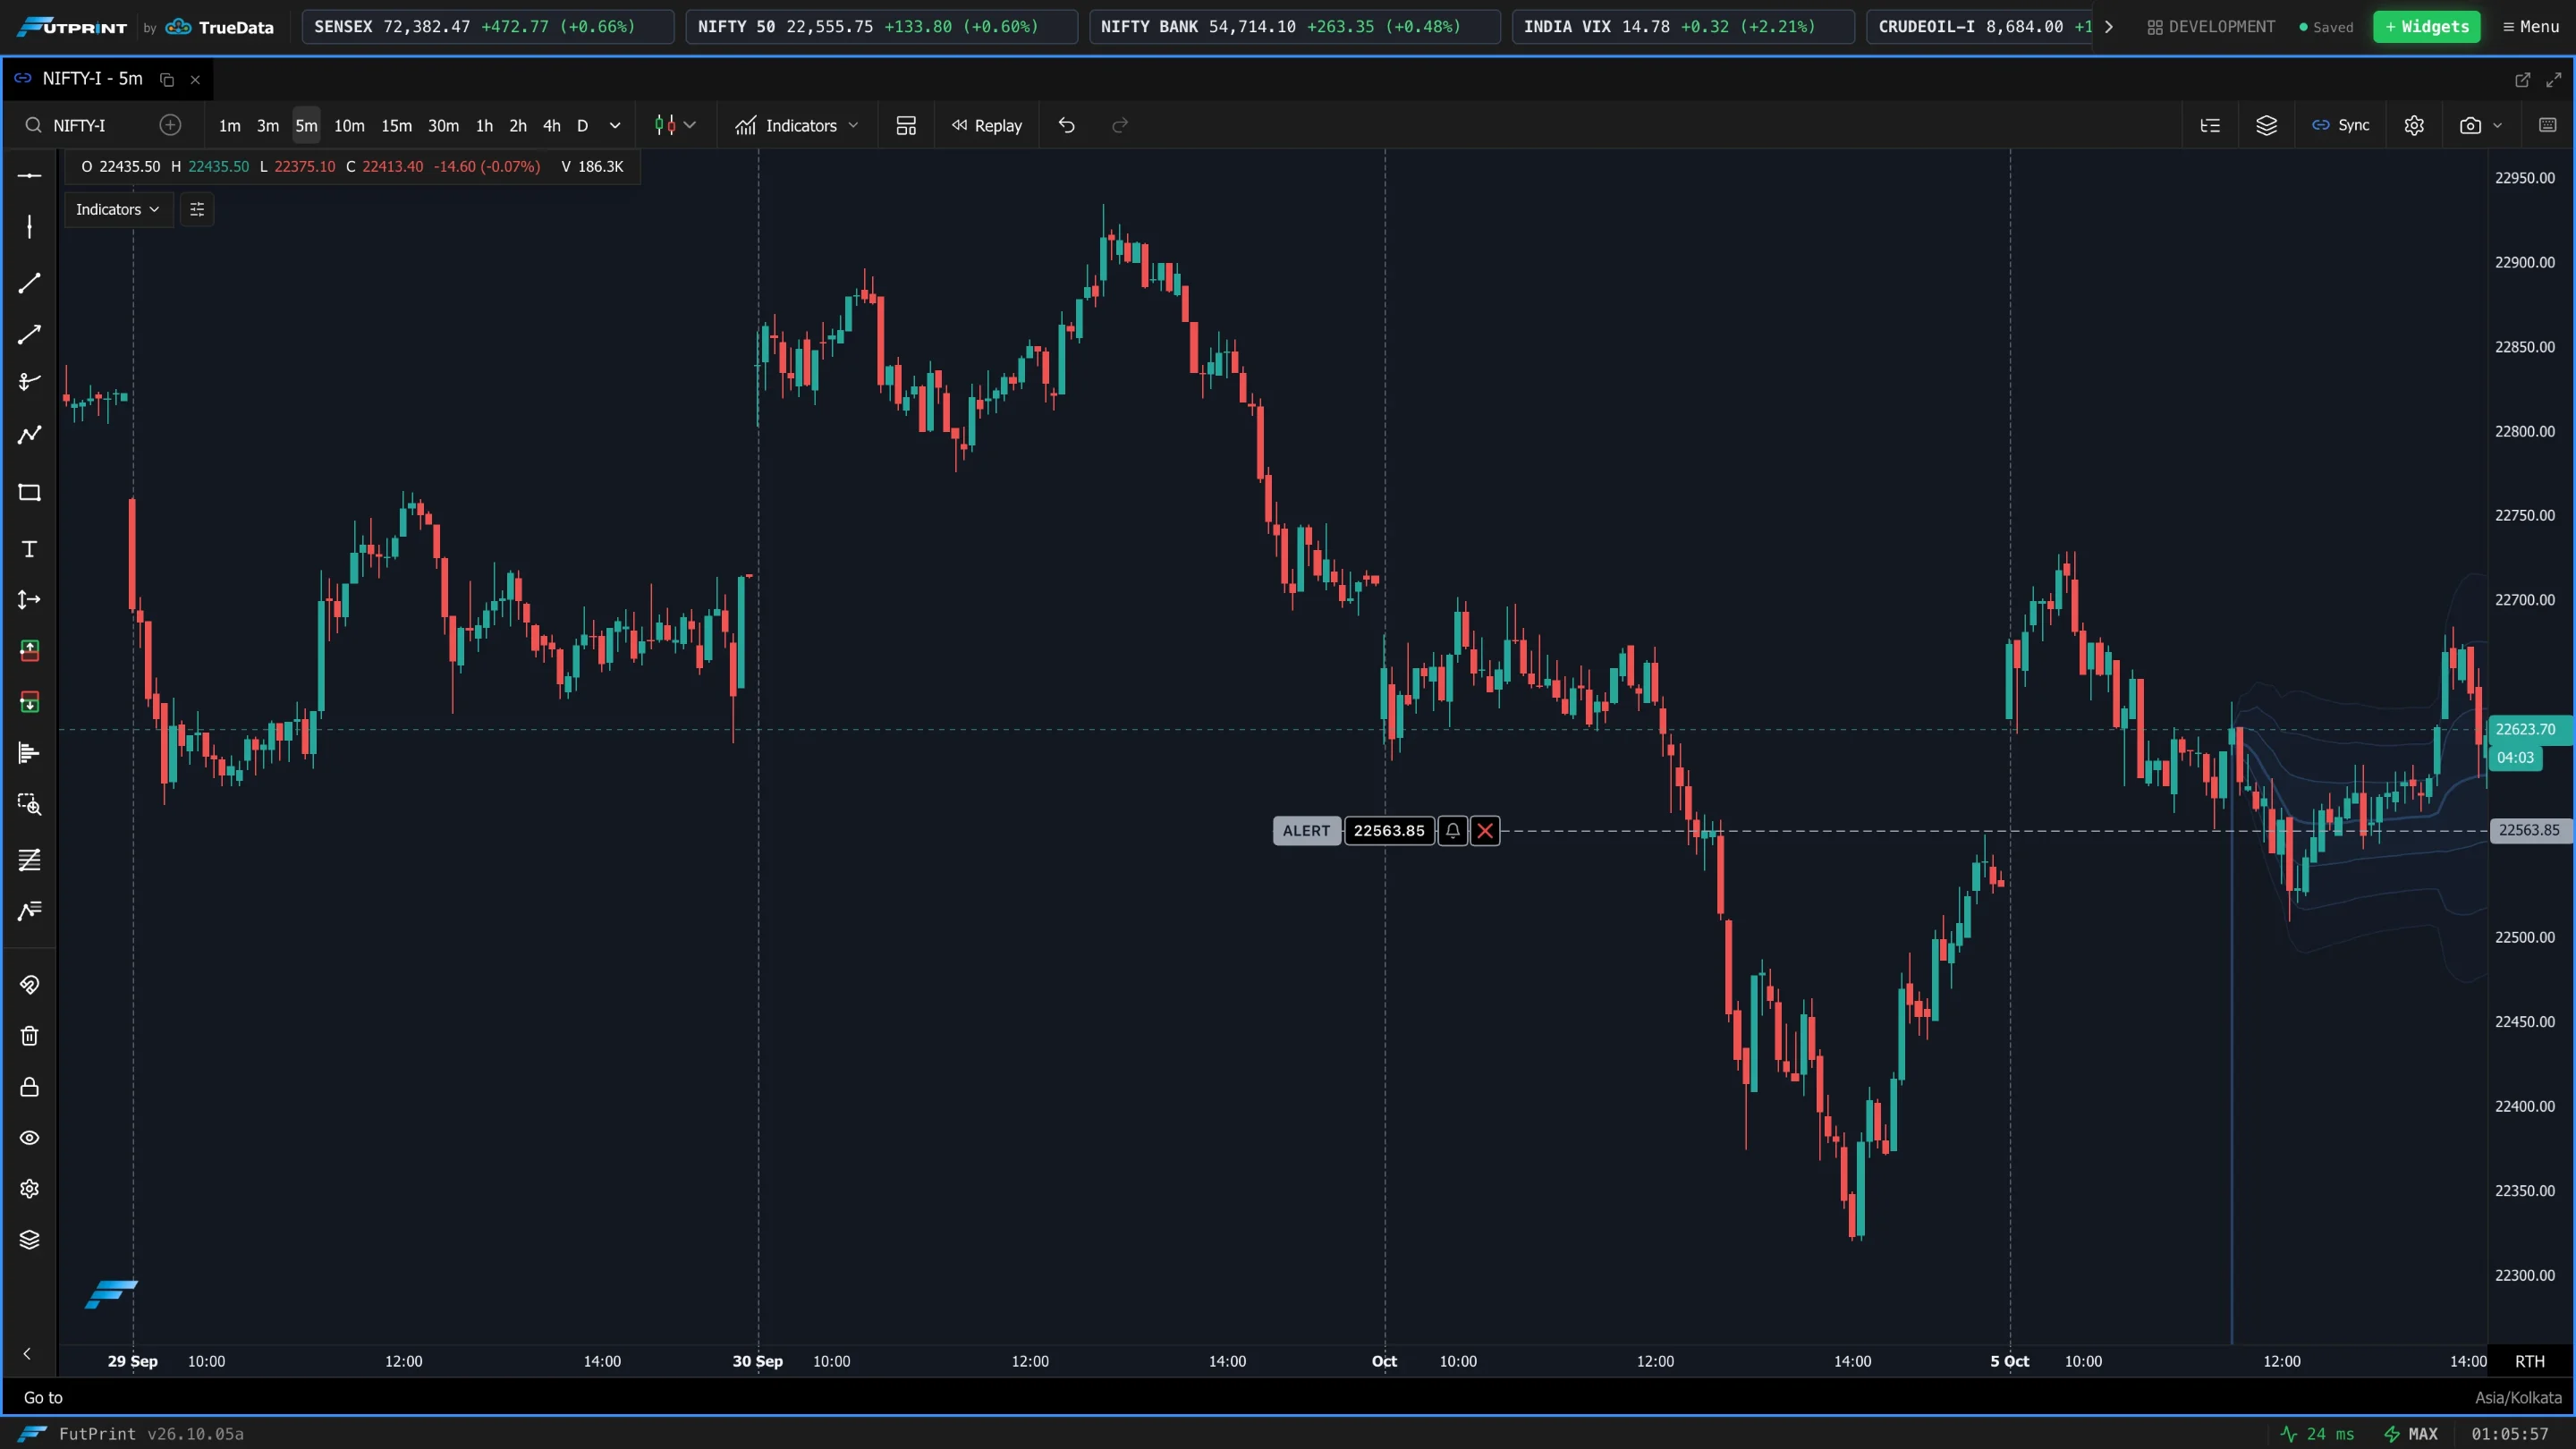
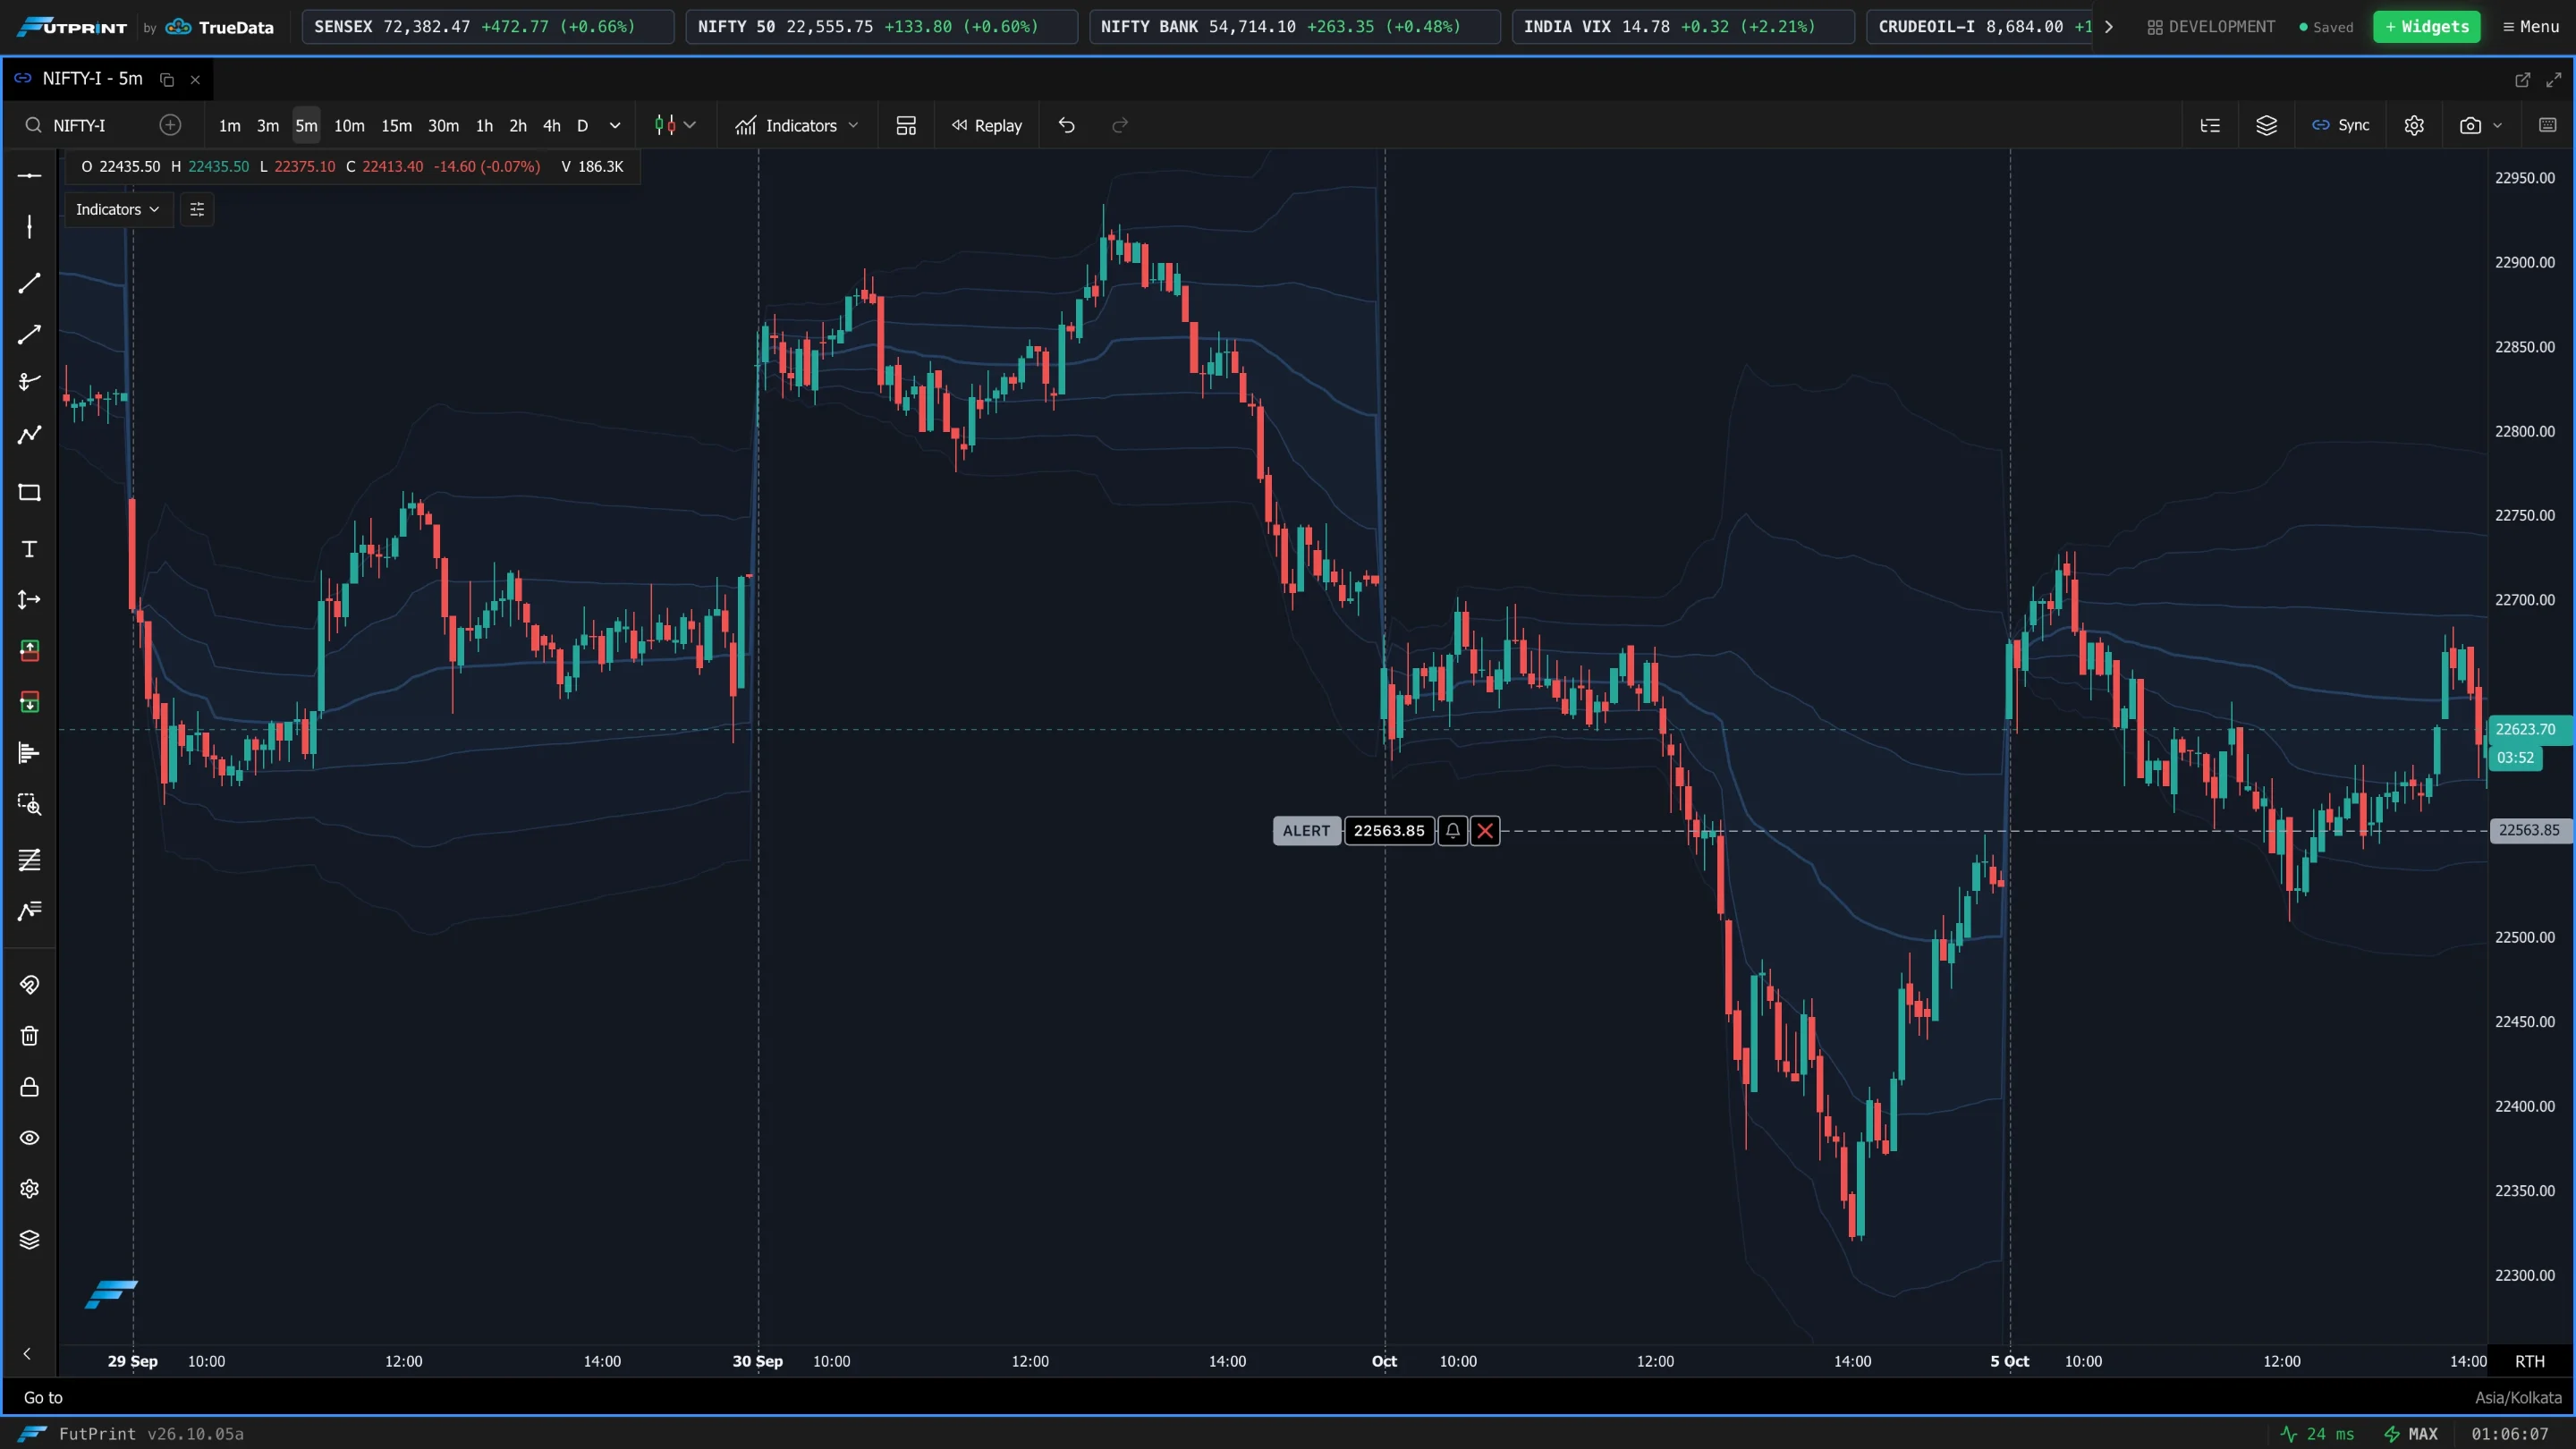
Bands & Fills
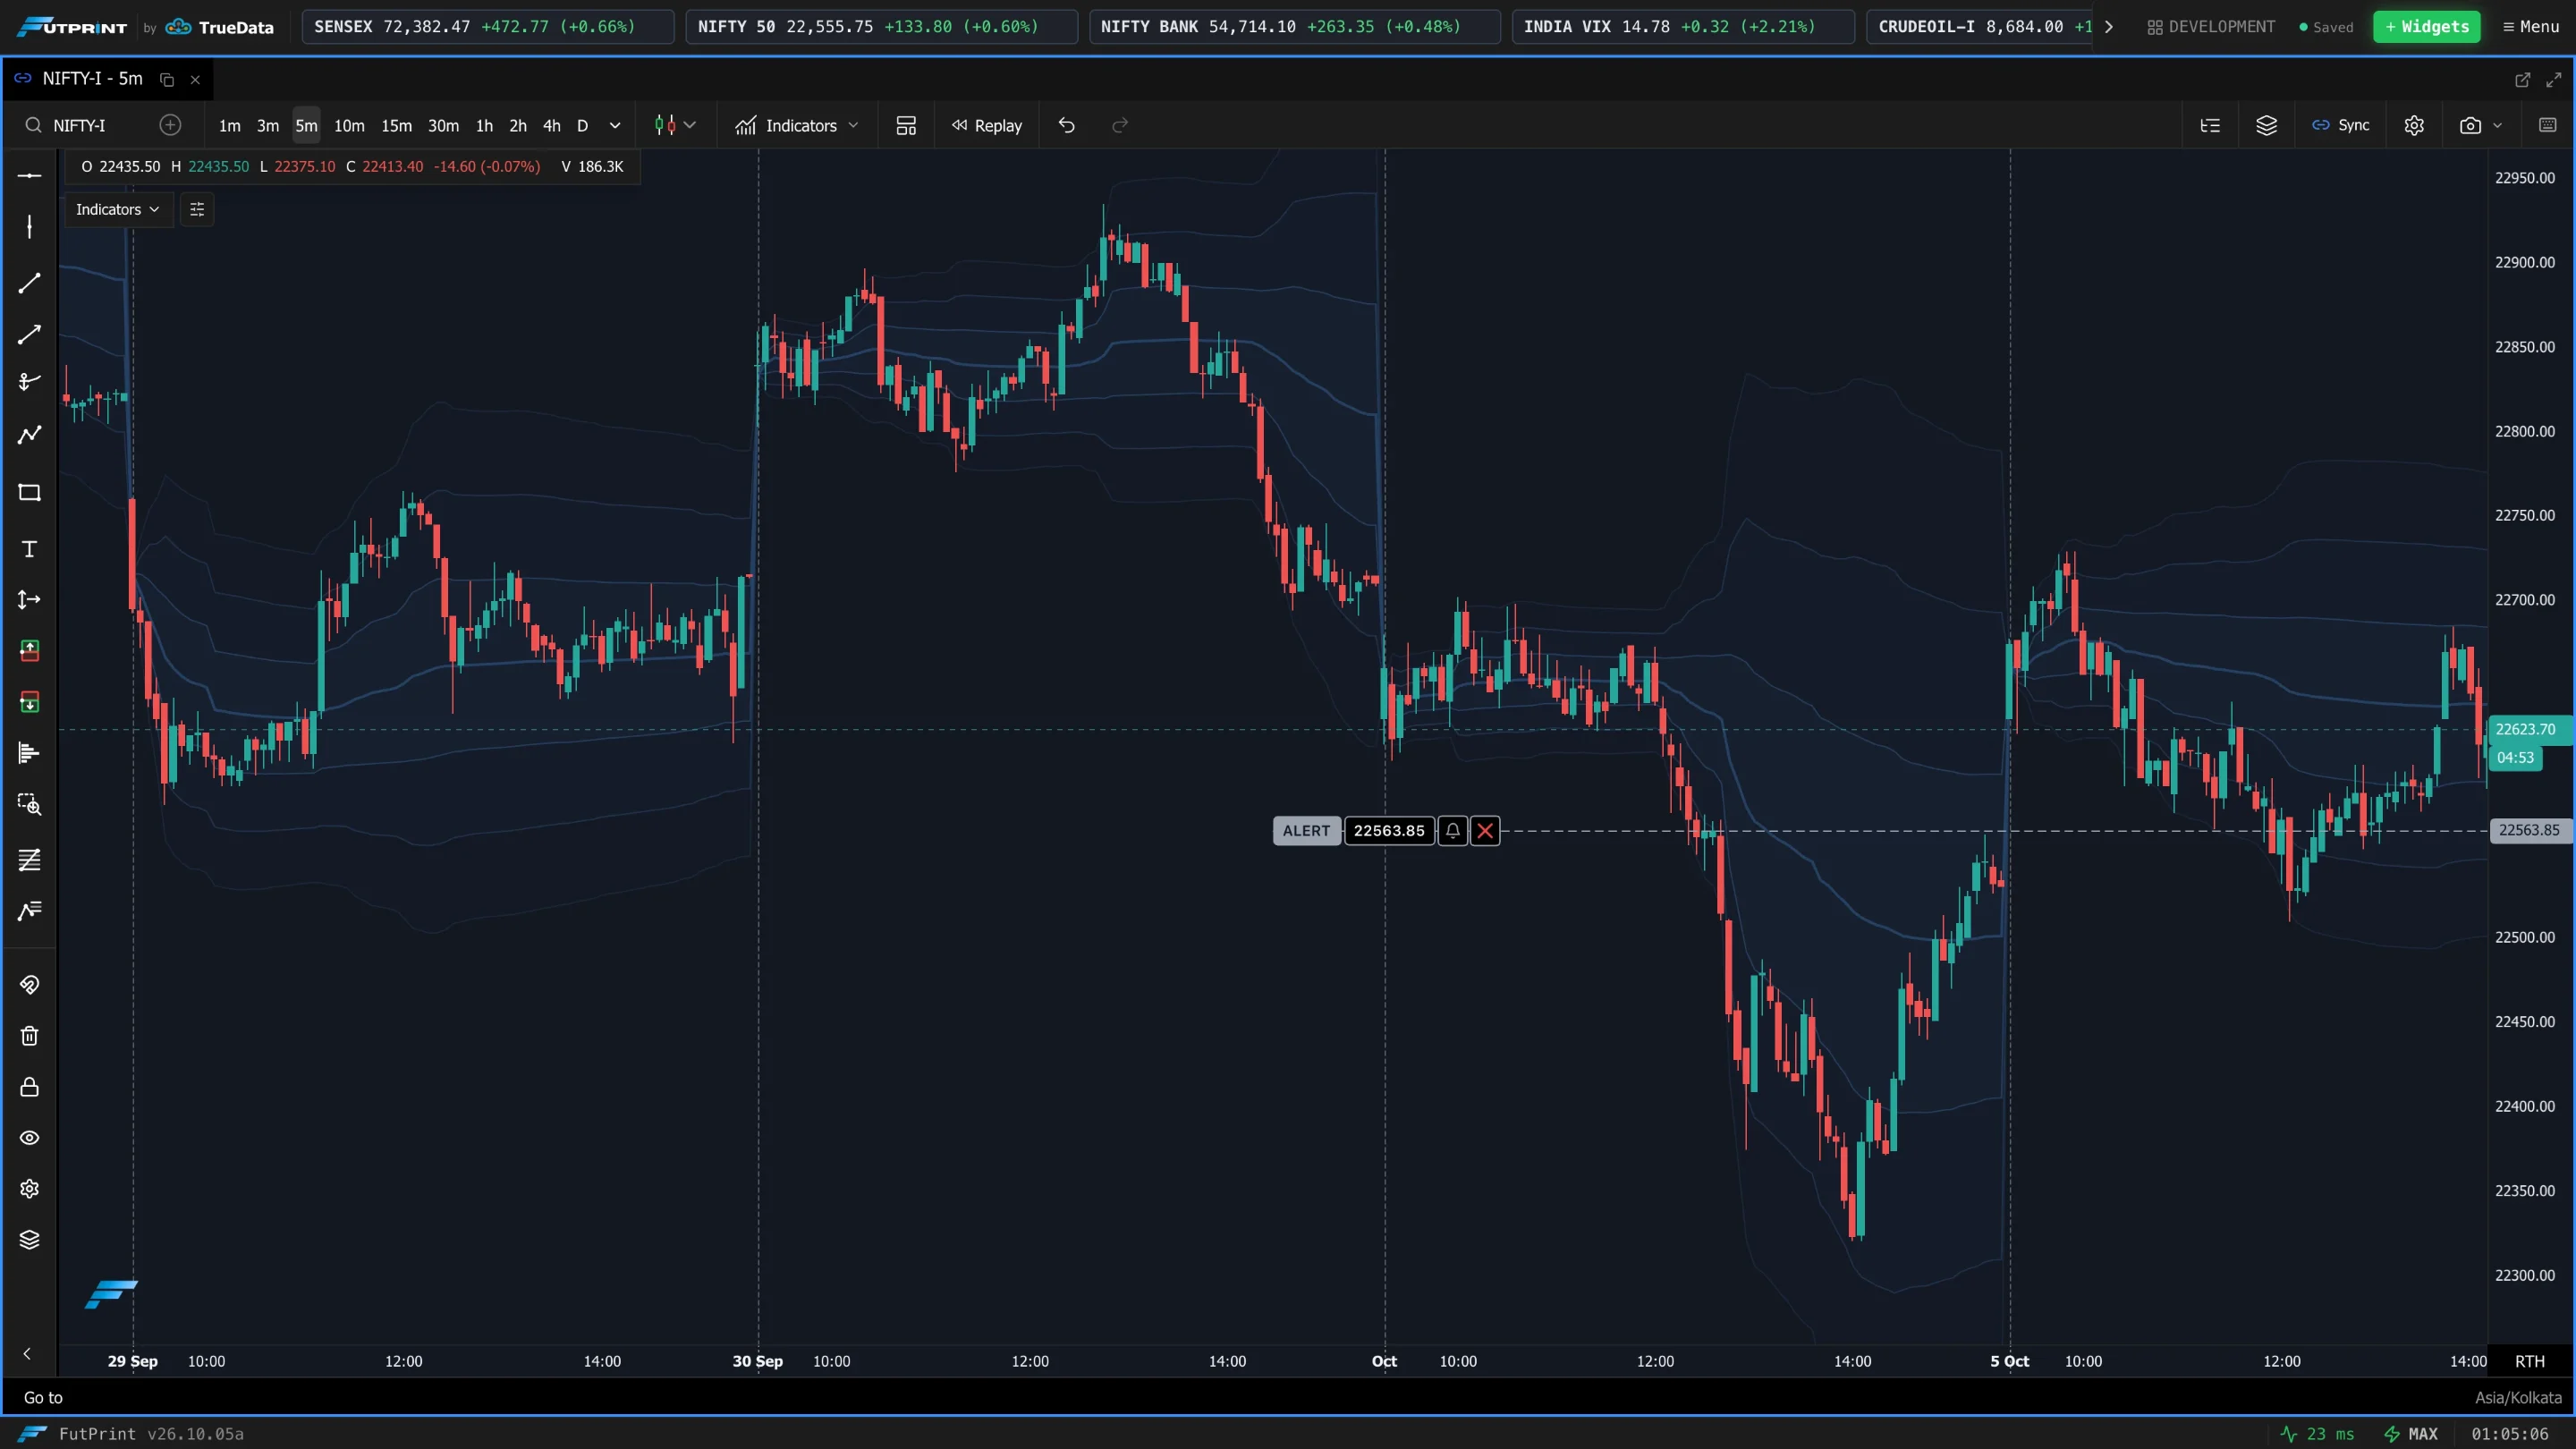
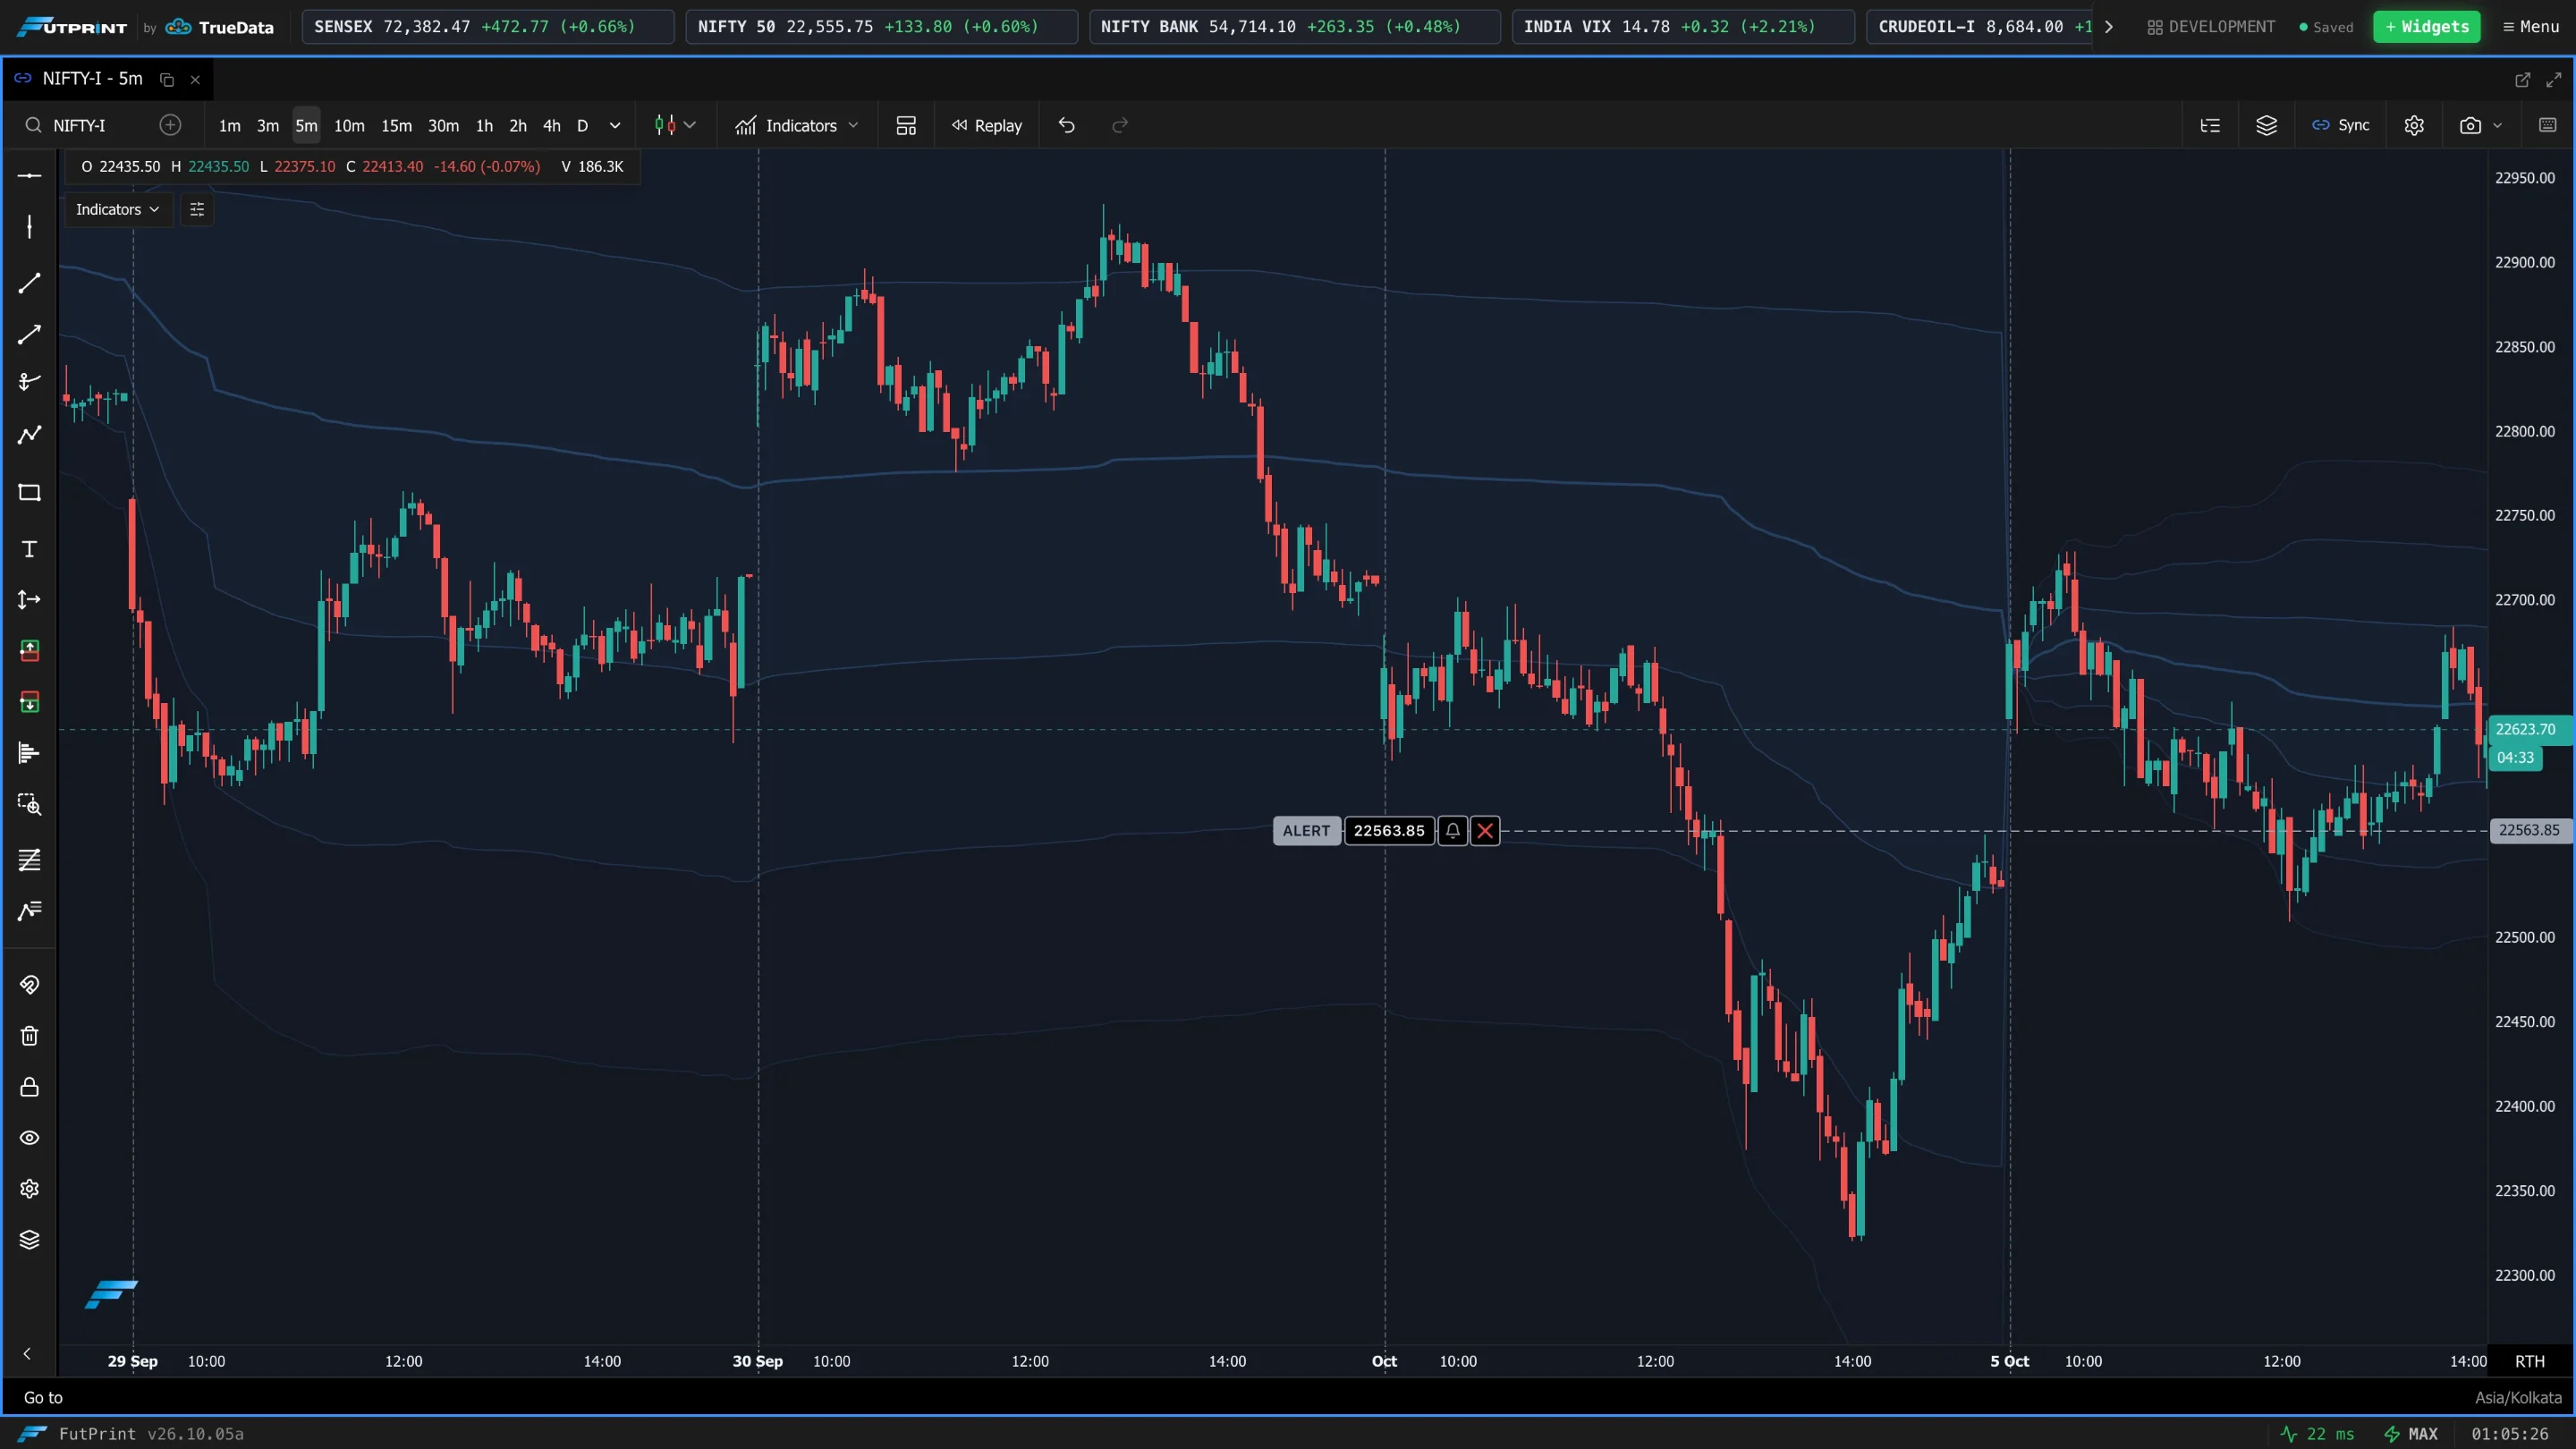
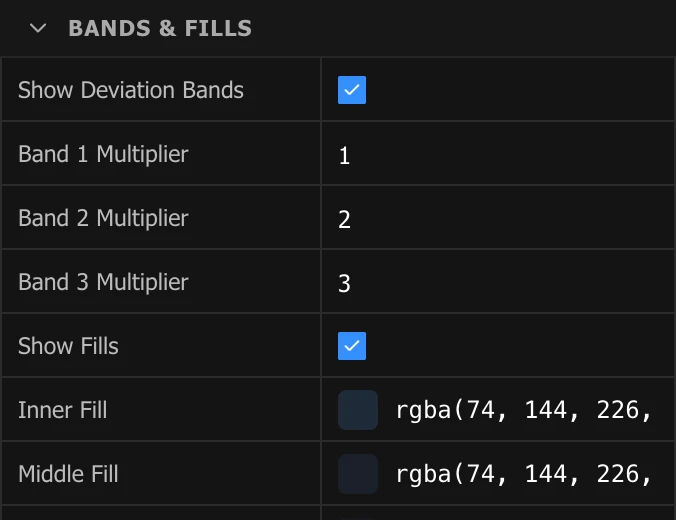
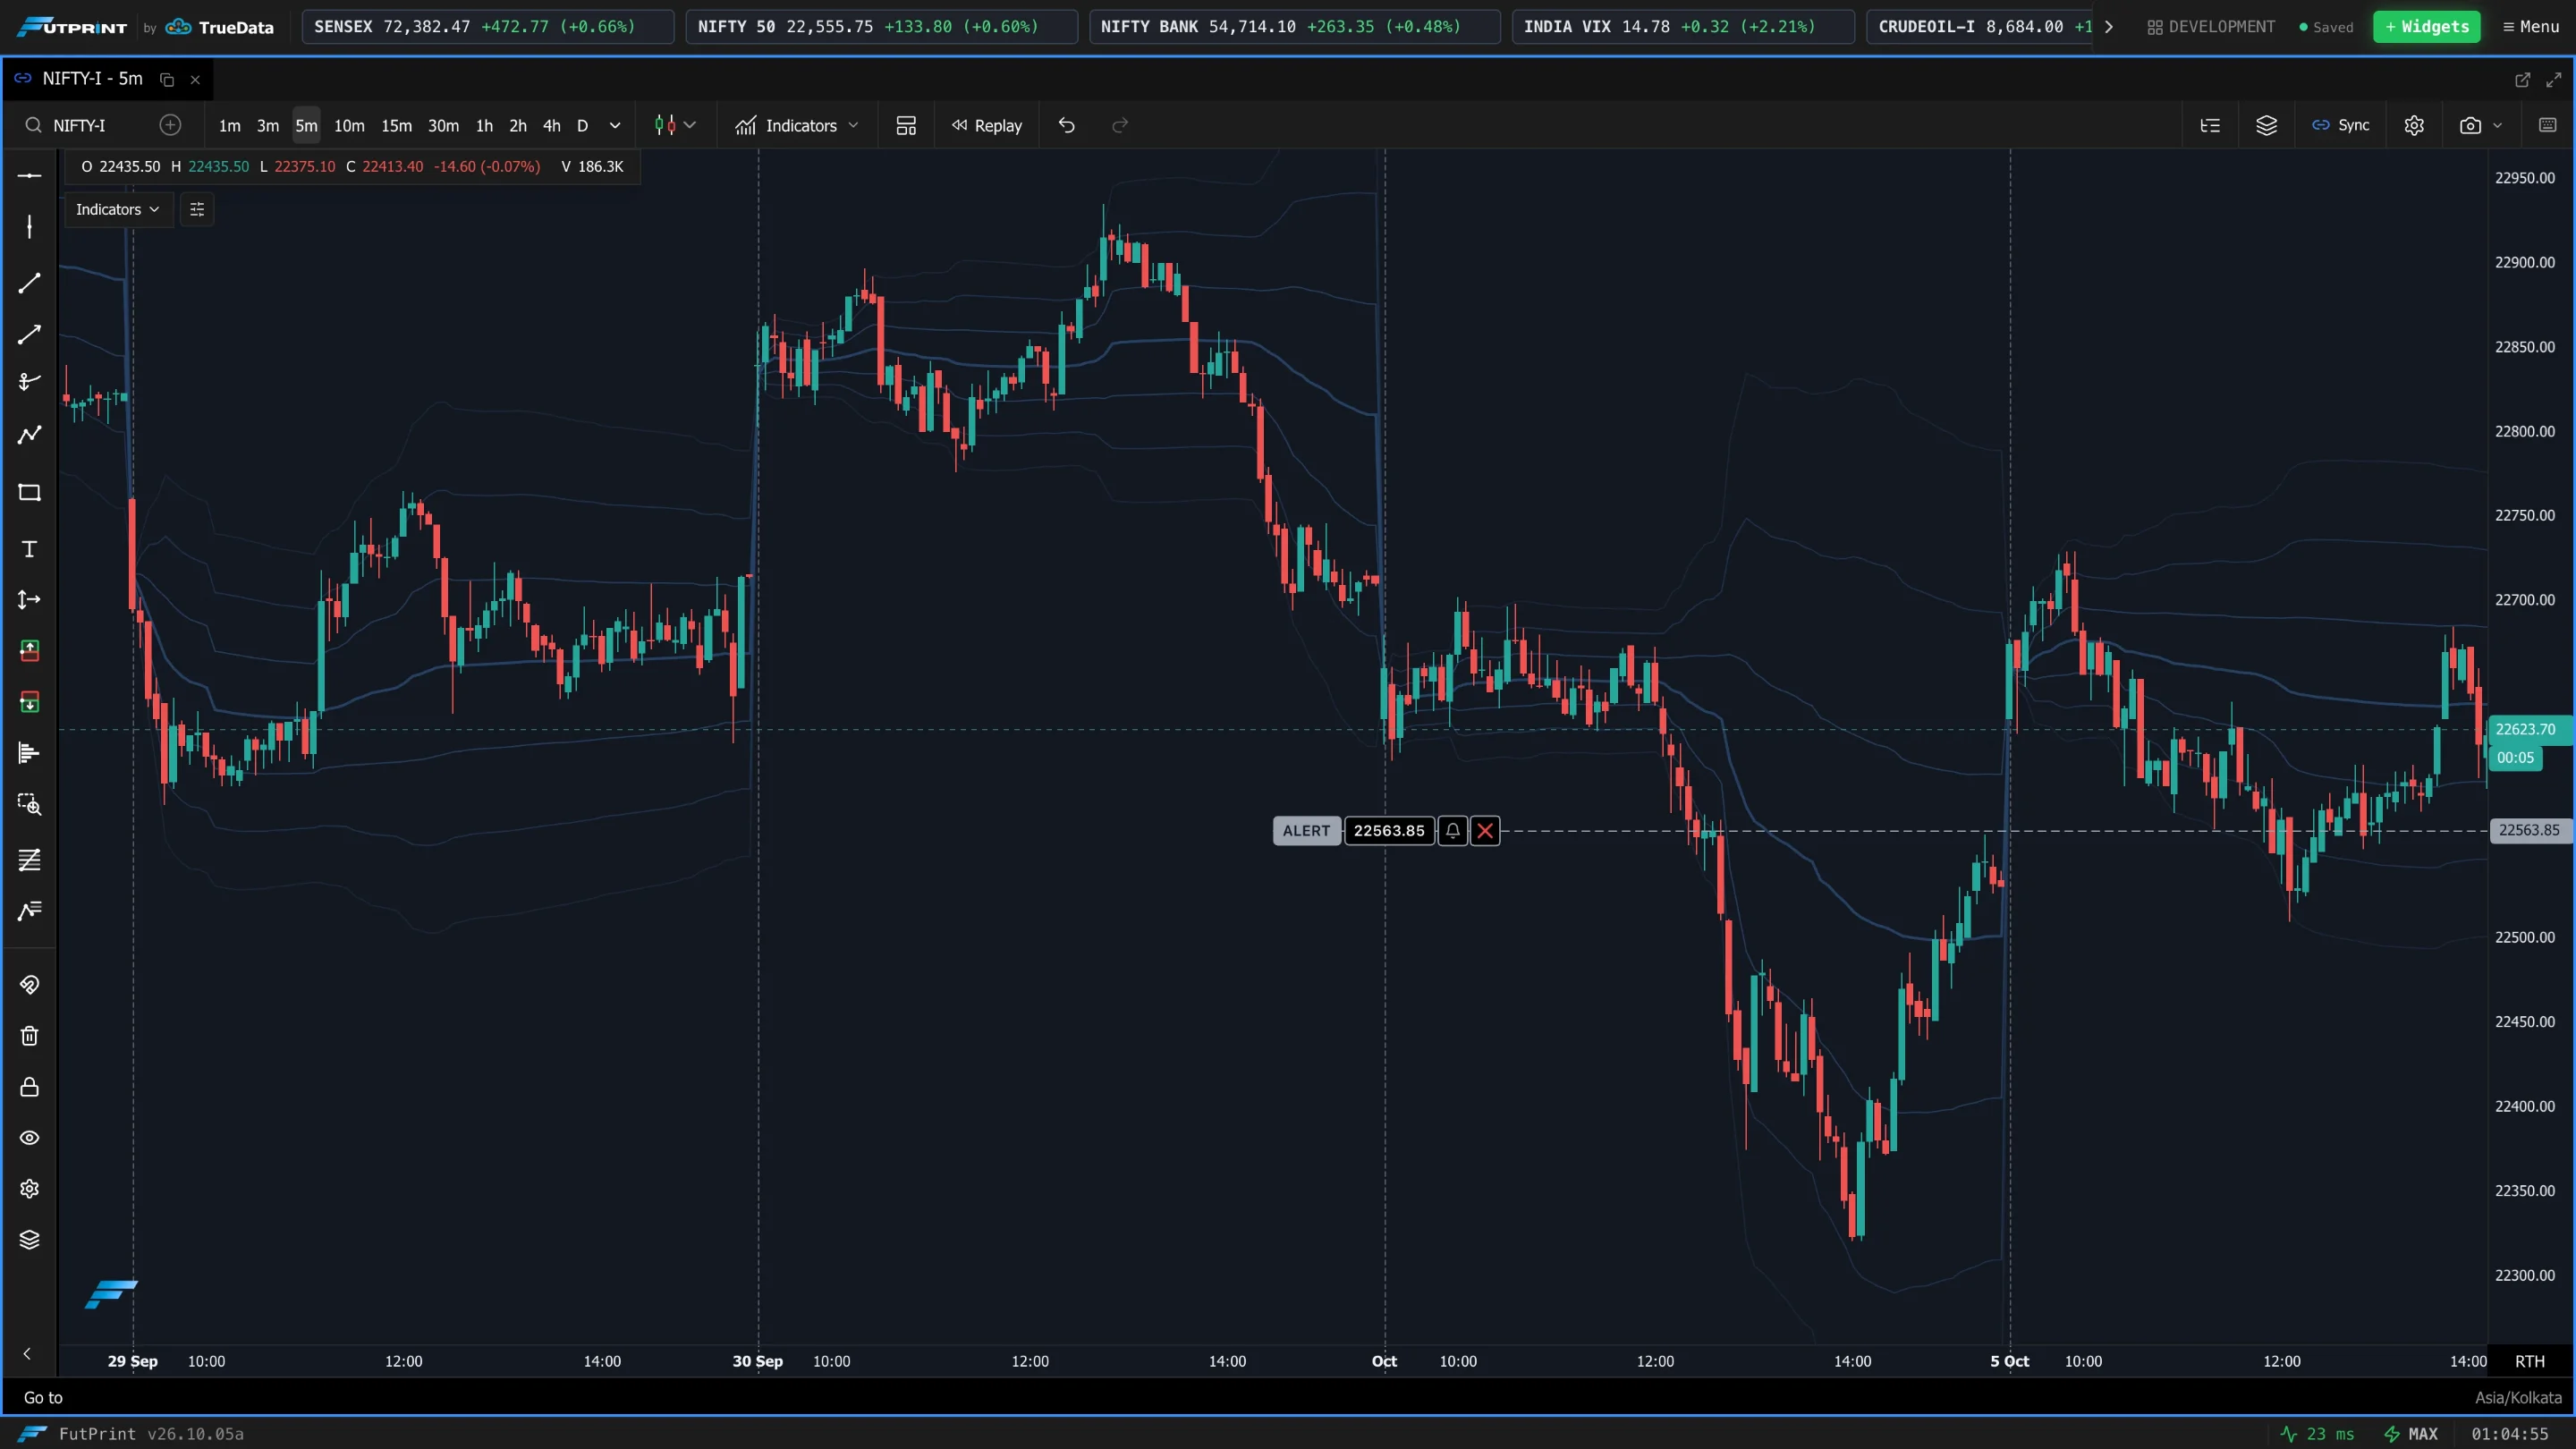
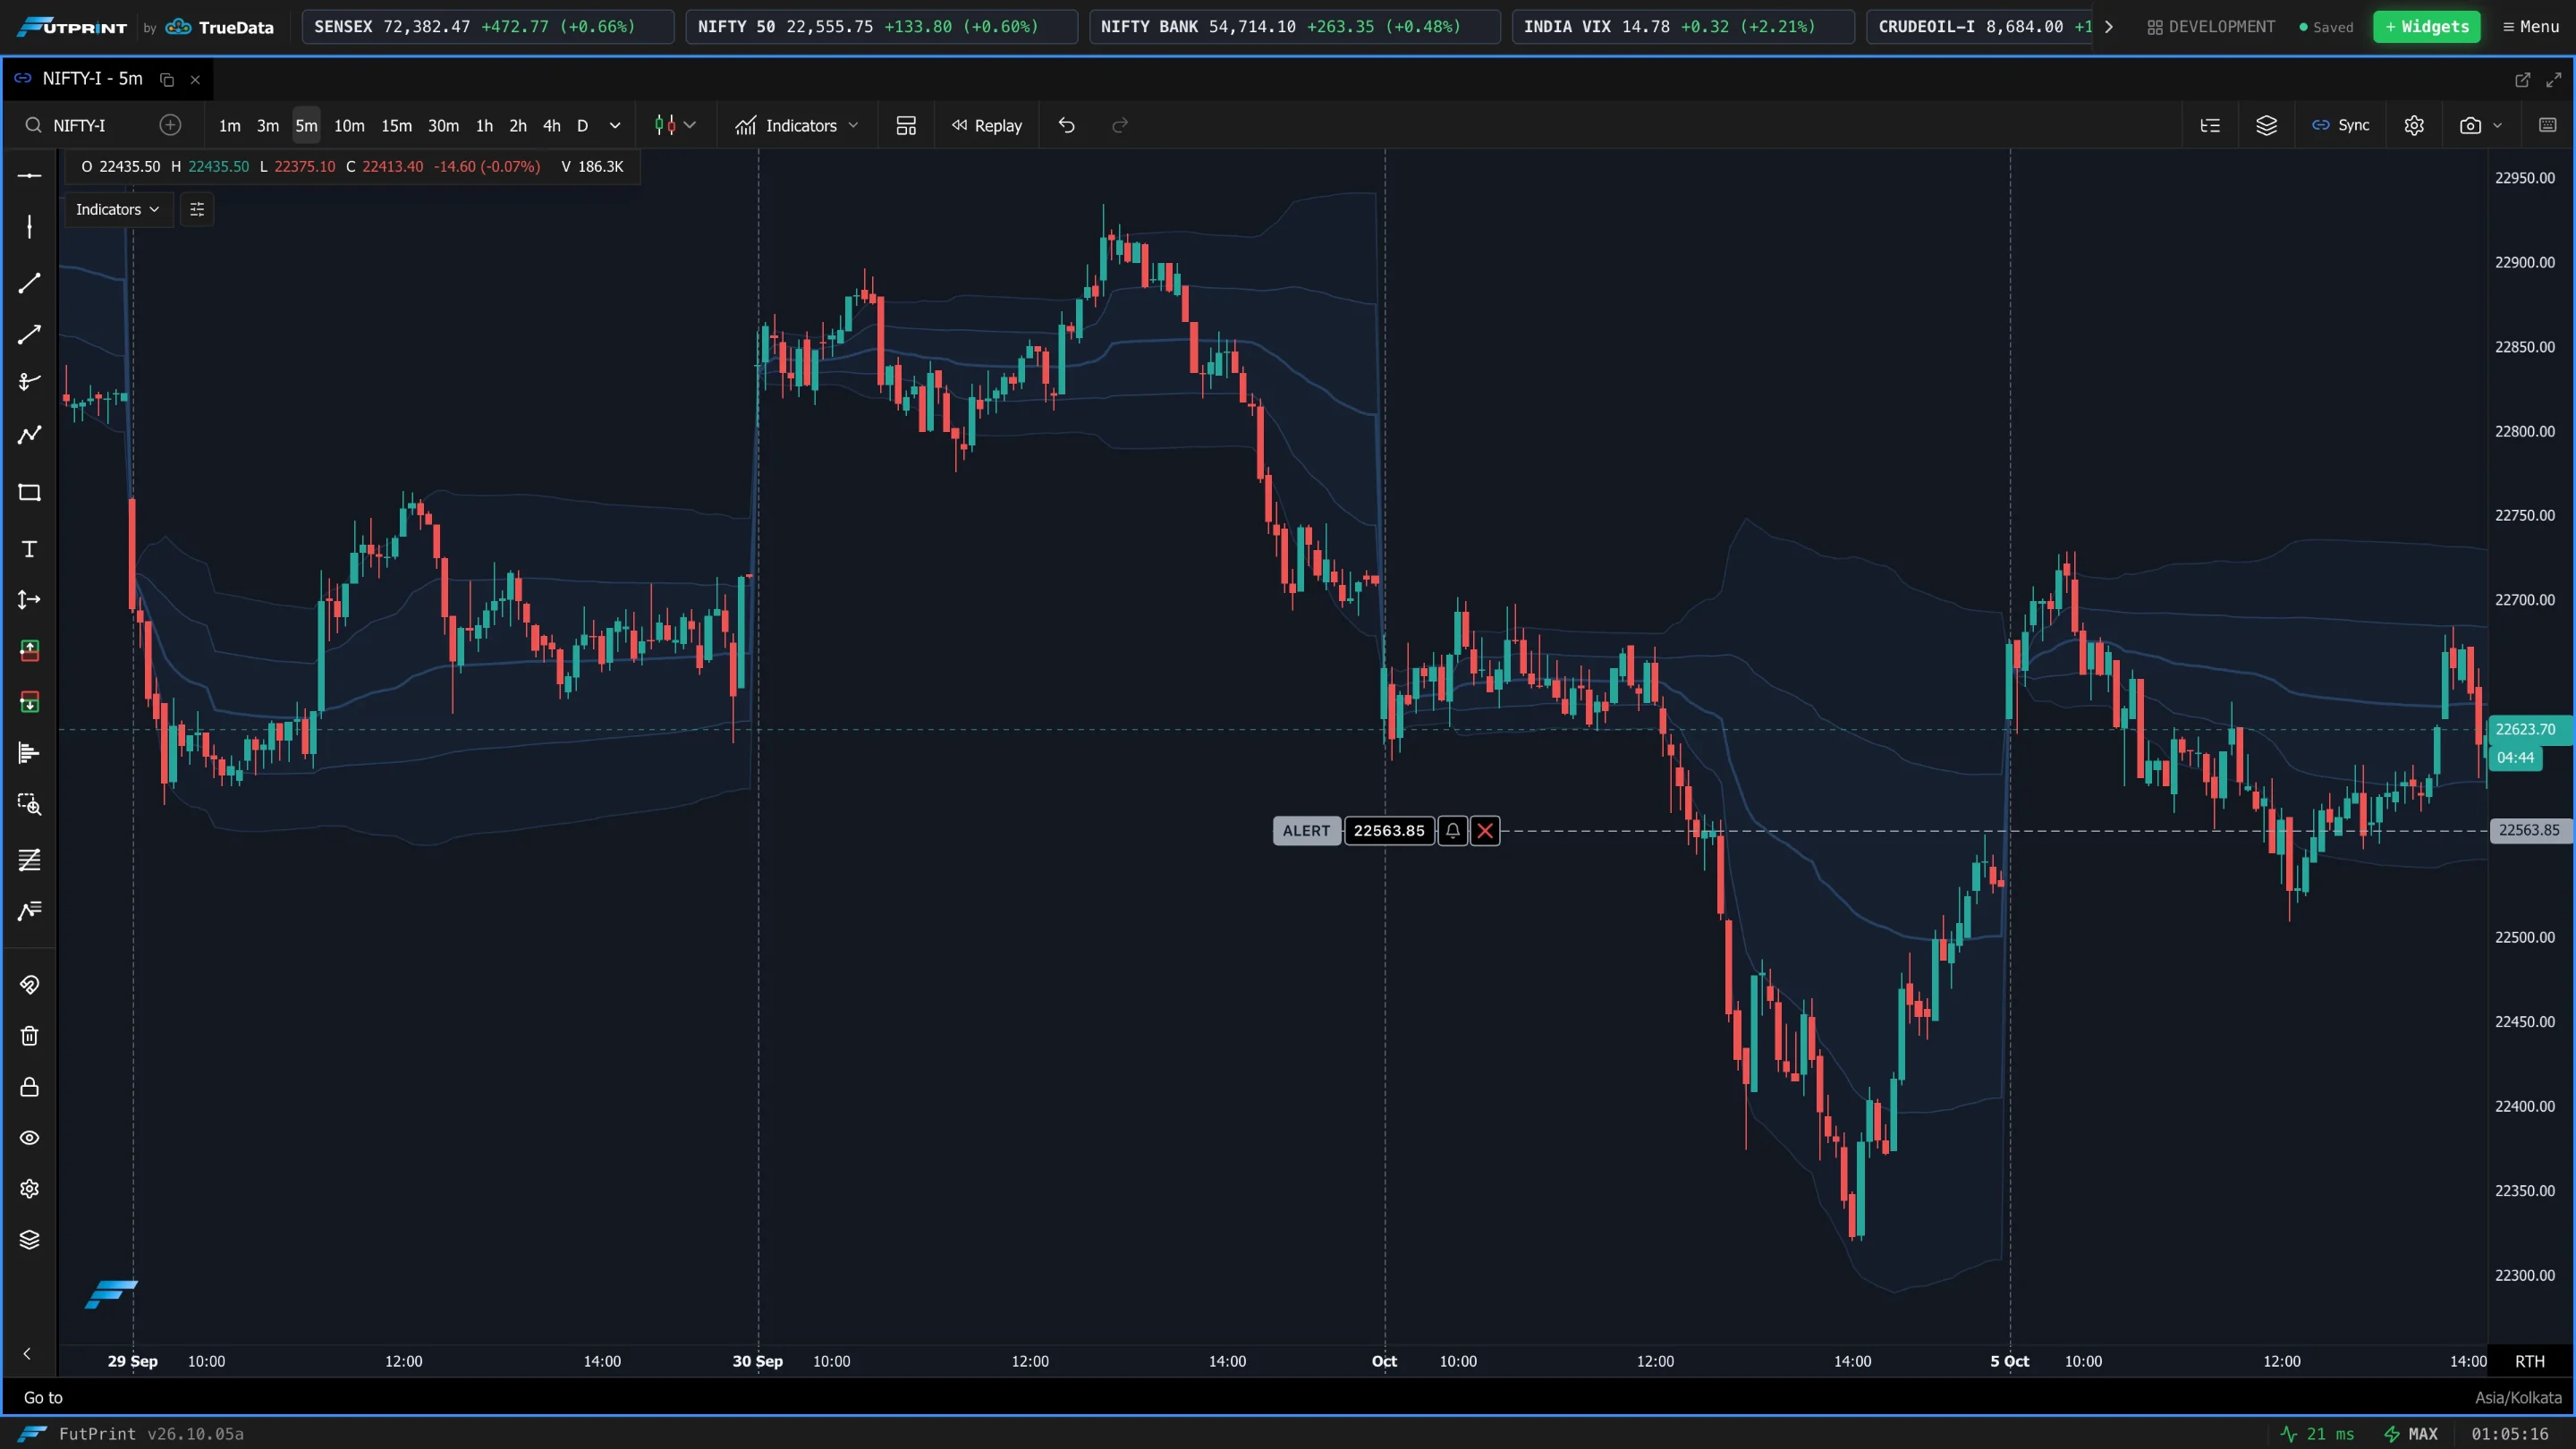
Deviation bands are drawn a set number of standard deviations above and below the VWAP. They frame how far price has stretched from the average.
| Setting | What it does |
|---|---|
| Show Deviation Bands | Turn the bands on. |
| Band 1 / 2 / 3 Multiplier | Distance of each band from the VWAP in standard deviations. Set a multiplier to 0 to hide that band. |
| Show Fills | Shade the area between the bands. |
| Inner / Middle / Outer Fill | Colours of the shaded zones. |
Line Styles
One row each for the VWAP Line and the upper and lower lines of bands 1, 2 and 3 — in that order — with a colour, a width and a style (Solid, Dashed or Dotted). Rows for a band appear only while that band is shown.
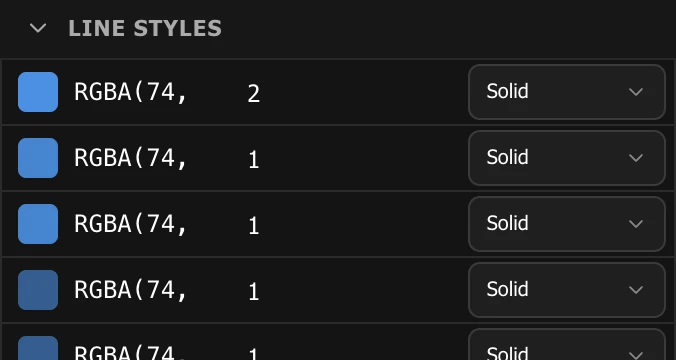
The default line colours are subtle. If the VWAP is hard to see on your chart, raise the VWAP Line width to 2 or pick a brighter colour here.
Using VWAP
- Bias — above VWAP favours longs for the period, below favours shorts.
- Mean reversion — moves to the second or third band are stretched; many traders look for a return toward VWAP from there.
- Higher-timeframe context — add a second VWAP with a Weekly or Monthly anchor to see where the larger average sits.