See aggression and absorption as it prints
The core of the platform — footprint clusters, the most comprehensive volume profile suite, market profile (TPO), delta, VWAP and a full time & sales tape. Read the market's microstructure, not yesterday's chart.
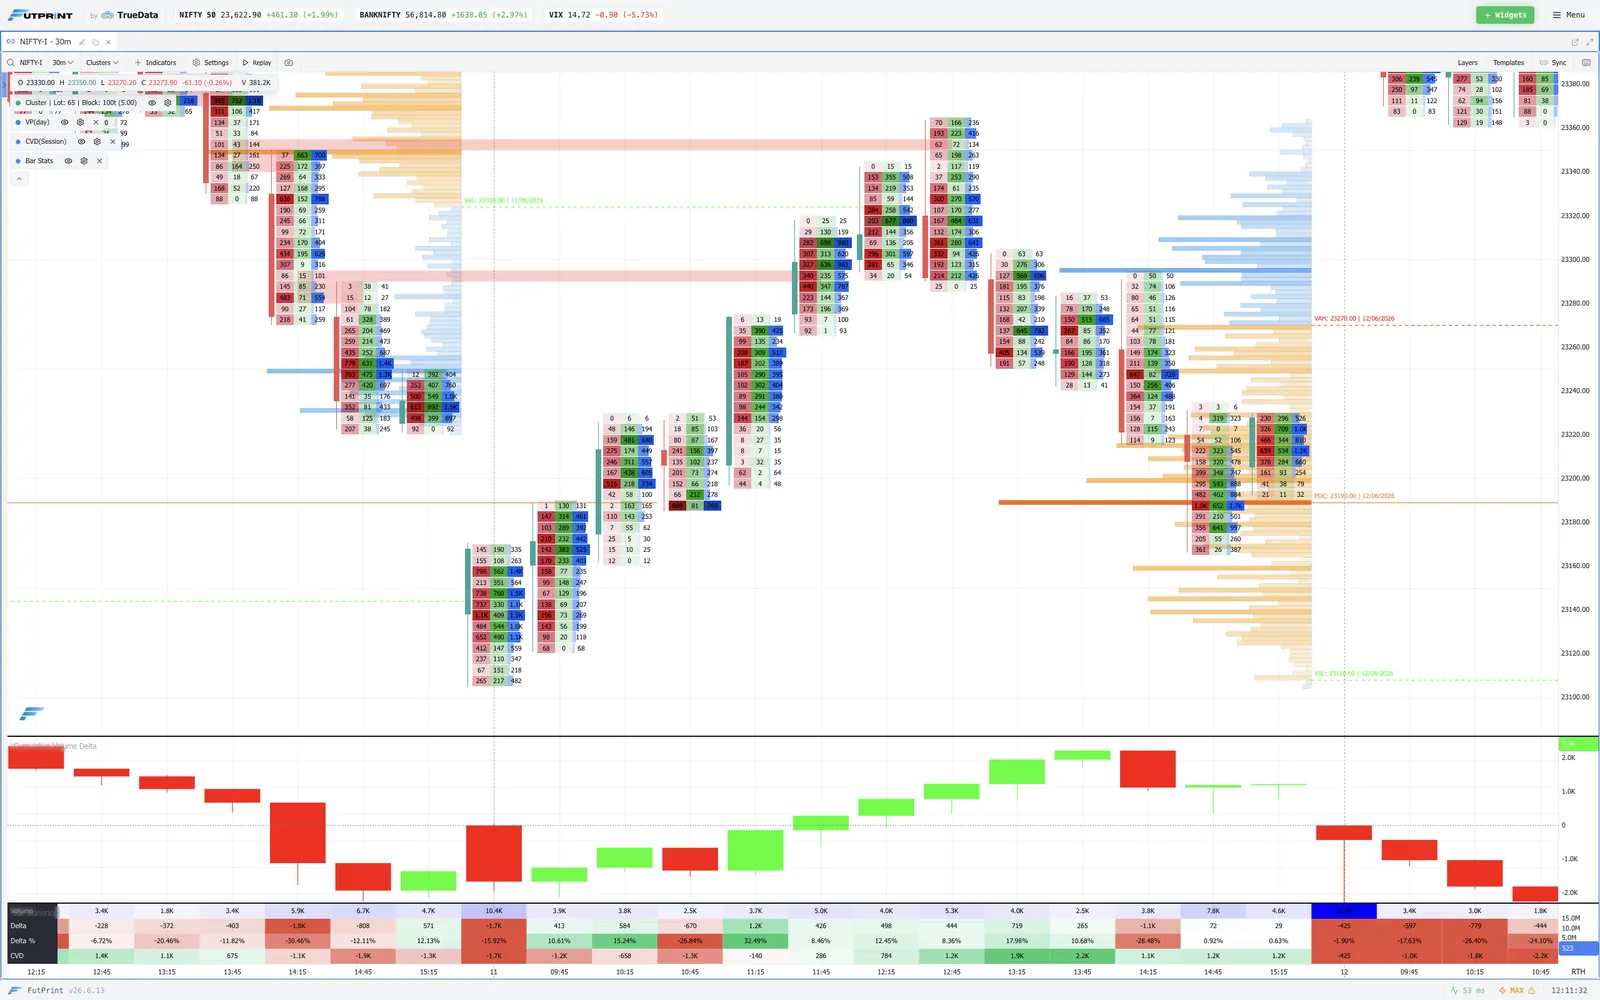
Per-price-level trade data inside every candle
Choose from nine data points per column and display up to three columns at once, each configured independently — with imbalance, value area and divergence highlighted automatically.
- Nine selectable data points
- Up to three data columns
- User-defined imbalance thresholds
- Stacked imbalance zones
- Per-candle vPOC & value area
- Delta divergence flagging
- Power trades on the chart
- Configurable bin size
- Slim & thick candle modes
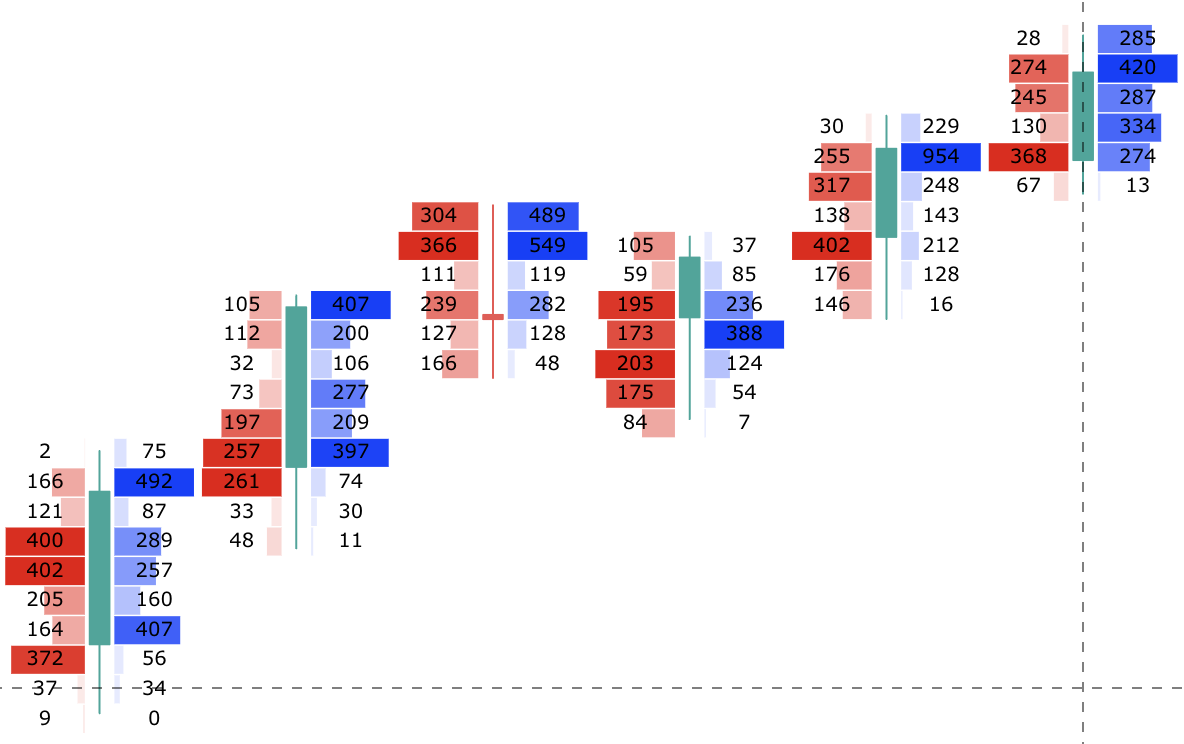
The most comprehensive profile suite
Session, Composite and Fixed Range profiles, each fully configurable — profile by volume, delta or bid × ask, with extendable POC, value-area, HVN and LVN lines.
- Session, composite & fixed range
- Anchor by session, day, week or custom
- Volume, delta or bid × ask
- POC, VAH/VAL, HVN & LVN lines
- Naked (virgin) POCs
- Developing POC & value-area trail
- Stepped volume profile
- Full merge & unmerge
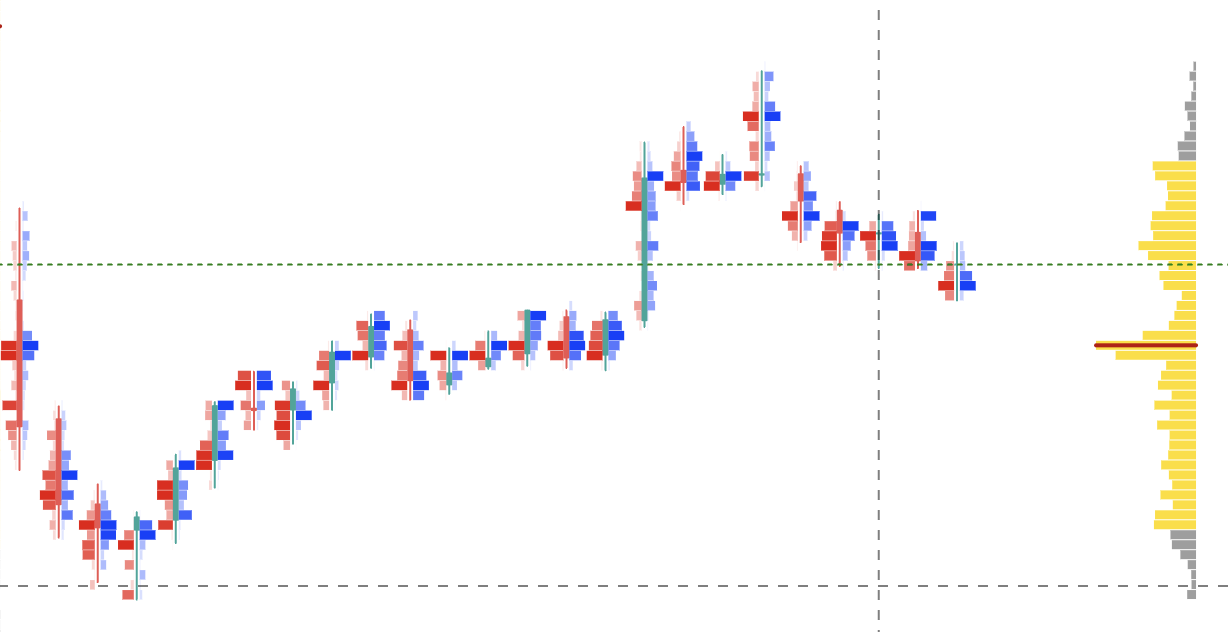
Time Price Opportunity, deeply configurable
A dedicated TPO mode with POC by volume or TPO count, every structural marker, and a range of colouring modes — anchored however your session demands.
- Anchor by session through year, or auto
- POC by volume or TPO count
- Value area, POC & VAH/VAL
- Poor highs/lows & single prints
- Initial balance & first/last block
- Duo, uni, gradient & spectrum colours
- Per-timeframe visibility controls
- Full merge & unmerge of periods
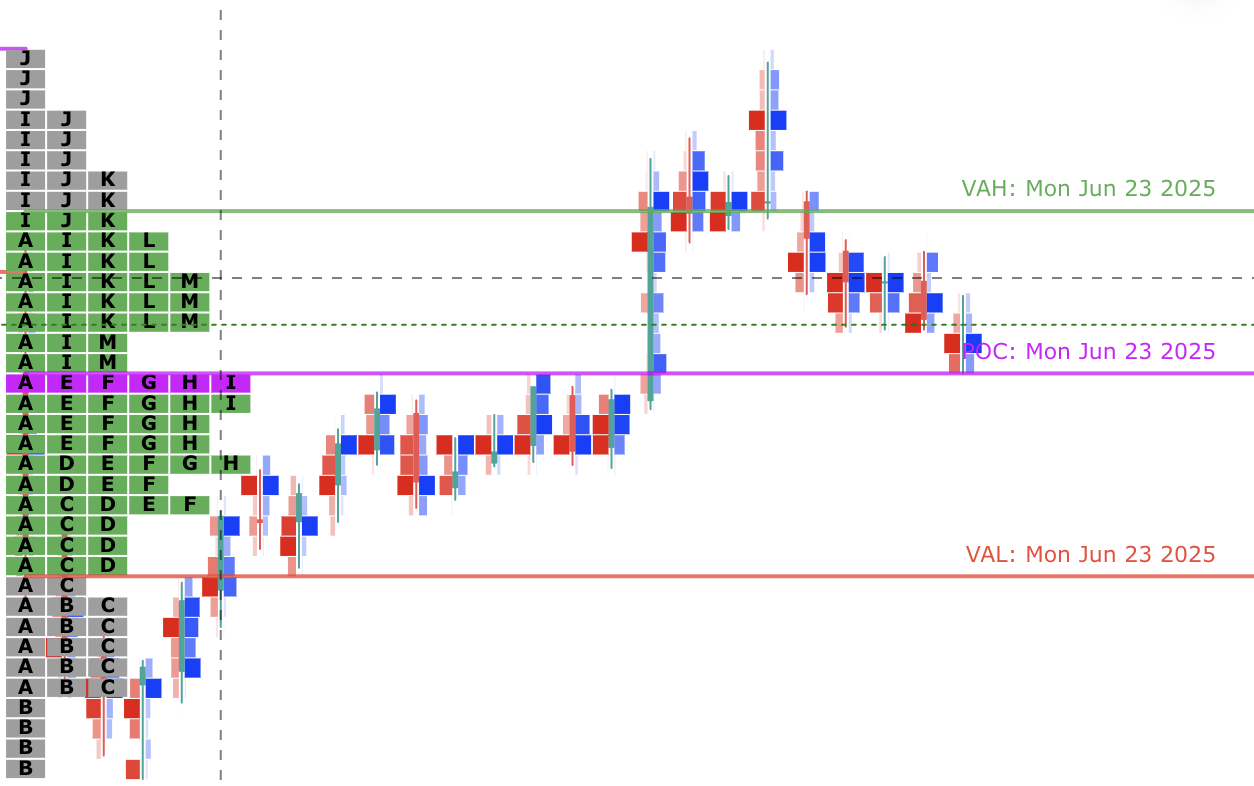
Every metric, per bar
A per-bar statistics indicator covering all available and derived data types — volume, delta, trade counts and the metrics derived from them.
- Volume & delta per bar
- Buy / sell trade counts
- Derived order flow metrics
- Configurable display
Surface the market-moving trades
Plot large, market-moving trades directly on the chart with customisable size thresholds, so the prints that matter never slip past.
- Large trades on the chart
- Customisable size thresholds
- Spot aggressive participation
VWAP, anchored VWAP and bands
VWAP and anchored VWAP with standard-deviation bands at custom multiples and full styling control.
- Standard & anchored VWAP
- Custom std-deviation bands
- Full styling control
Track net pressure within and across bars
Delta bars and cumulative delta bars expose net buying and selling pressure inside each candle and across the session.
- Delta bars
- Cumulative delta bars
- Within- and cross-candle pressure
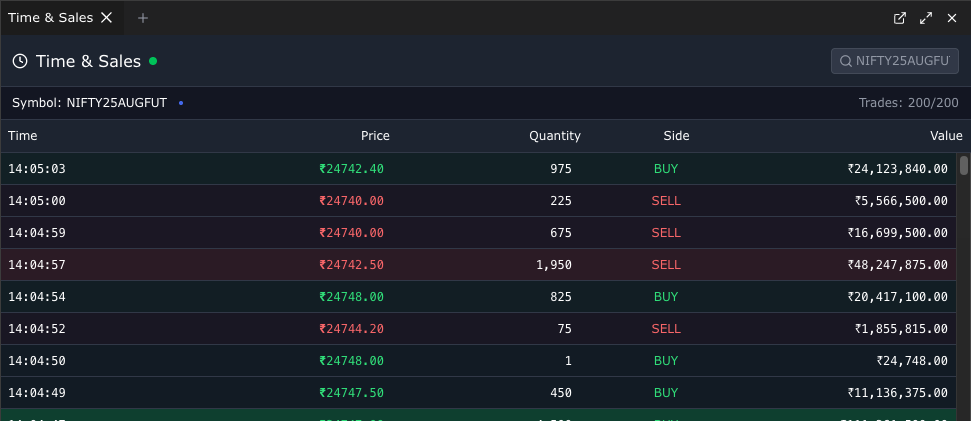
The full tape, trade by trade
A complete time & sales panel with the trade-by-trade feed and accompanying statistics, right inside your workspace.
- Full trade-by-trade feed
- Accompanying tape statistics
- Docked in your workspace
See it live in the terminal
Open FutPrint free and put every tool to work on today's session.