
 by TrueData
Find the activity.
Follow the evidence.
Move from breadth and sector leadership to individual order-flow events, then examine the underlying instrument.
Go from a question
to a closer look.
Explore how each tool fits your workflow, and the details that matter when using it.
Watchlist
Build a focused list, monitor price changes and send a selected symbol to a linked chart.
- Symbol search and list management
- Price and session sparkline context
- Workspace symbol linking
The free plan allows one watchlist. Quotes follow the data timing and coverage of the selected plan.
Read the guideHeatmap
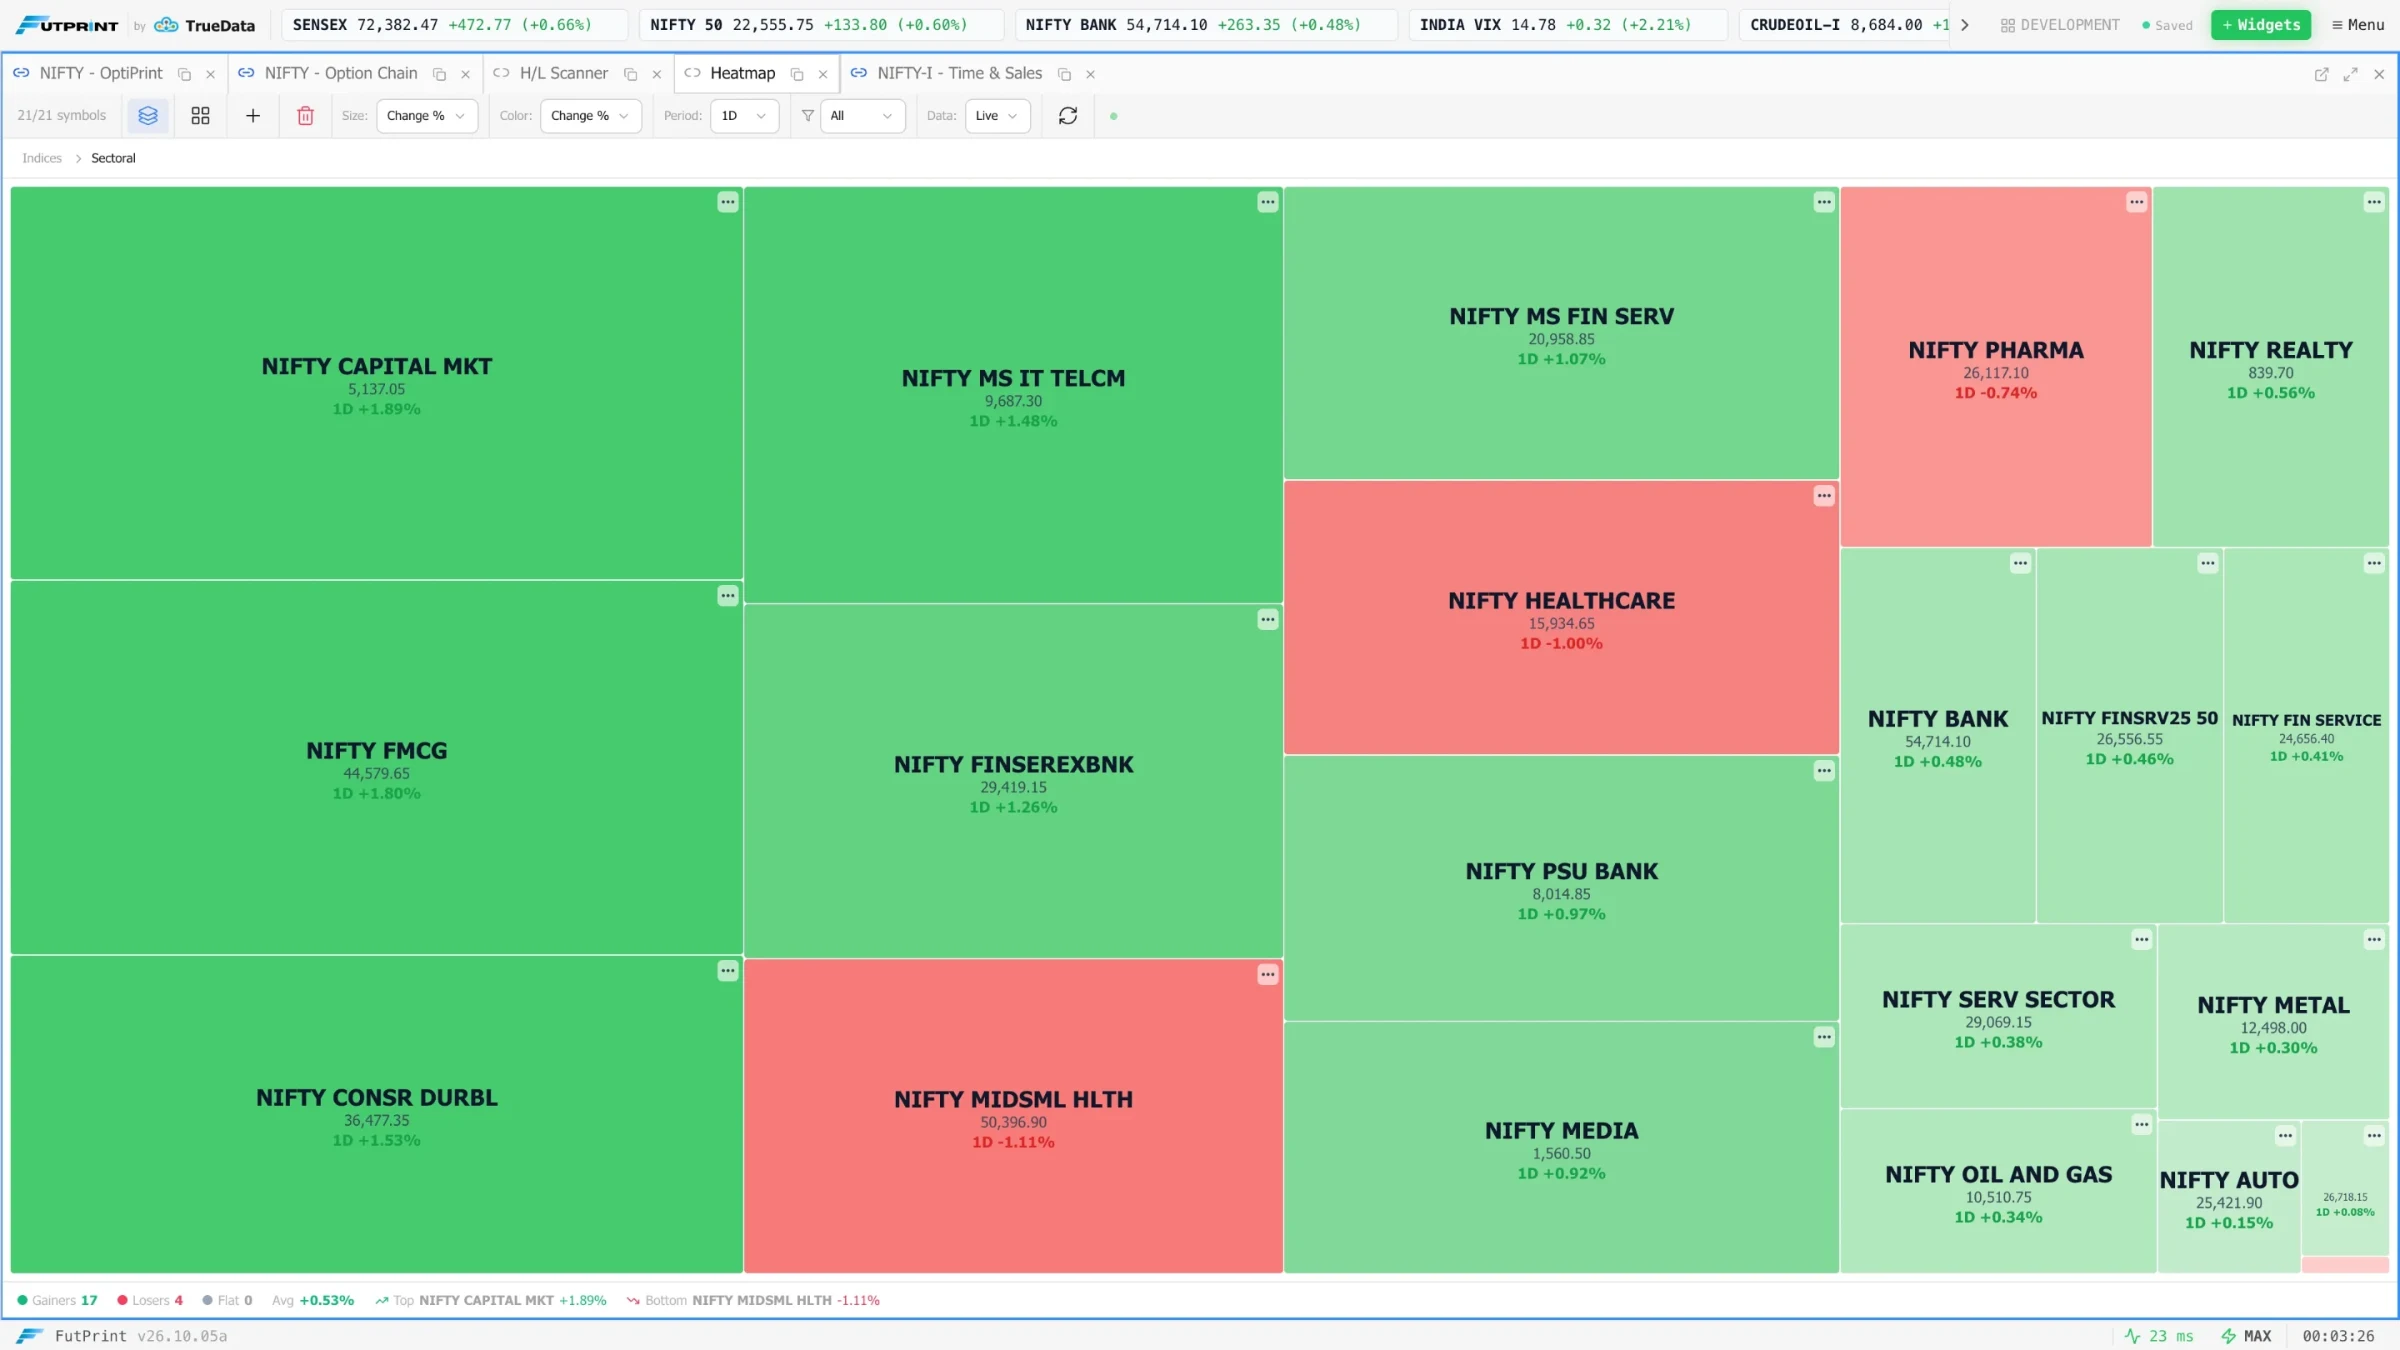
Scan the distribution of strength and weakness, then open a symbol that deserves closer attention.
- Colour-coded performance tiles
- Market-group overview
- Open instruments in the workspace
Colour represents the selected performance measure, not a buy or sell recommendation.
Read the guidePower Scanner
Choose an event preset, filter direction and severity, then inspect the numbers behind an event in its chart context.
- Large prints, sweeps and delta surges
- Absorption, relative-volume and OI events
- Severity, directional filters and in-app alerts
The current scanner universe is Nifty 50 futures. Events are rule-based observations with tunable thresholds, not guaranteed trade signals.
Tick Analyser
Select an instrument, inspect the tape and switch into volume or TPO views to put individual prints into context.
- Tick commentary, direction and strength filters
- Tape, volume profile and TPO views
- Delta, CVD, spread and large-print statistics
Commentary is derived from market rules and observed feed data; it is not evidence of an AI adviser or knowledge of trader identity.
H/L Scanner
Choose a market, segment or sector and follow fresh high/low activity as a starting point for deeper analysis.
- High and low markers
- Market, segment and sector filters
- Pause, clear and manage event rows
Supported filter labels do not guarantee feed entitlement to every exchange or segment.
Market Pulse
Start with a broad market read, select a freshness window and drill down to the symbols driving the view.
- Nifty 50 futures bias and breadth
- Sector leadership and event confluence
- Freshness windows and Power Scanner handoff
The view summarises the observed universe and window; it is not an all-market forecast.
Make the market
your workspace.
Data timing, coverage and tools vary by plan.