
 by TrueData
Footprint charts
for Indian markets.
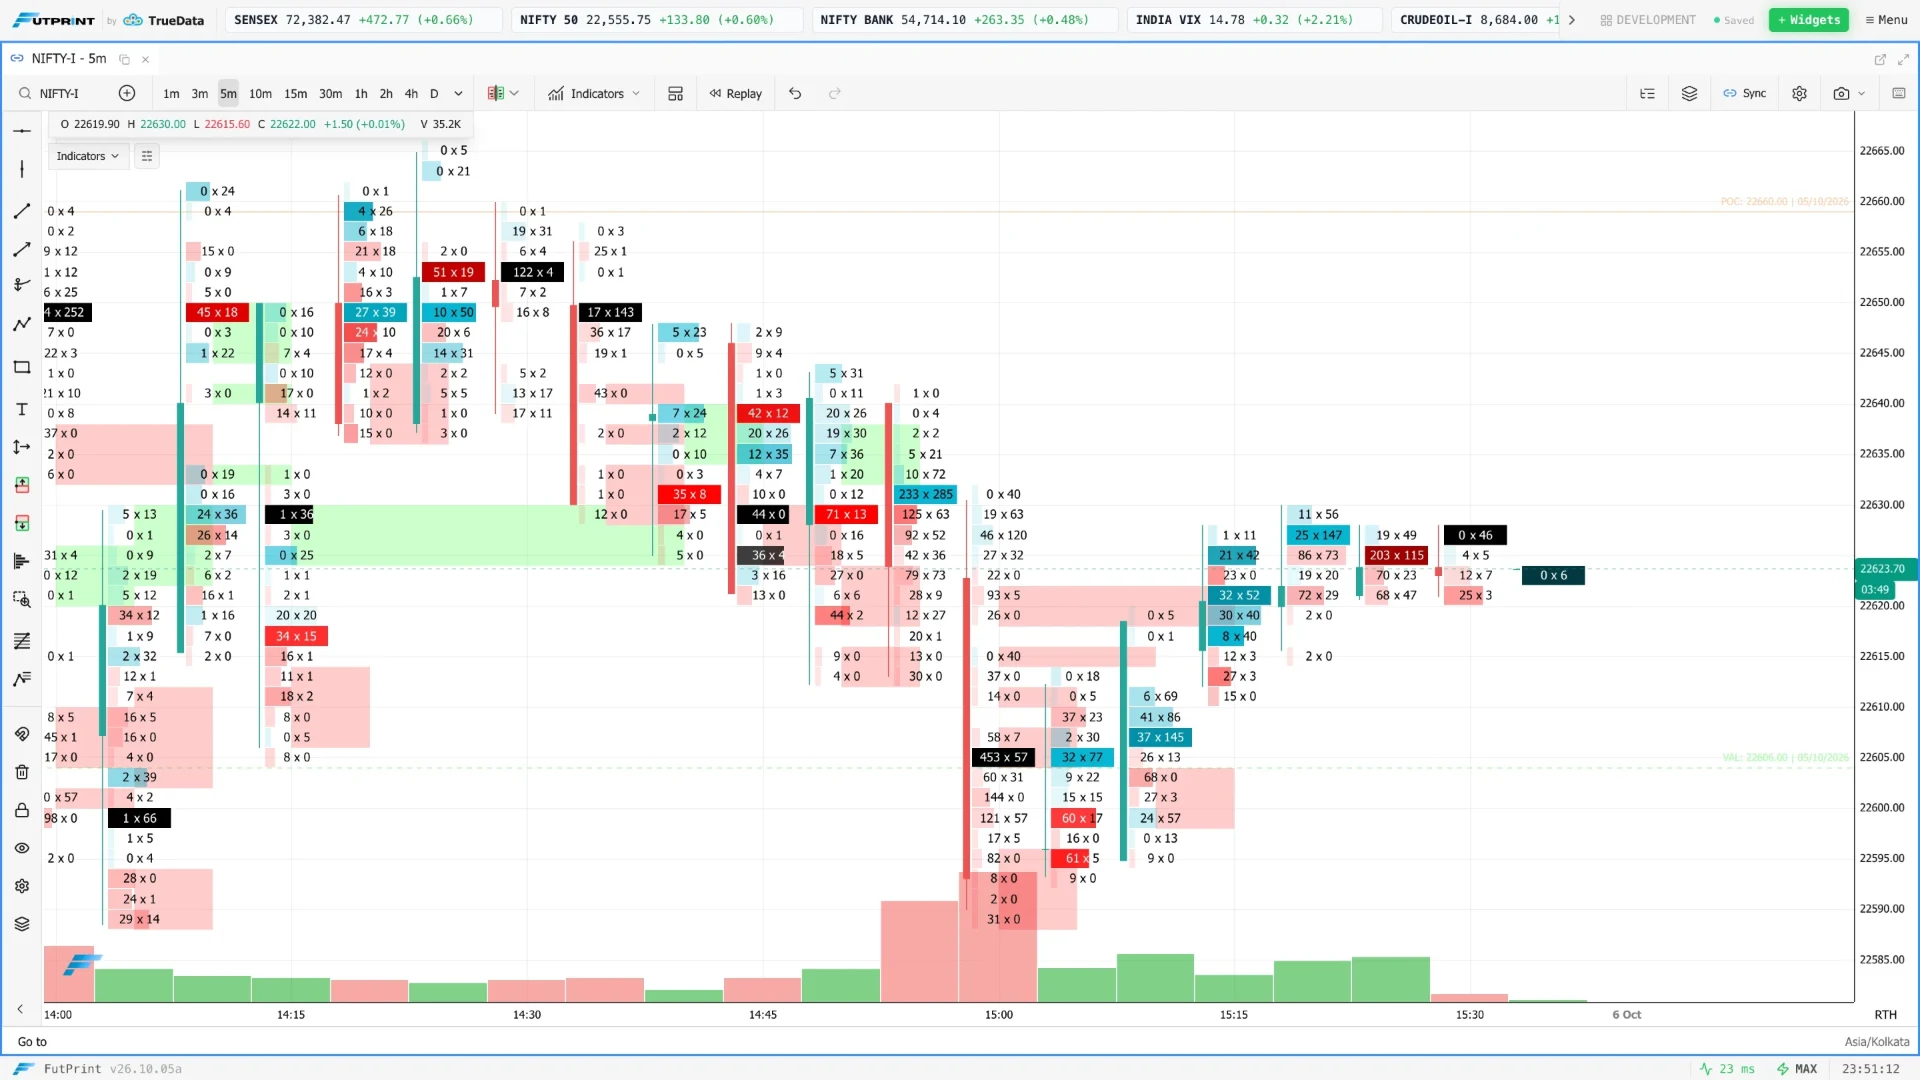
A footprint chart shows the traded volume at every price inside a candle, split by bid and ask. FutPrint by TrueData builds footprints from tick-level NSE, BSE and MCX data, so you can see where buyers and sellers were aggressive, where imbalances formed and where large trades printed.
Participation,
price by price.
Each cell answers one question: how much traded at this price, and on which side.
- Bid × ask cells. Volume that traded at the bid beside volume that traded at the ask, at every price level in the bar. Switch to delta, total volume, buy or sell trades, or bid-ask-delta columns.
- Imbalances and stacked imbalances. Levels where one side traded a multiple of the other, and runs of them, highlighted with a threshold you set.
- Big Trades. Executions above a lot size you choose, marked on the chart with buy and sell markers.
- vPOC, POC and value area. The price with the most volume in each bar and in the session, with the value area drawn from it.
- Delta divergence and initiative signals. Bars where price and delta disagree, flagged for review.
- Presets. Single-sided bid-ask profile, double-sided blocks or profiles, delta versus total volume, and triple-sided clusters, with bin sizes from automatic to 200 ticks.
Built on Indian tick data
FutPrint classifies each trade from TrueData's tick feed, aggregates it to the timeframe you choose and keeps the cumulative delta, bar statistics and time and sales on the same data. A footprint for NIFTY, BANKNIFTY, SENSEX, a stock future or an MCX contract uses the same pipeline.
Which plan you need
Footprint charts need a paid plan. Lite builds footprints from end-of-day data, which is enough to study past sessions and replay them. Pro and Max add real-time data and real-time footprints for live trading. The pricing page lists exchange coverage and widget limits for each plan.
A footprint chart breaks each candle into its price levels and shows the volume or number of trades that happened at each level, split into the bid side and the ask side. It adds participation to a price chart: where buyers were aggressive, where sellers were, and where the two were out of balance.
Any NSE, BSE or MCX instrument in your plan's coverage: index and stock futures, options and MCX commodities. Exchange coverage differs by plan; the pricing page lists it.
No. The Lite plan builds footprints from end-of-day data, which is enough for study and replay. Pro and Max add real-time footprints for live sessions.
From tick-level trade data in TrueData's feed, classified by the terminal's aggressor rules. Classification depends on data quality and settings; it describes executed trades, not the intentions of individual participants.
Yes. The documentation shows every footprint setting with a screenshot, and a seven-day Max trial is available without a credit card.
Make the market
your workspace.
Data timing, coverage and tools vary by plan.