Spread Scanner
Spread Scanner prices every butterfly, iron fly or ratio spread that can be built around the money of a live expiry and lays them out as a grid of centre strike against wing width, coloured cheap to rich, so the mispriced structure stands out before you build it.
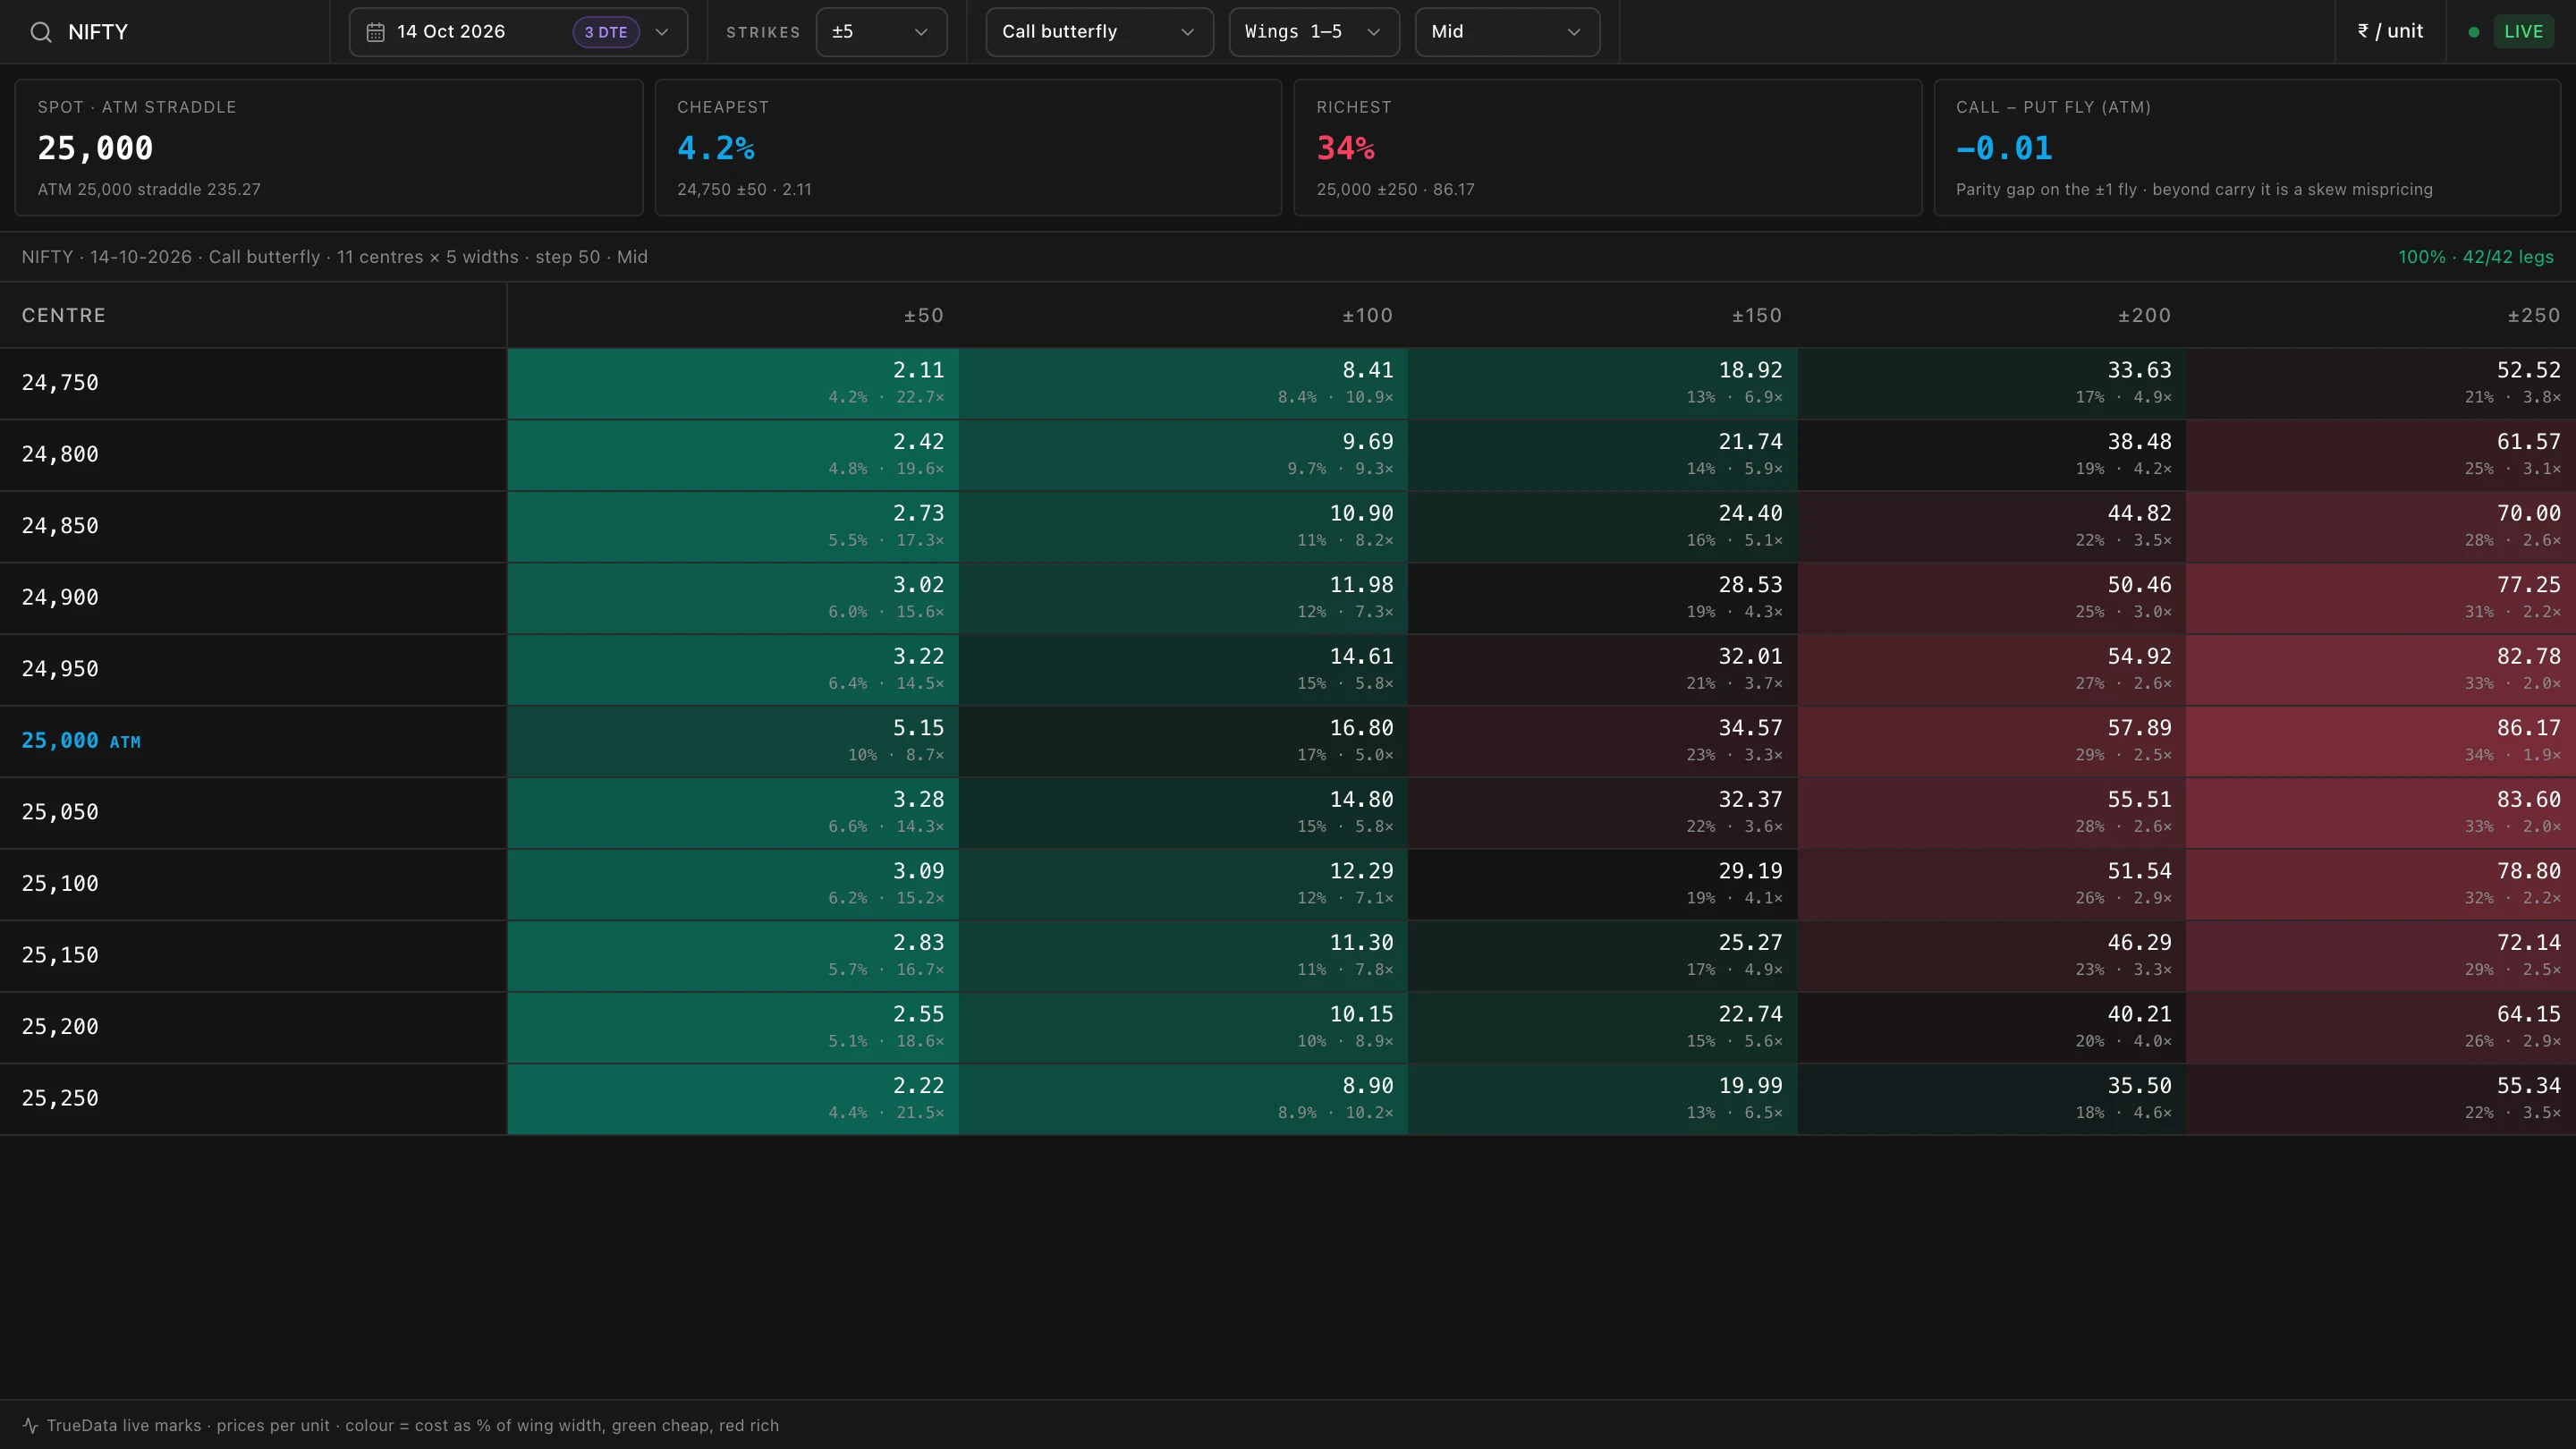
Loading a grid
- 1Choose an underlying and expiry
Search for an index or futures underlying. The nearest upcoming expiry is selected initially; the wings are subscribed along with the centres so the grid fills as soon as both sides have prices.
- 2Choose the centres
±3 to ±15 centre strikes around the money. Each row of the grid is one centre.
- 3Choose the structure
Call butterfly, Put butterfly, Iron butterfly (sell the straddle, buy the strangle), Call ratio or Put ratio (buy one, sell 1:2 to 1:5 further out). Wings 1–N sets the widest wing in strike steps; each column of the grid is one width.
- 4Choose the price basis
Mid (bid-ask midpoint, LTP when the book is one-sided), LTP, or Executable (pay the ask on buys, hit the bid on sells, which is what the spread really costs to put on).
Reading the grid
Each cell is one spread. The top line is its net price (cr marks a credit), the bottom its cost as a share of the wing width and its reward to risk; ratio spreads show the maximum profit instead. Colour runs green (cheap for its width) to red (rich). The ATM centre is marked. Hover a cell for its detail, click to pin it; Esc releases it.
The detail strip lists the legs with side, quantity, price, bid/ask and OI, plus the net price, maximum profit and loss, break-evens, reward to risk, the slippage between mid and executable, and the smallest OI among the legs.
₹ / unit or ₹ / lot toggles every money figure between one unit and one lot of the contract.
The cards
- Spot · ATM straddle shows the reference price and the straddle at the money.
- Cheapest and Richest (largest credit and debit for ratio spreads) name the extreme structures in the grid.
- Call − put fly (ATM) is the price gap between the call and put butterflies at the money. Beyond carry, a gap is a skew mispricing between the two sides.
The status badge reads LIVE once at least 60% of the scoped legs have a usable mark. When the market is shut or the feed is thin, the panel loads the previous session's closes and shows PREVIOUS SESSION.
What's saved
The underlying, expiry, centres, widest wing, structure, ratio, price basis and the per-unit / per-lot choice are stored with your workspace.