H/L Scanner
H/L Scanner lists instruments as they print a new session high or session low. You choose which markets, segments, sectors or indices to watch, and the scanner streams a marker each time one of their symbols breaks its day's range.
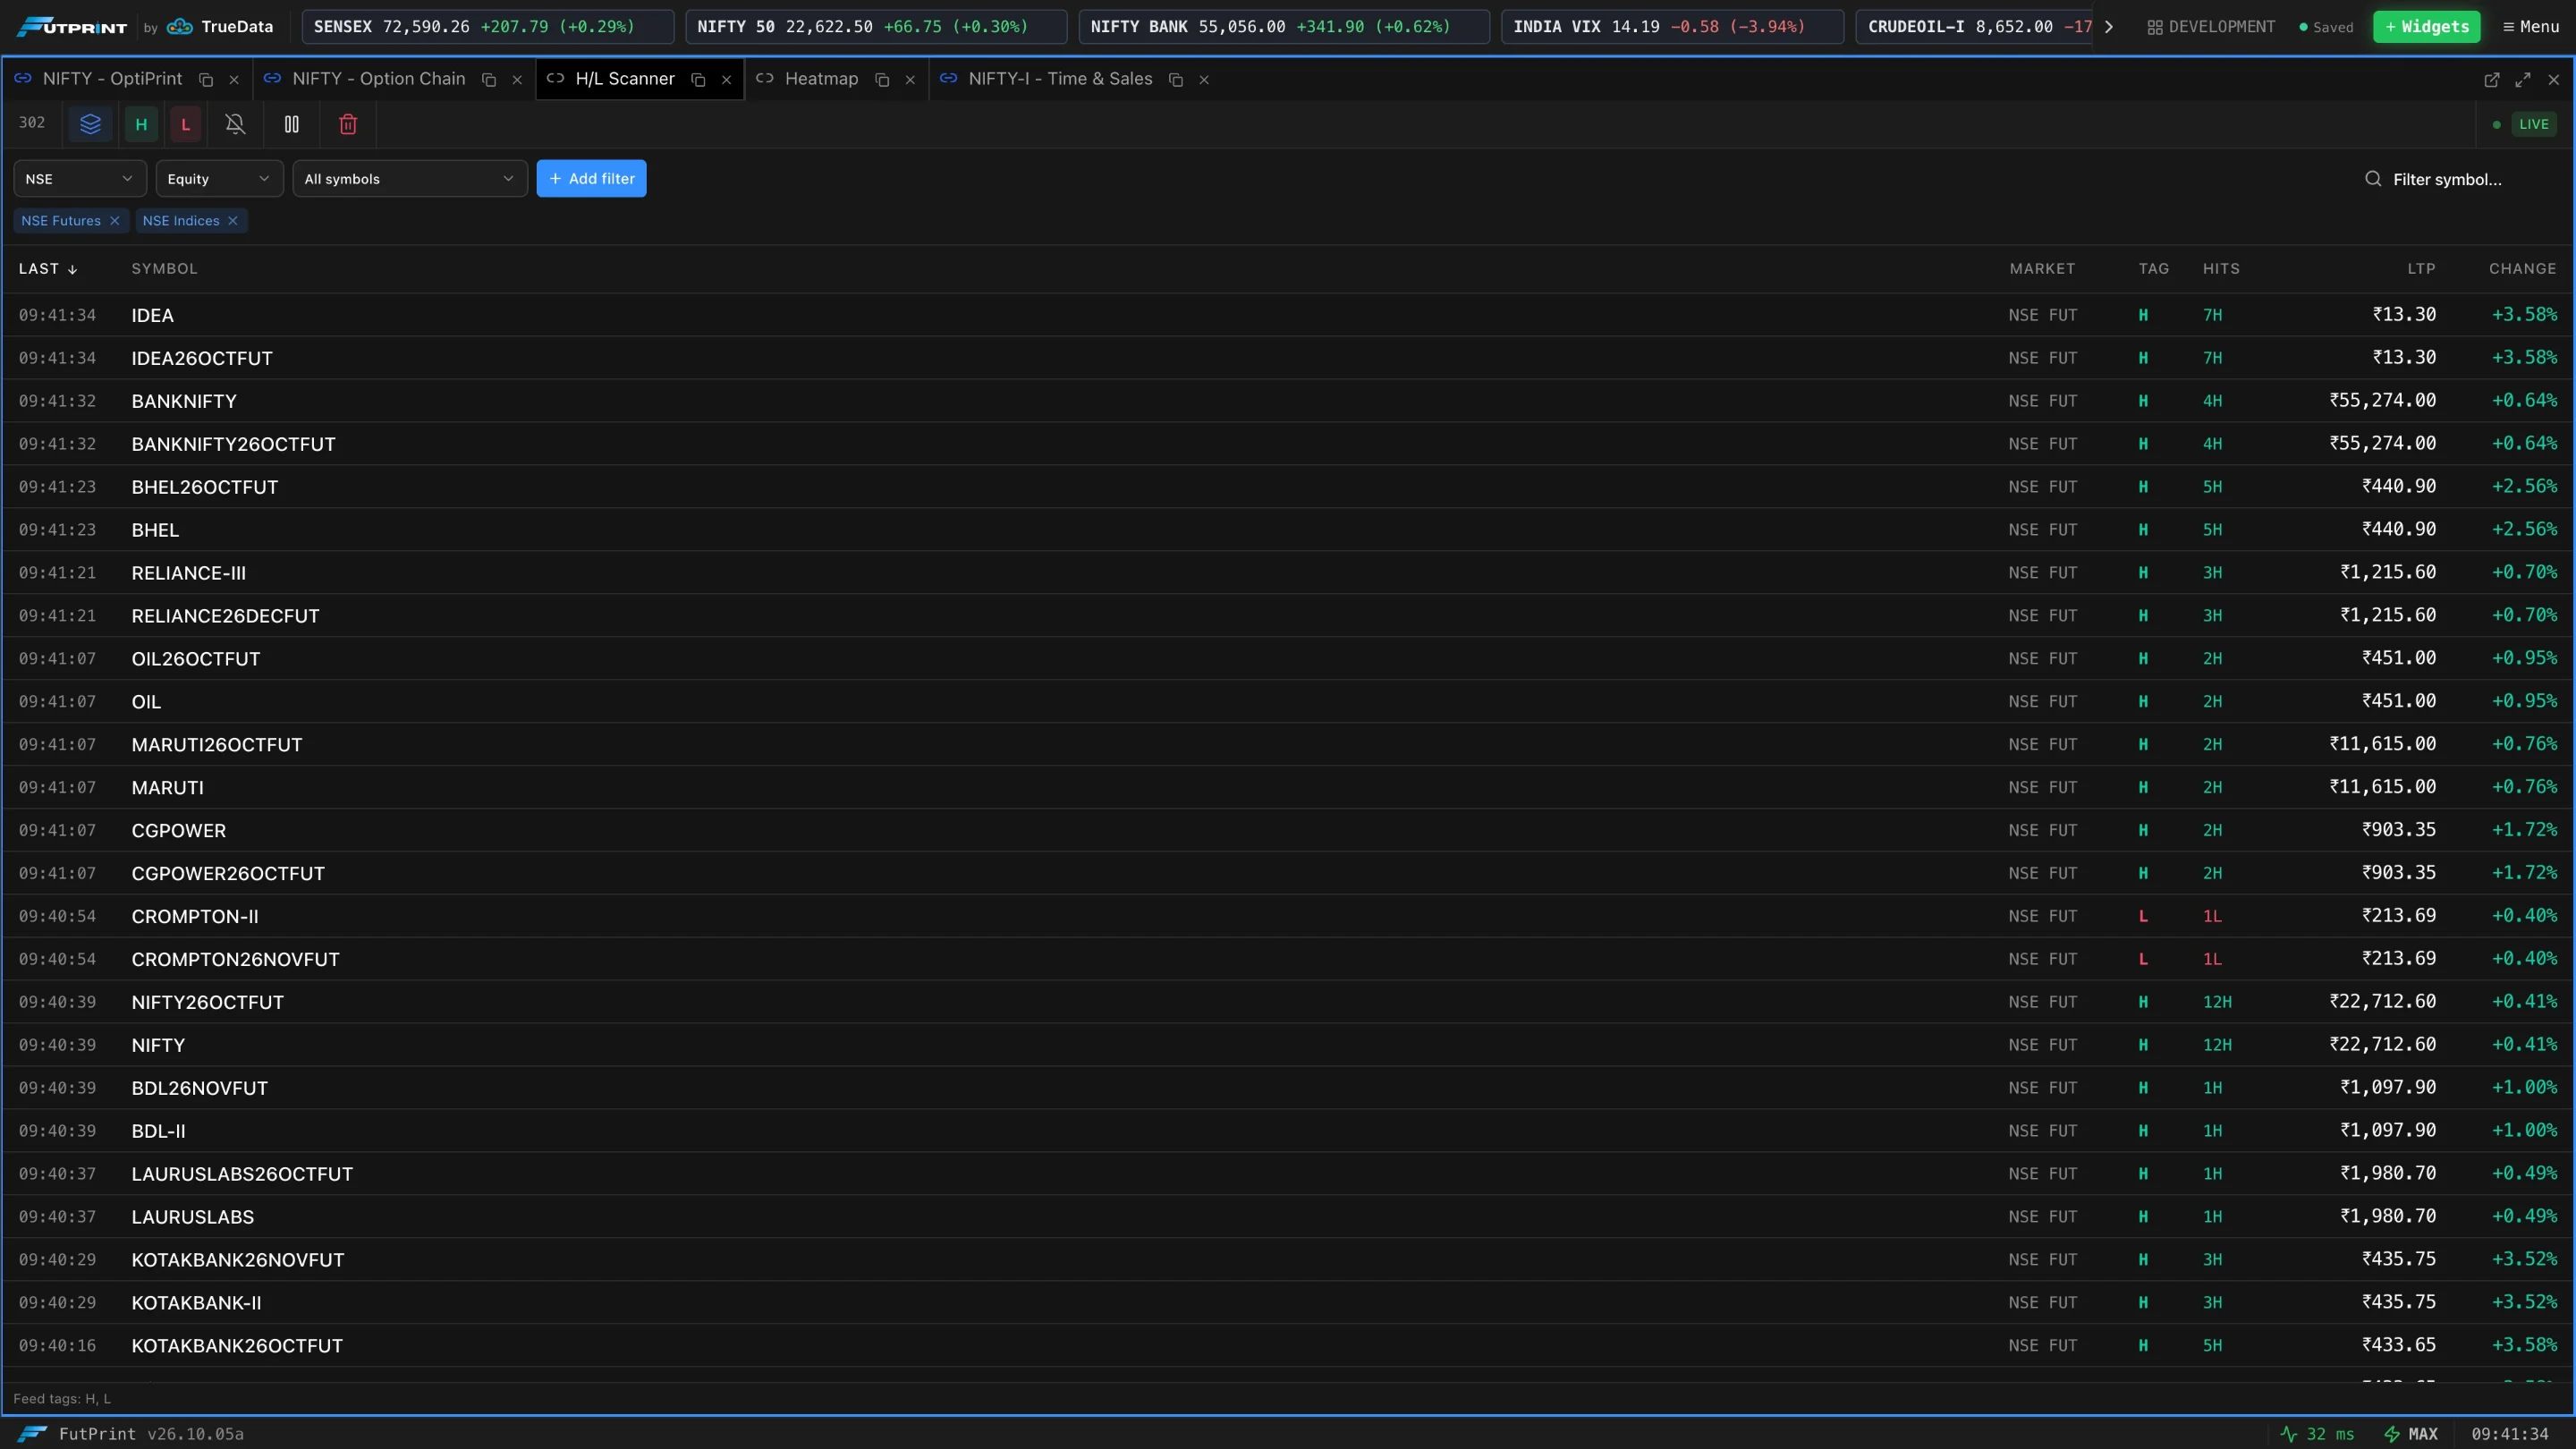
The scanner needs live market data and at least one filter. With no filter it reads Add a market or index filter to stream session high and low markers.
Choosing what to scan
The second toolbar row builds filters:
- 1Pick a market
NSE, BSE, MCX or NSE F&O.
- 2Pick a segment
Equity, Futures, Options or Indices. With NSE F&O only Futures and Options are available.
- 3Optionally pick a sector or index
Leave it on All symbols to scan the whole segment, or choose a sector or index to scan only its members. While one is chosen, Market and Segment are locked.
- 4Click Add filter
The filter appears as a chip under the toolbar. Add as many as you need; click the ✕ on a chip to remove it.
Filter symbol… at the right narrows the rows to one symbol without changing the filters.
The columns
| Column | Meaning |
|---|---|
| Last / Time | Time of the most recent marker (grouped view) or of this marker (tape view). |
| Symbol | The instrument. |
| Market | Exchange and segment, for example NSE FUT. |
| Tag | H for a new session high, L for a new session low. |
| Hits | (grouped view) How many highs and lows the symbol has made while the scanner has been running, for example 3H or 2L. |
| LTP | Last traded price. |
| Change | Change on the day, in percent. |
Click a sortable header (time, symbol, hits, LTP, change) to sort by it.
Grouped view and raw tape
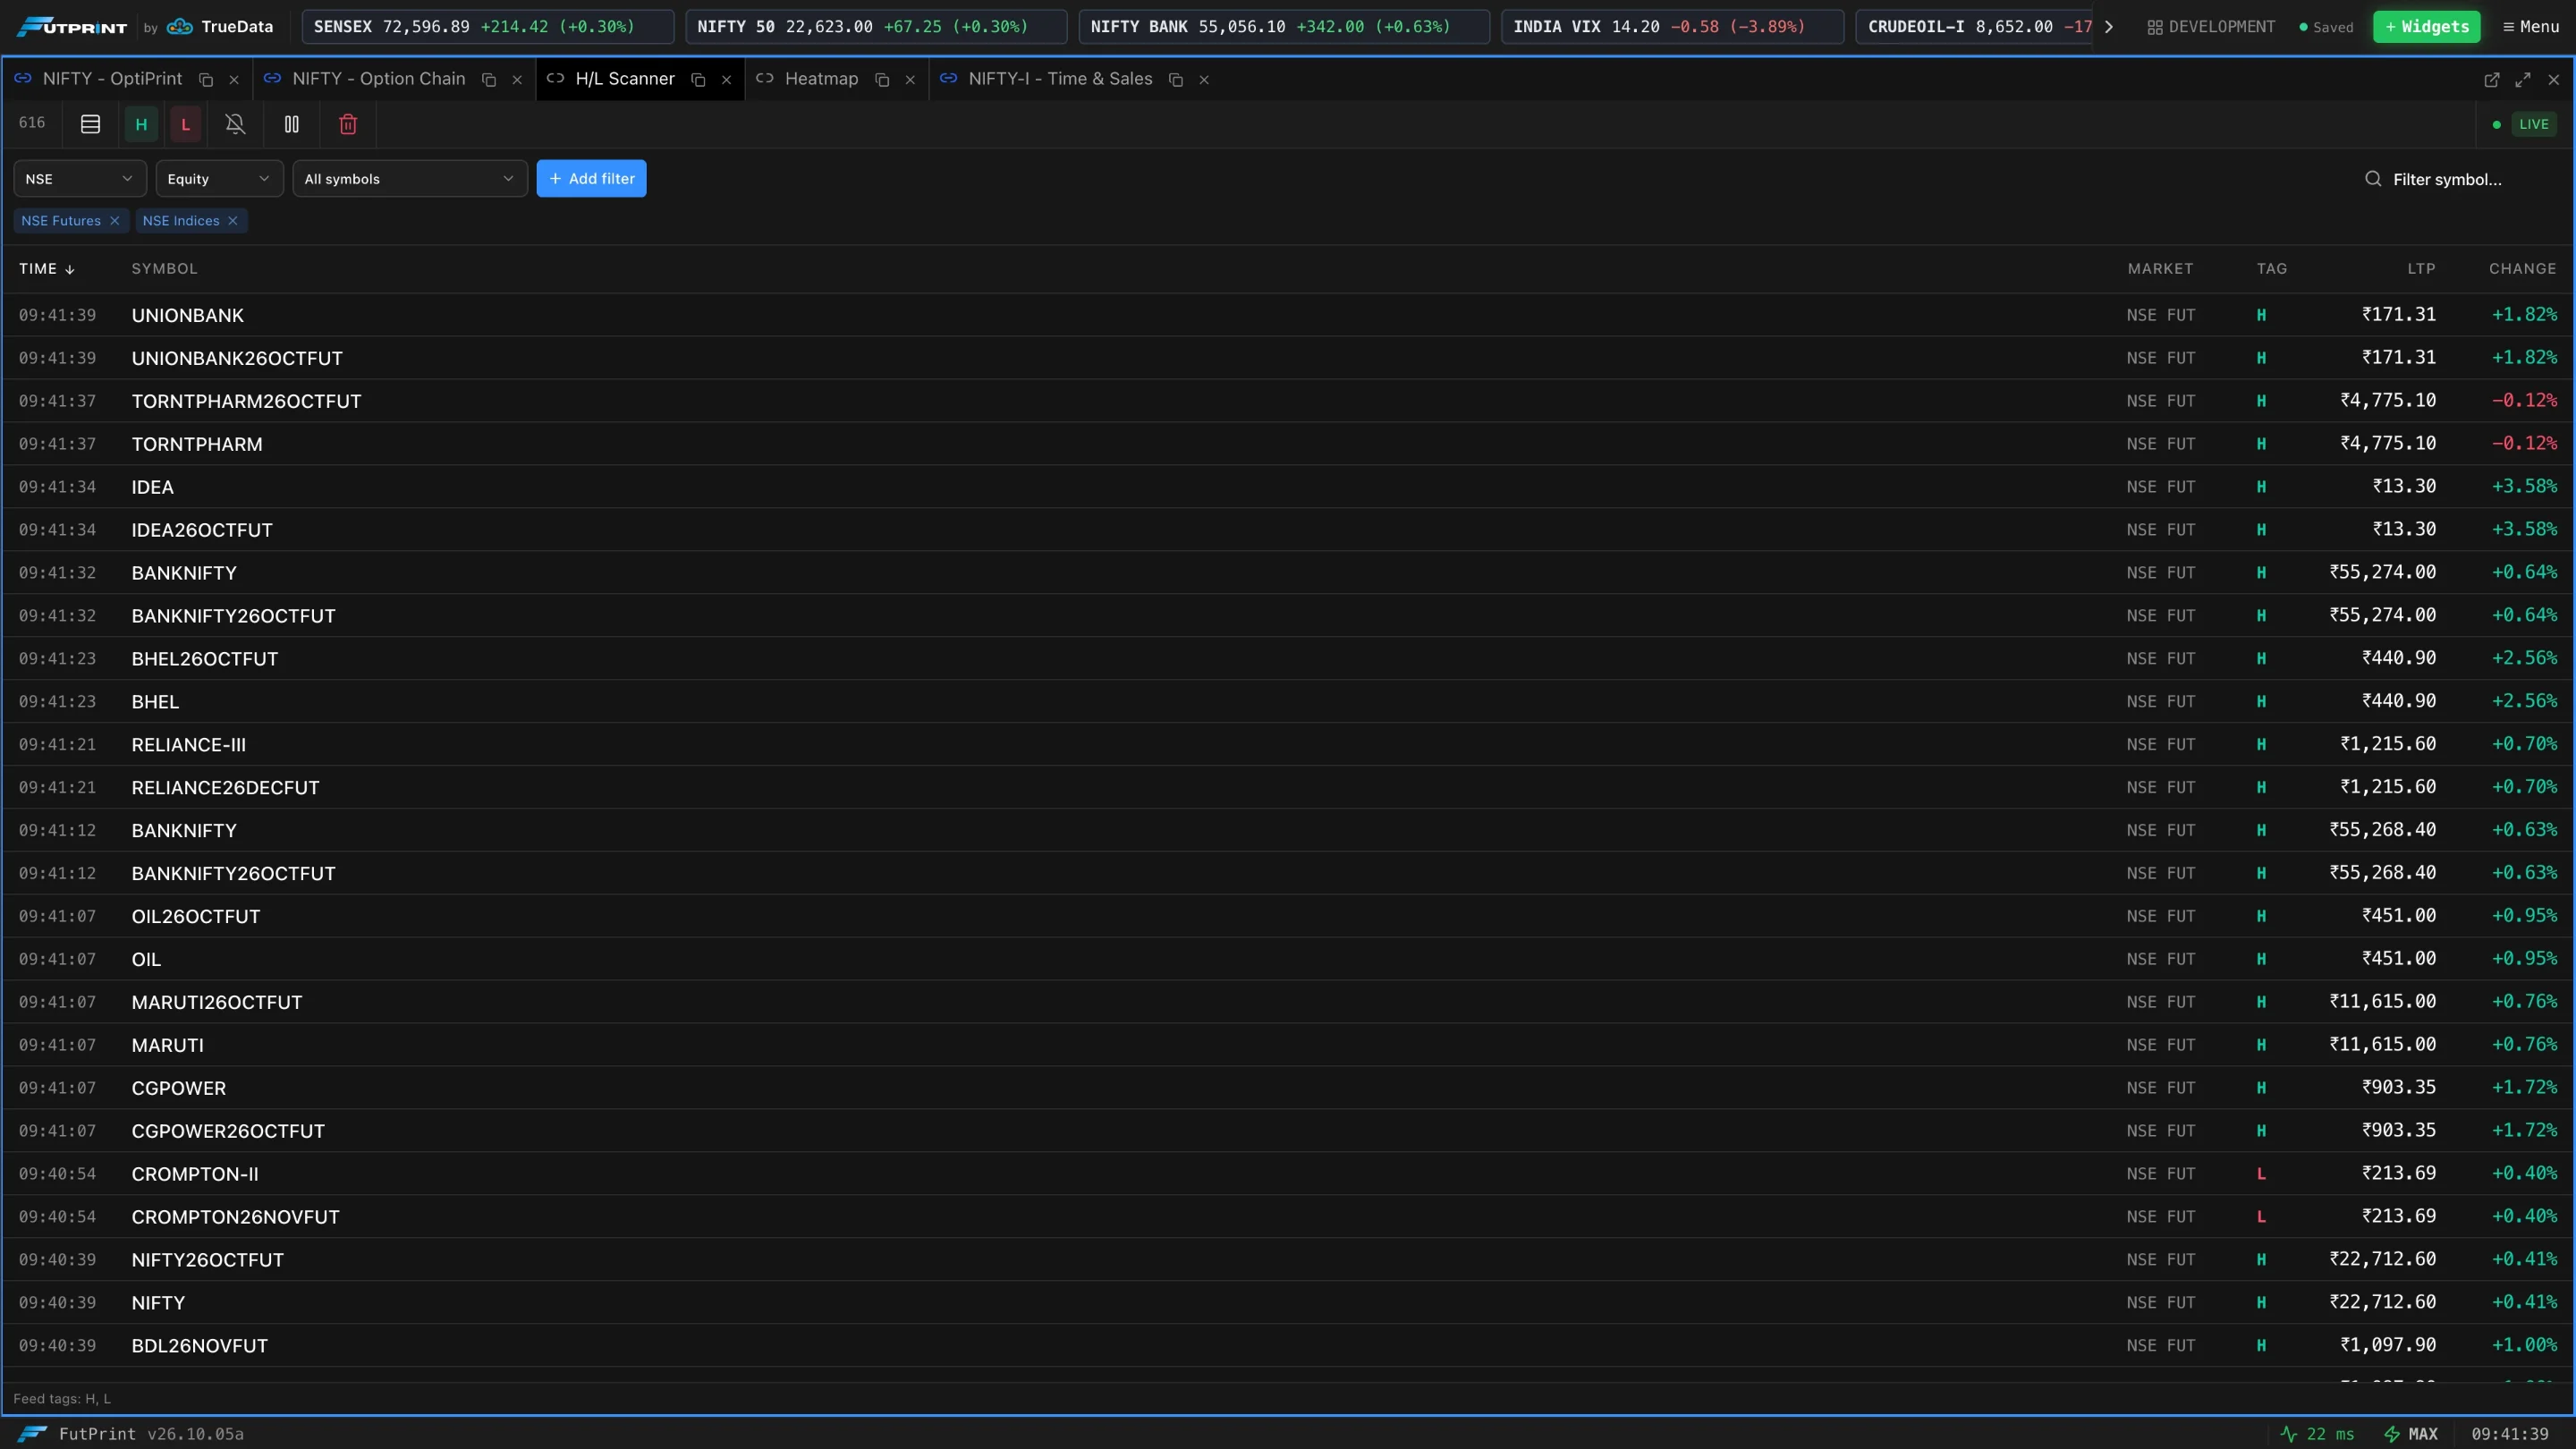
Use the grouped view to see which symbols keep breaking out. Use the tape to see the order in which breaks happened.
The toolbar
| Control | What it does |
|---|---|
| Count | Symbols shown (grouped) or markers shown (tape). |
| Group by symbol | Switch between the grouped view and the raw tape. |
| H / L | Show or hide high markers and low markers. |
| Alerts (bell) | Play a sound and send a background notification on each new high or low. |
| Pause | Freeze the list. PAUSED shows in the toolbar while it is frozen. |
| Clear rows | Empty the list. Filters stay. |
Acting on a row
- Click a row to load its symbol in the panels linked to the scanner.
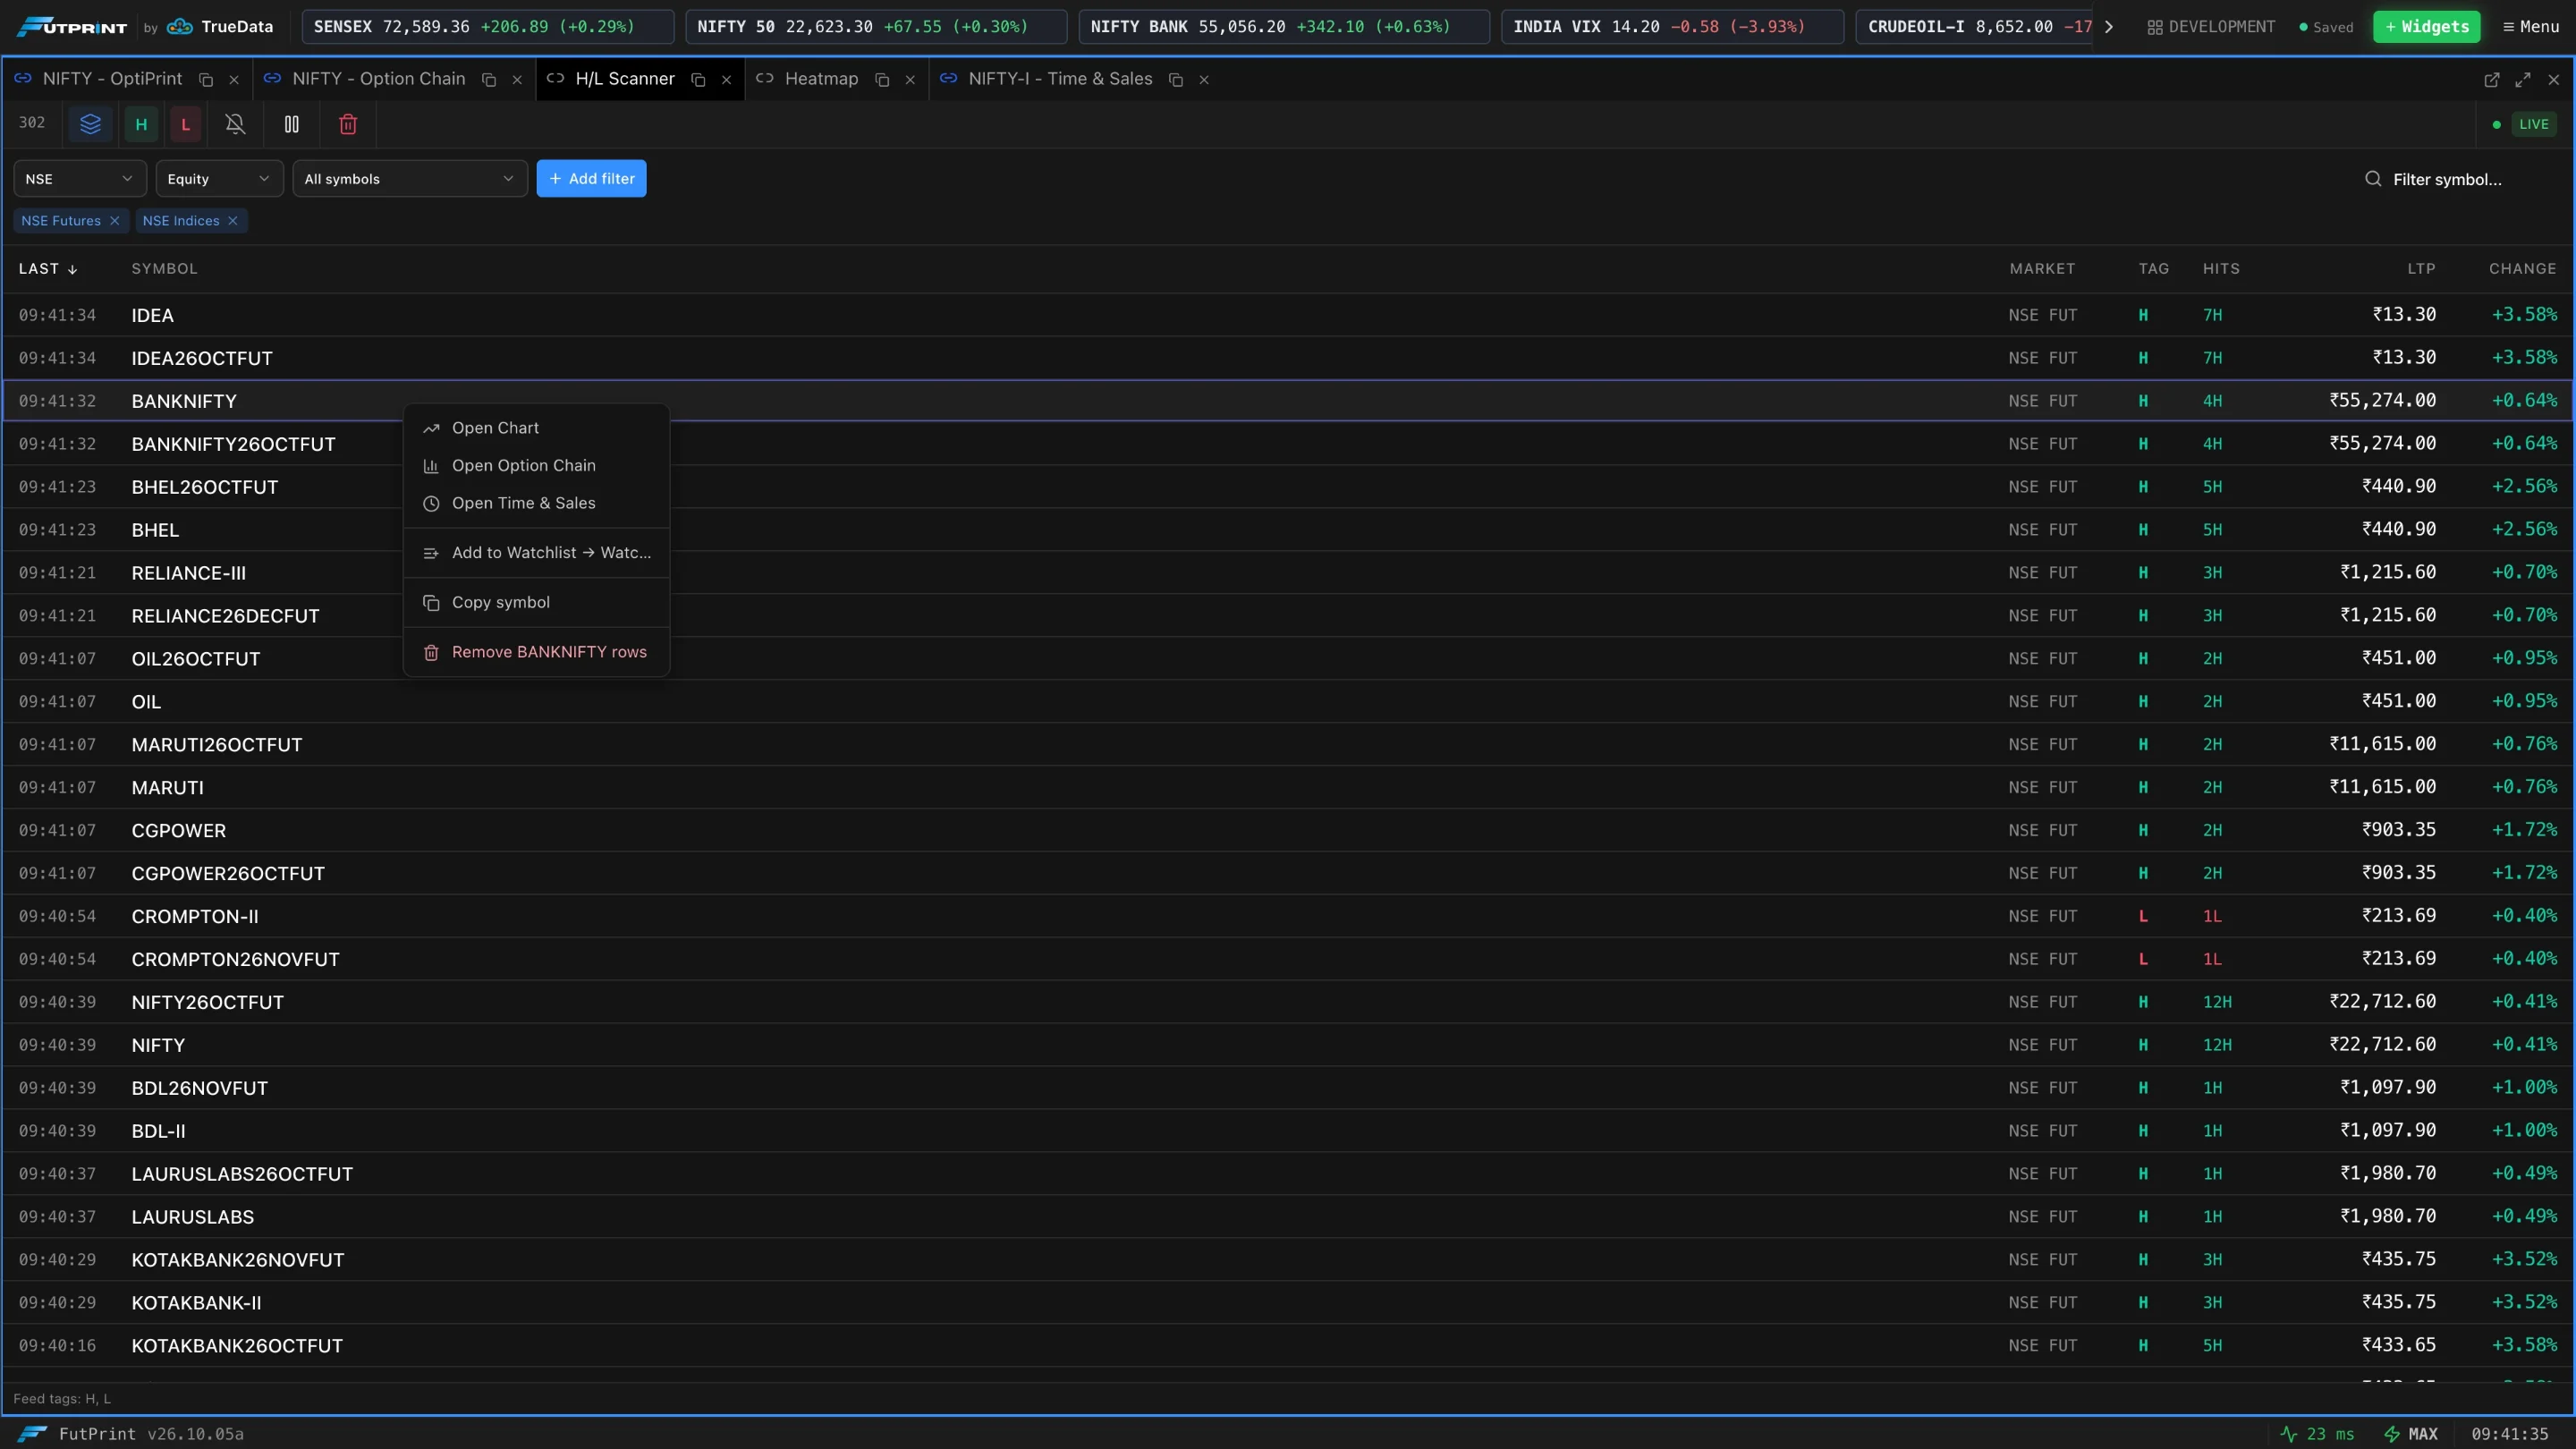
- Right-click a row for Open Chart, Open Option Chain, Open Time & Sales, Add to an open Watchlist, Add to new Watchlist, Copy symbol and Remove that symbol's rows.
Add a sector or index filter rather than a whole segment when you only trade a handful of names: the list stays short enough to read.