Chart — Types & Modes
The Chart Mode selector in the toolbar switches how price is drawn. Each mode tells a different story about the same data; switching is instant and keeps your symbol, timeframe, indicators and drawings.
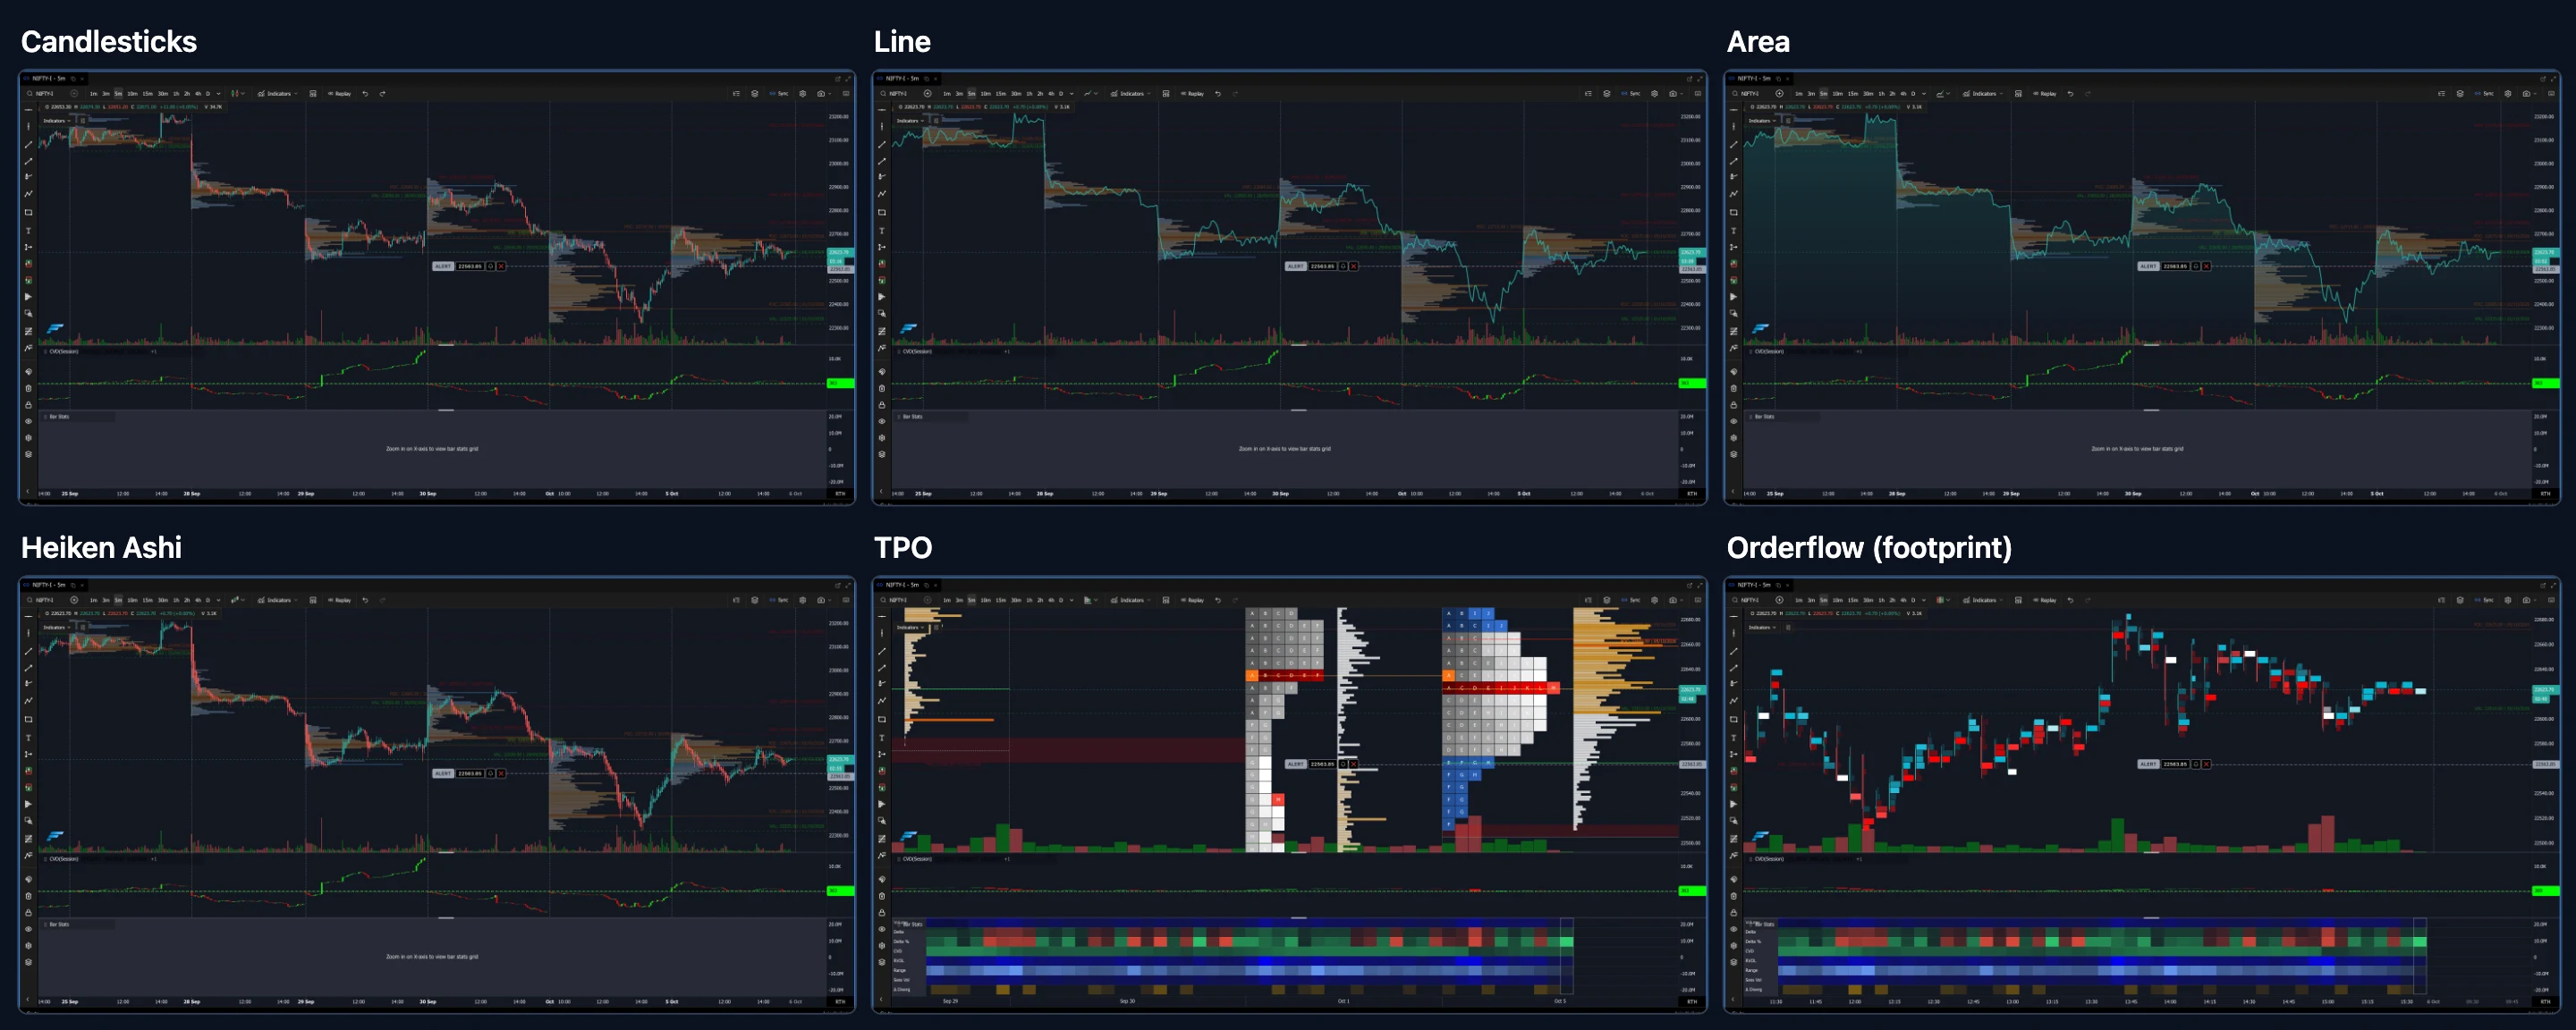
Switching mode
Click the chart-mode button in the chart toolbar (next to the timeframes) and pick a mode. The chart redraws immediately and keeps your symbol, drawings and indicators.
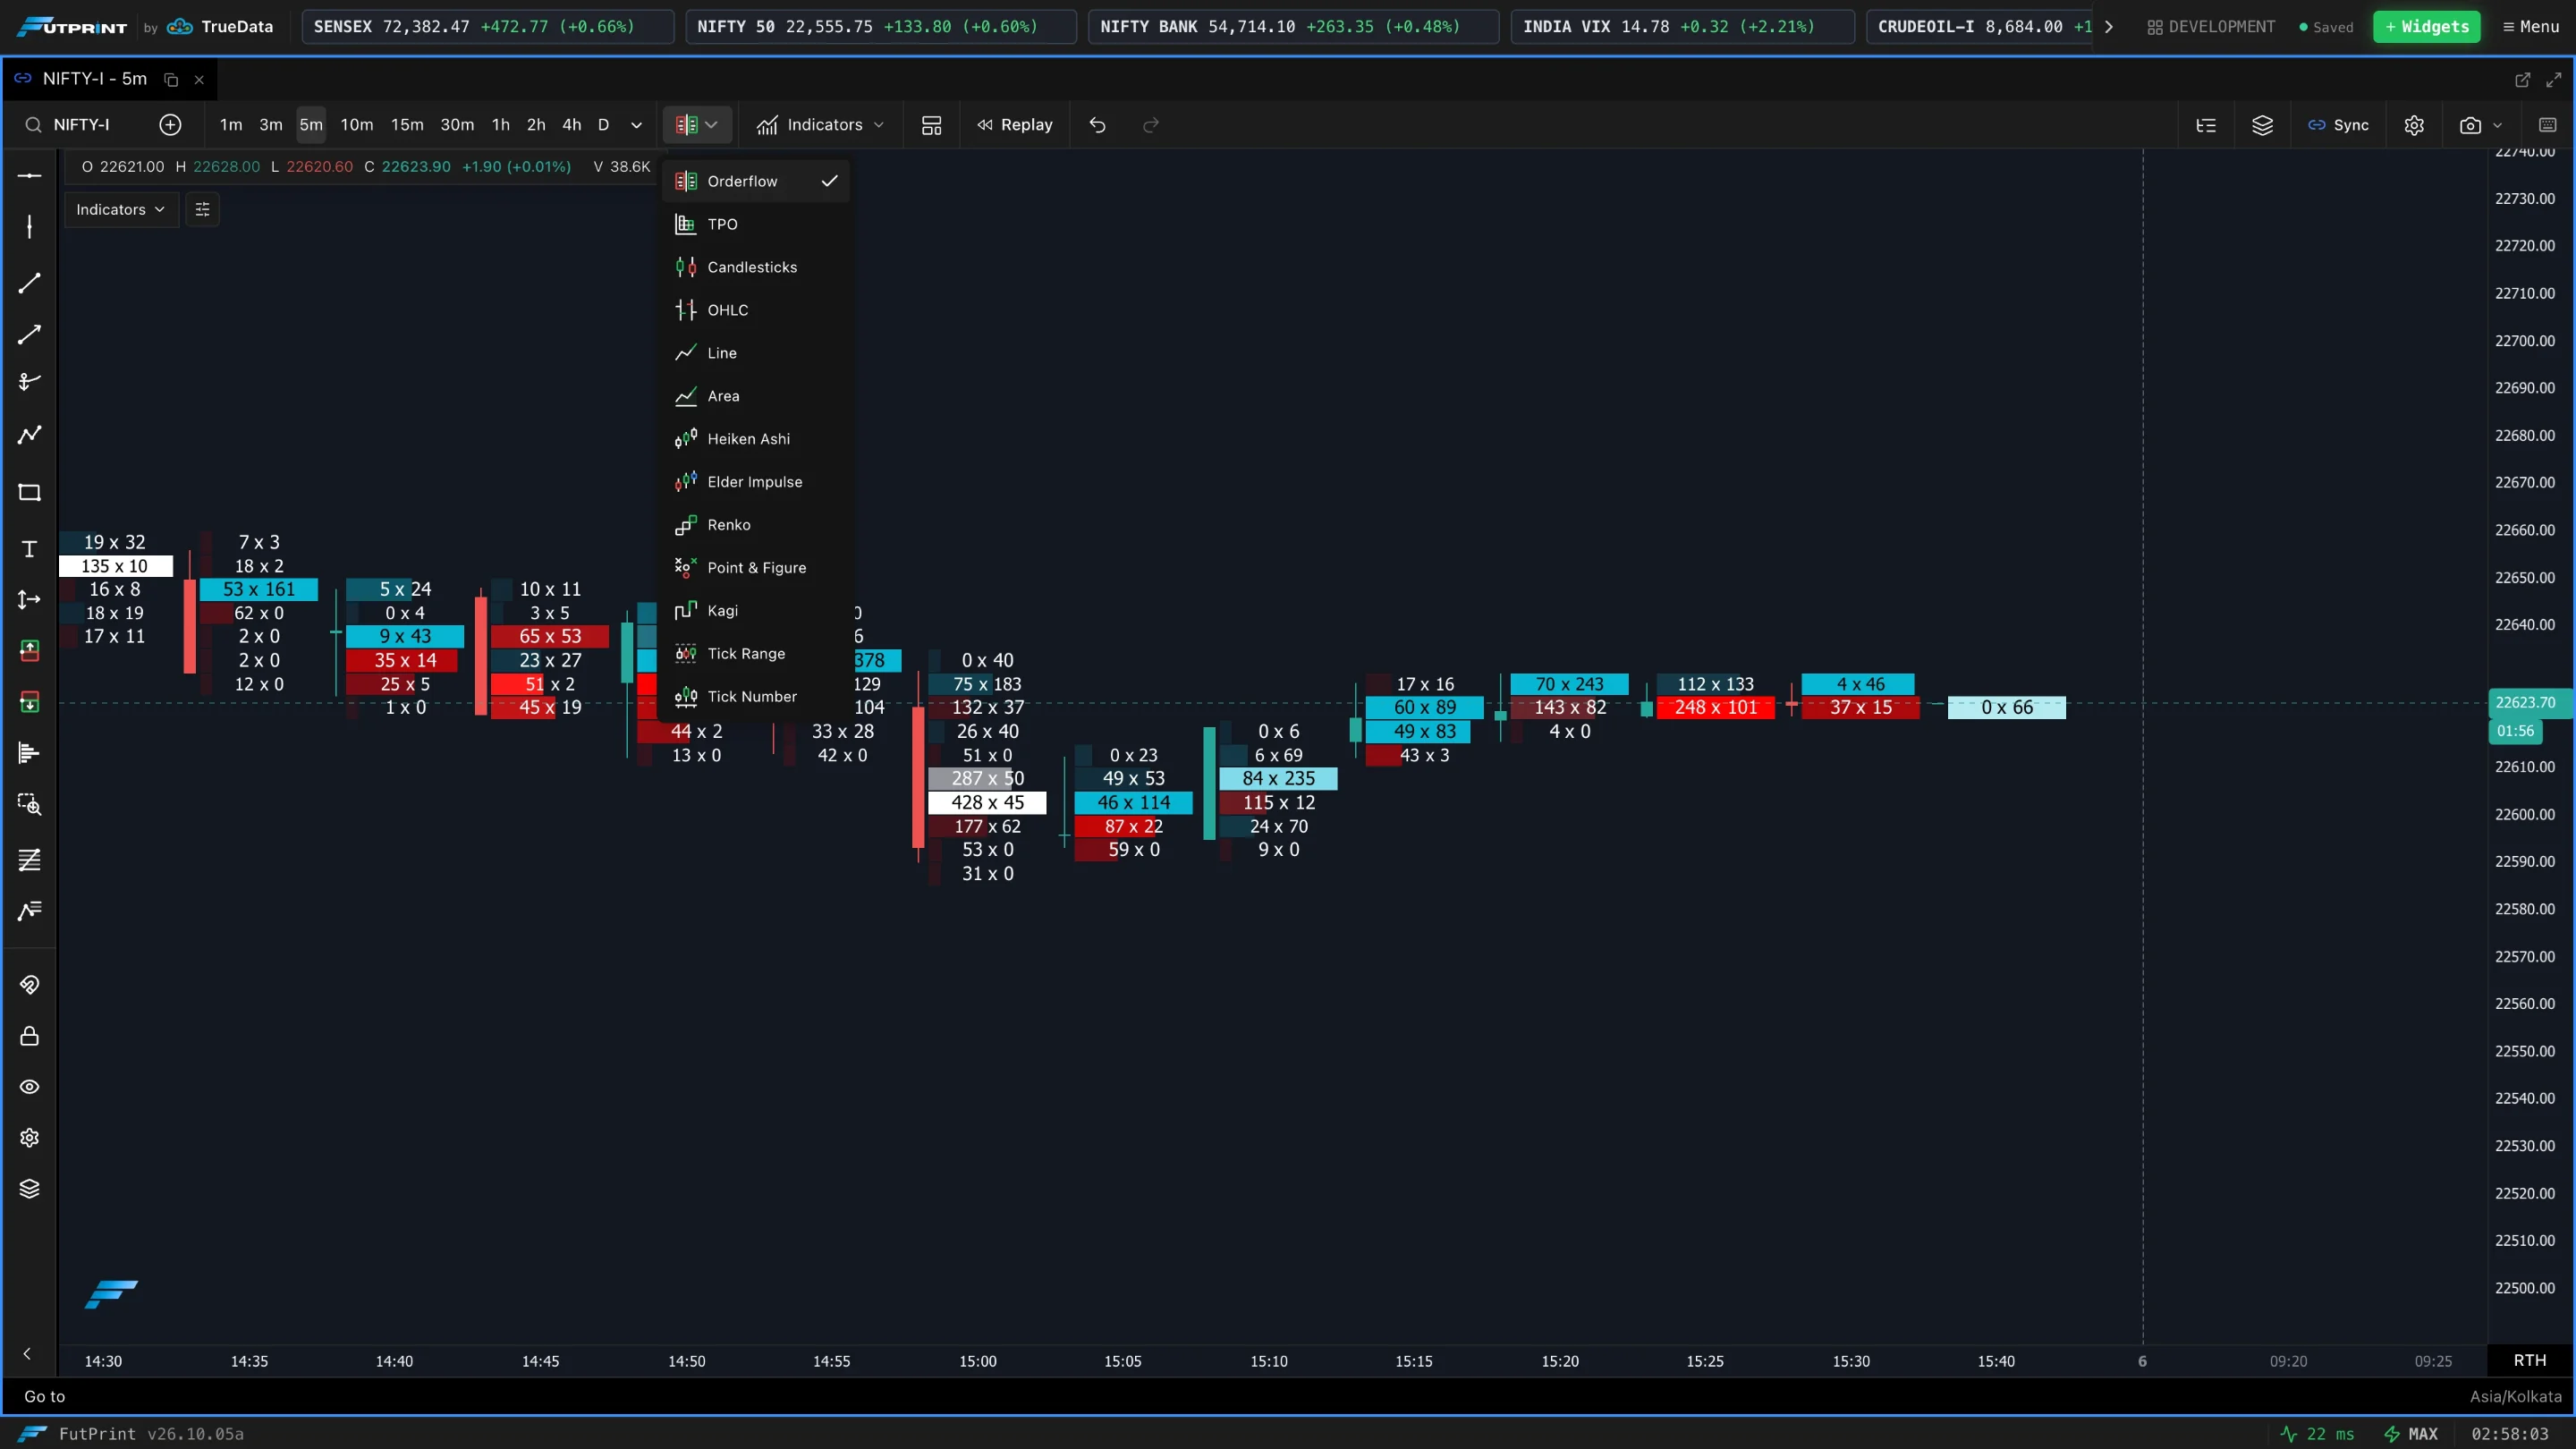
Every screenshot below shows the same instrument (NIFTY futures); use the Dark / Light switch above any image.
Price modes
Candlesticks
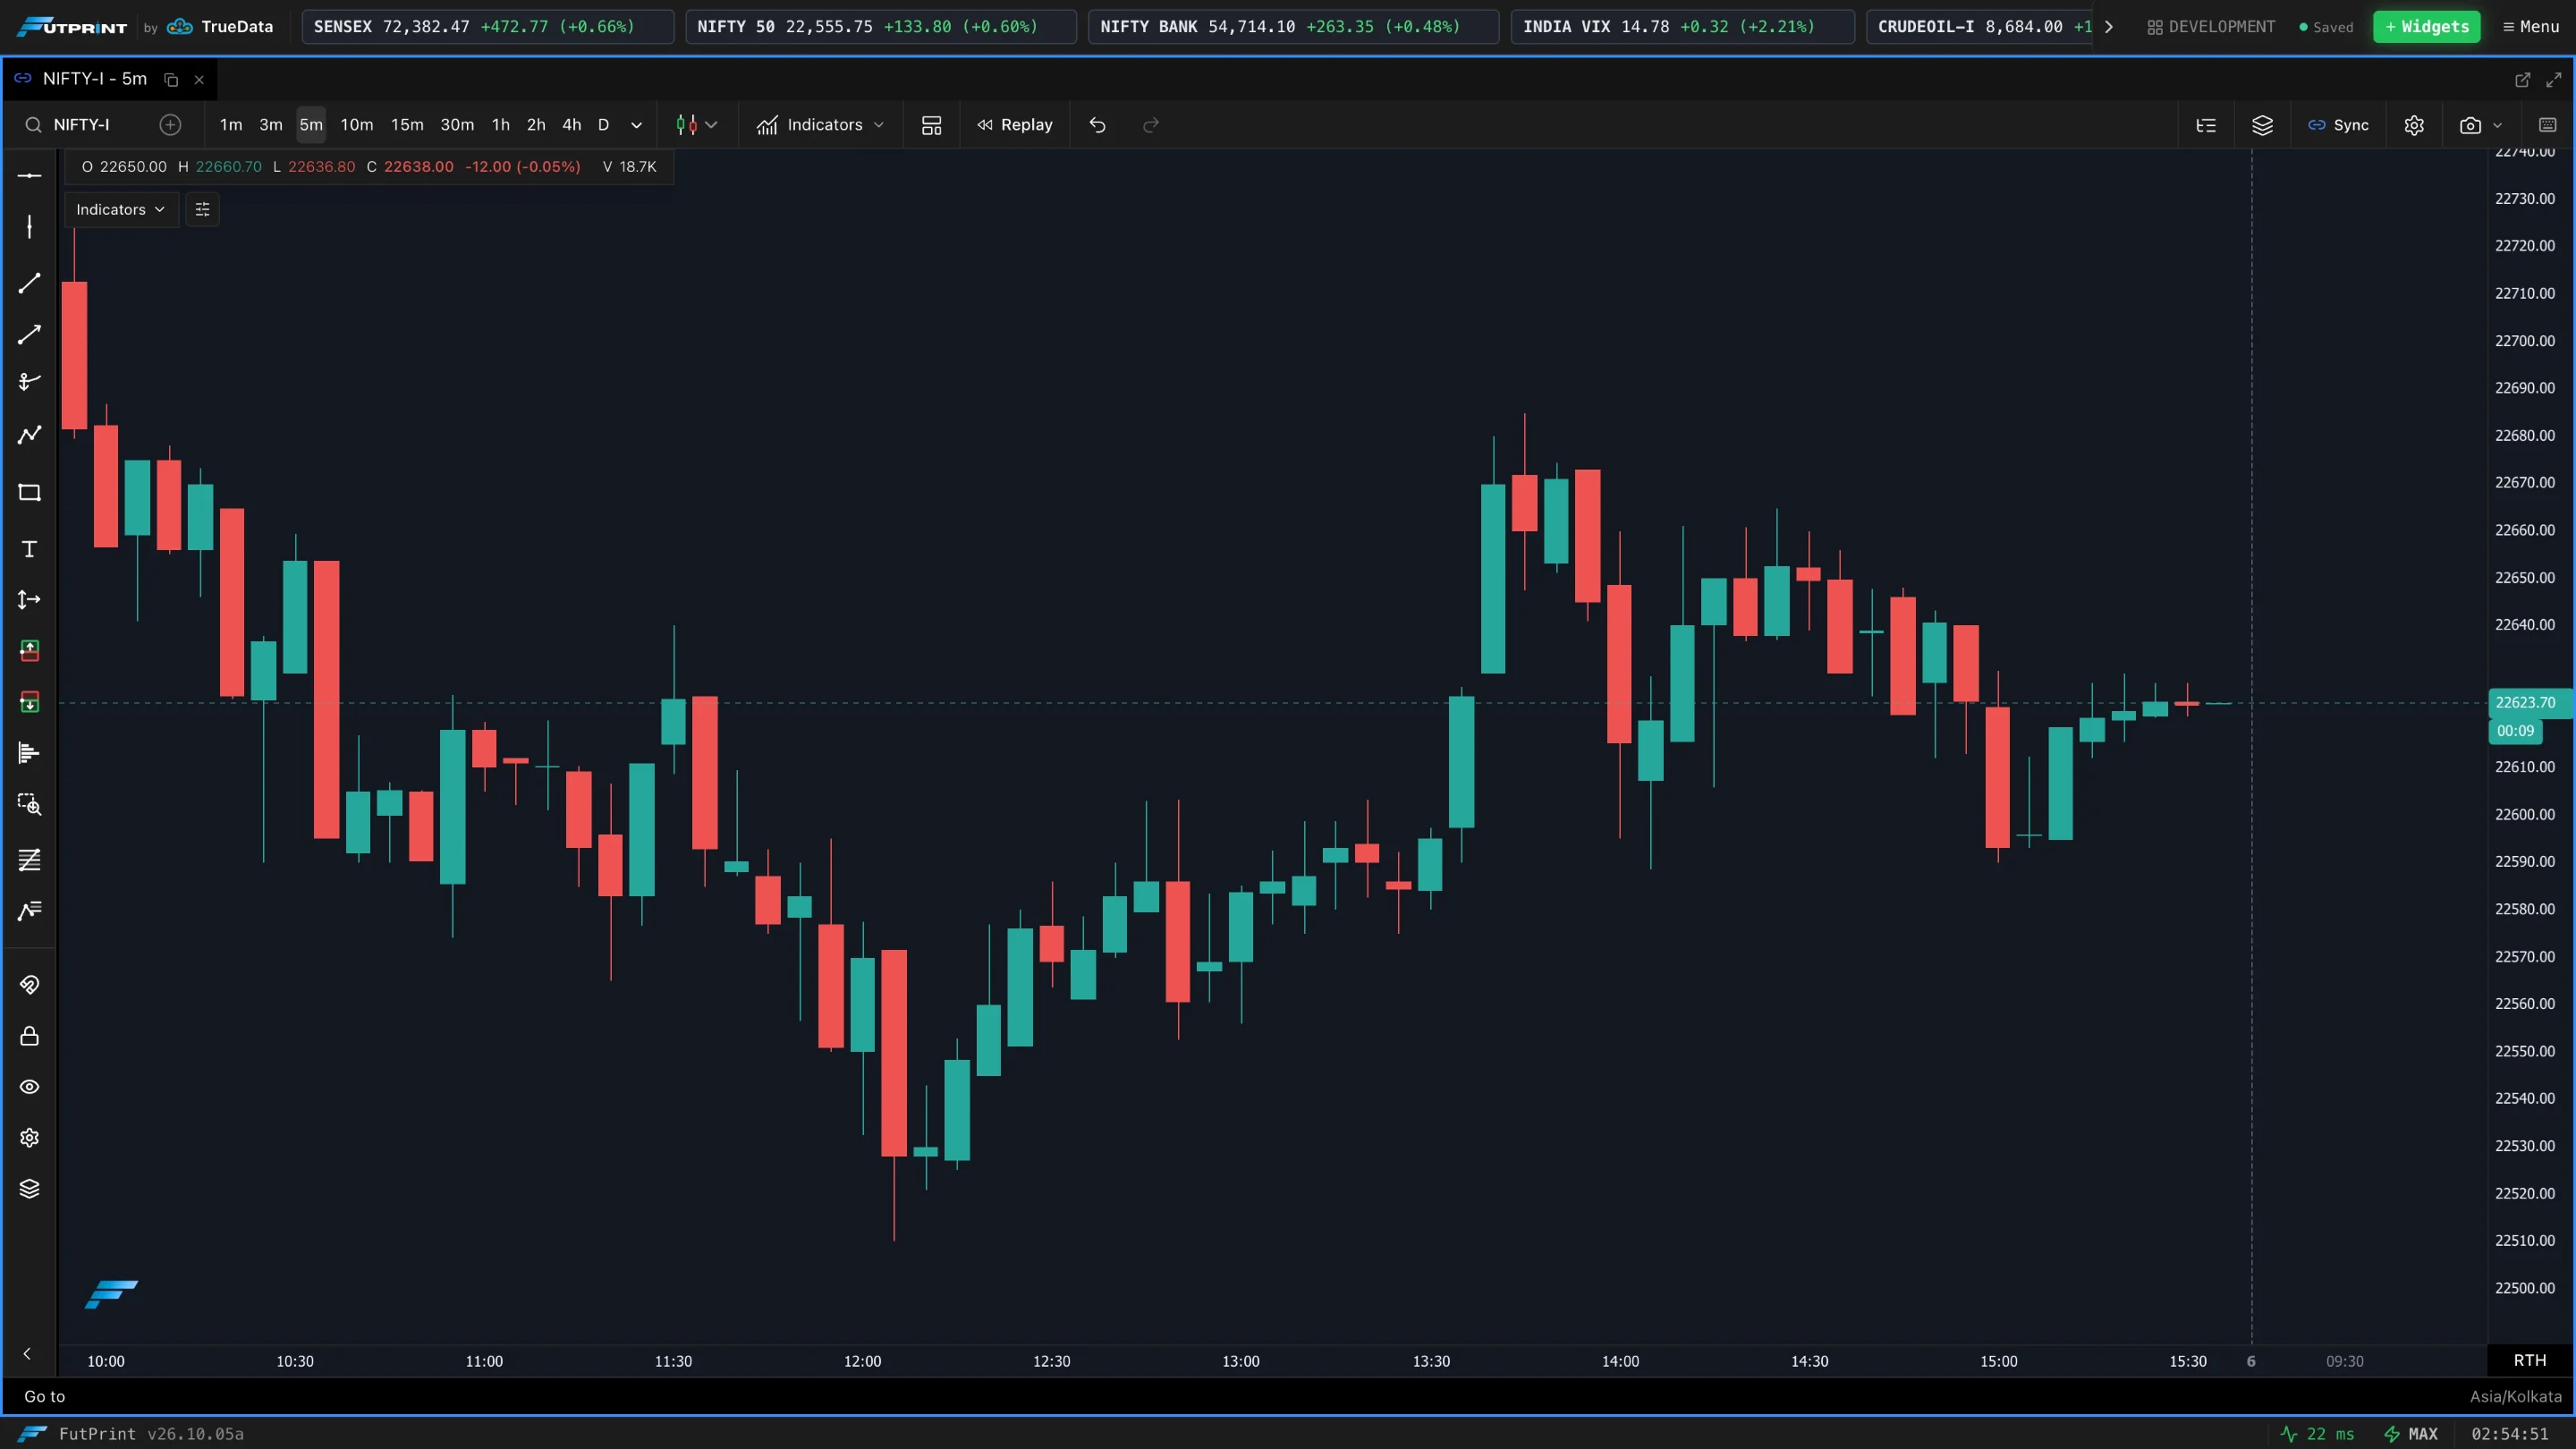
The default. Each bar shows the open, high, low and close as a body with wicks. Green/up and red/down bodies make momentum and ranges easy to read. Best all-round choice.
OHLC bars
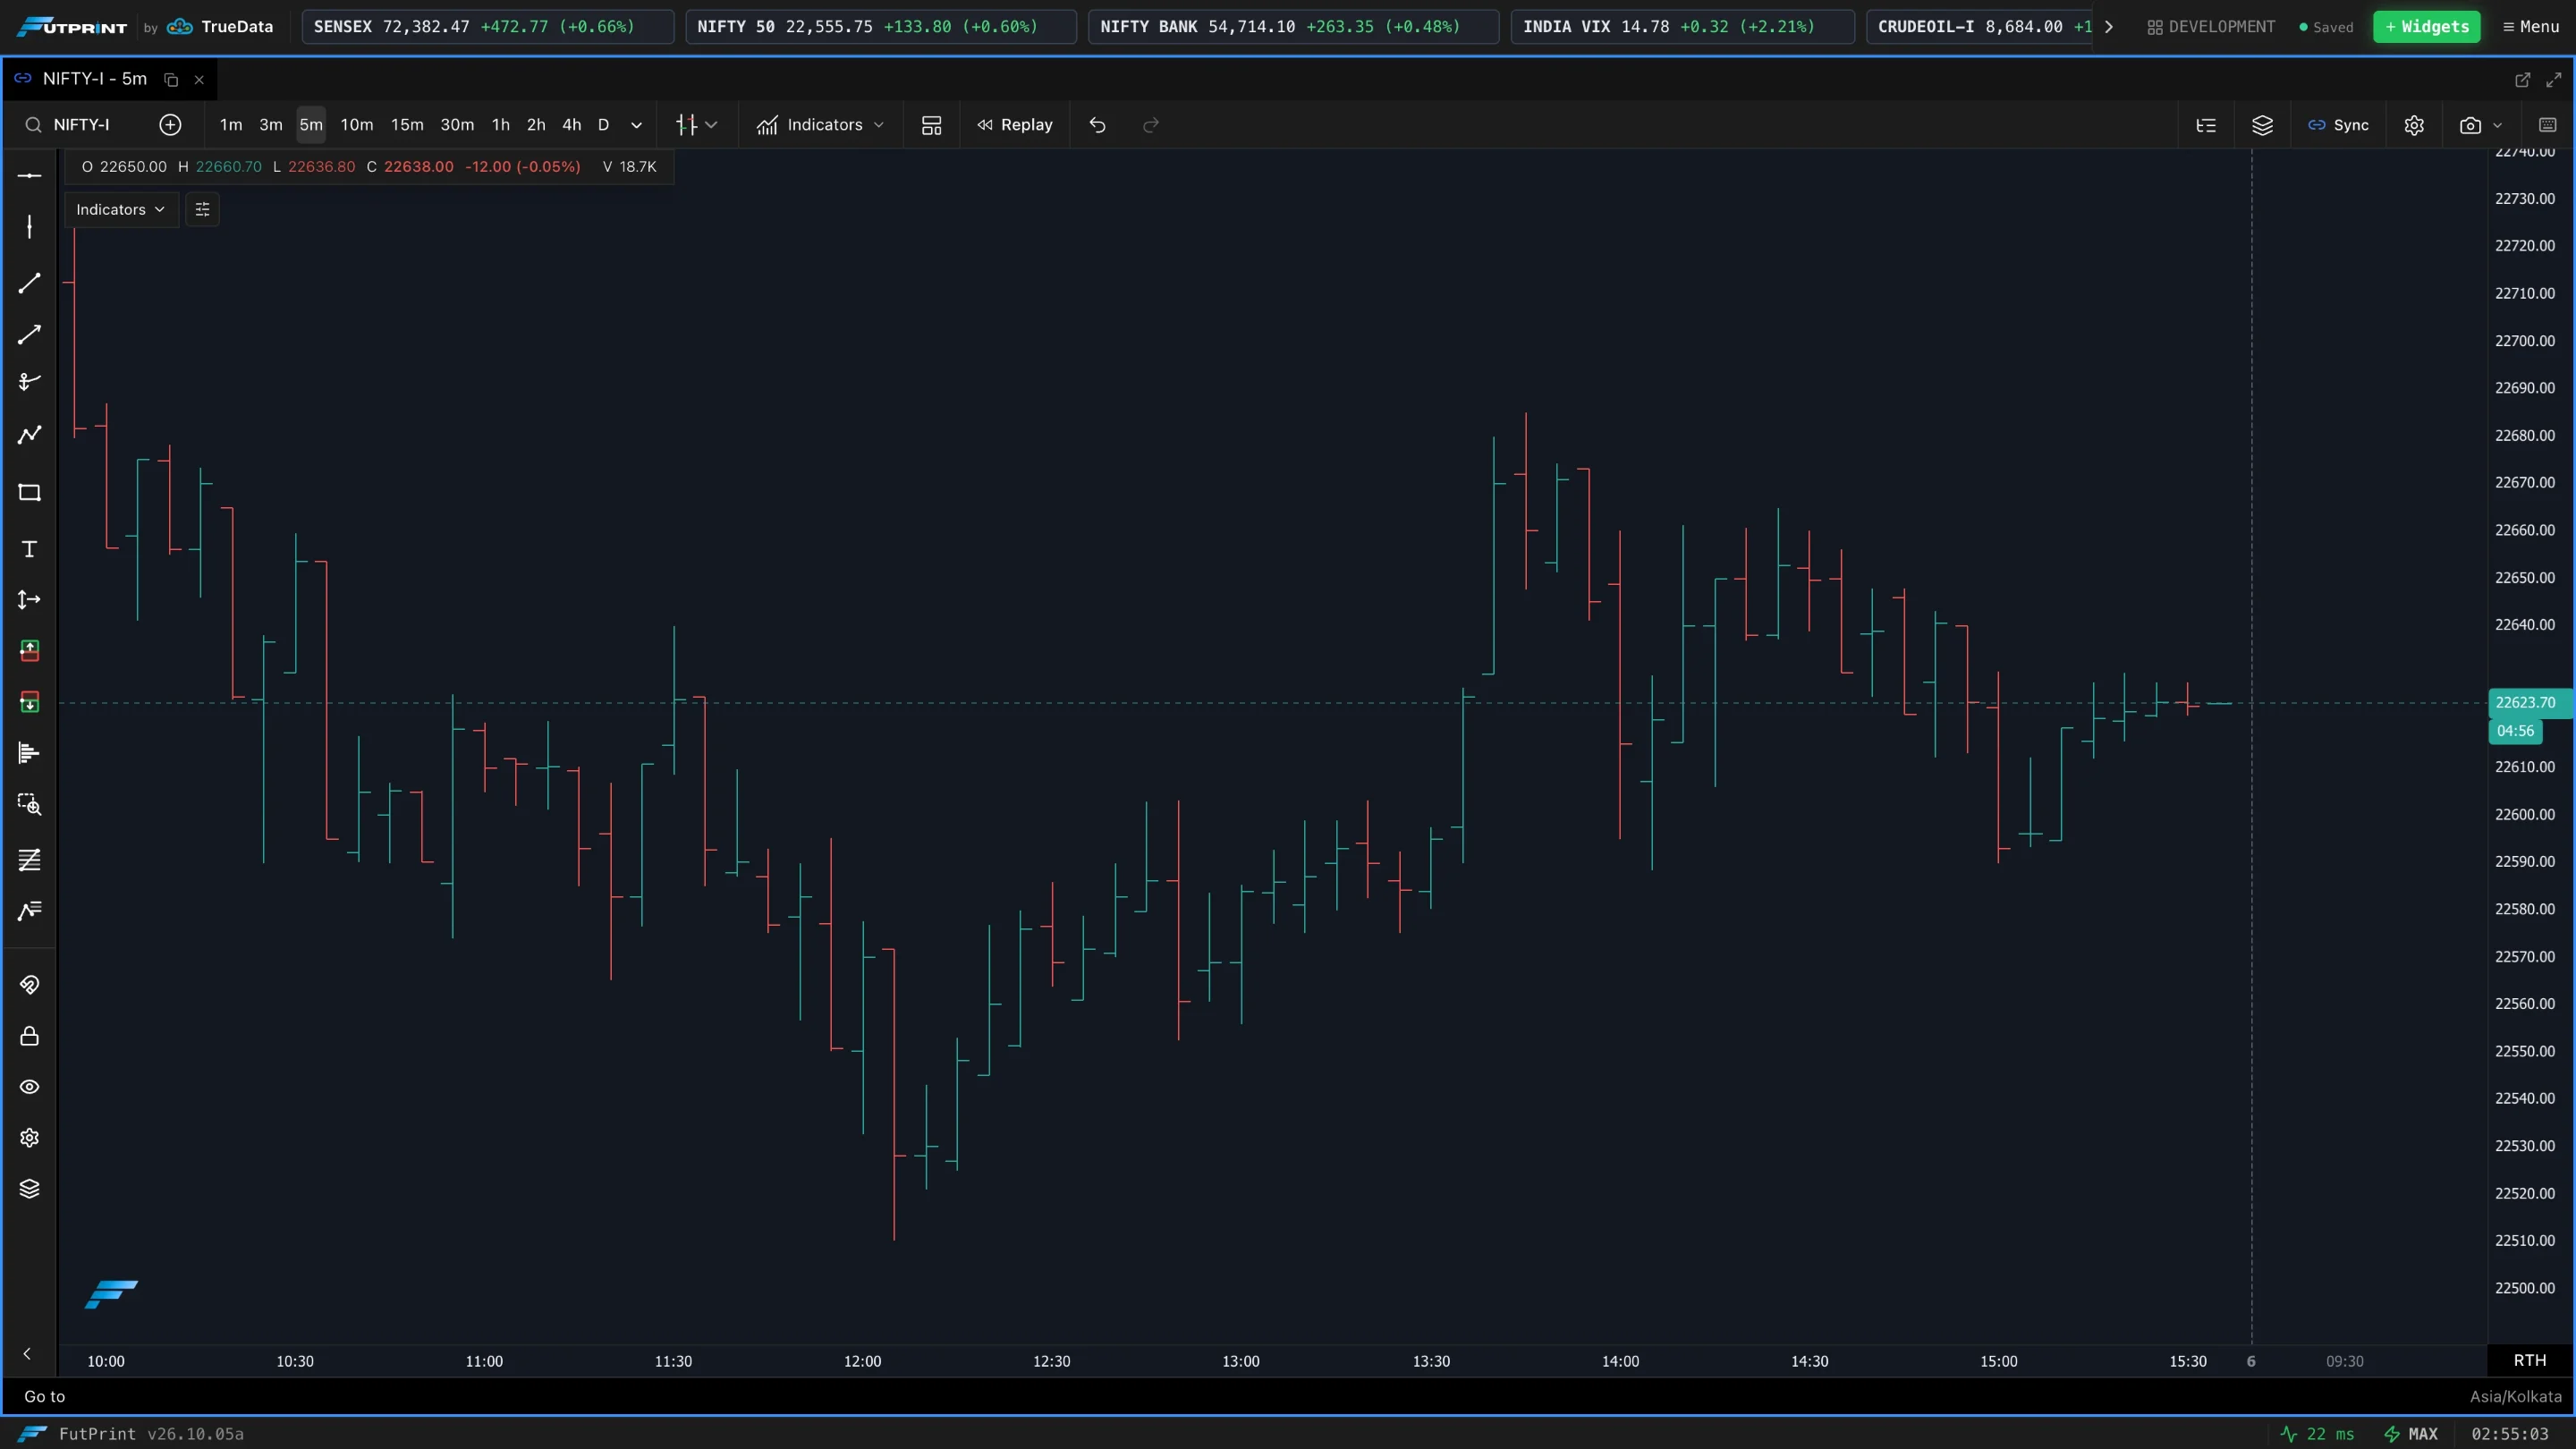
The same open/high/low/close information drawn as bars (open tick left, close tick right) instead of candles. Cleaner when you want less visual weight.
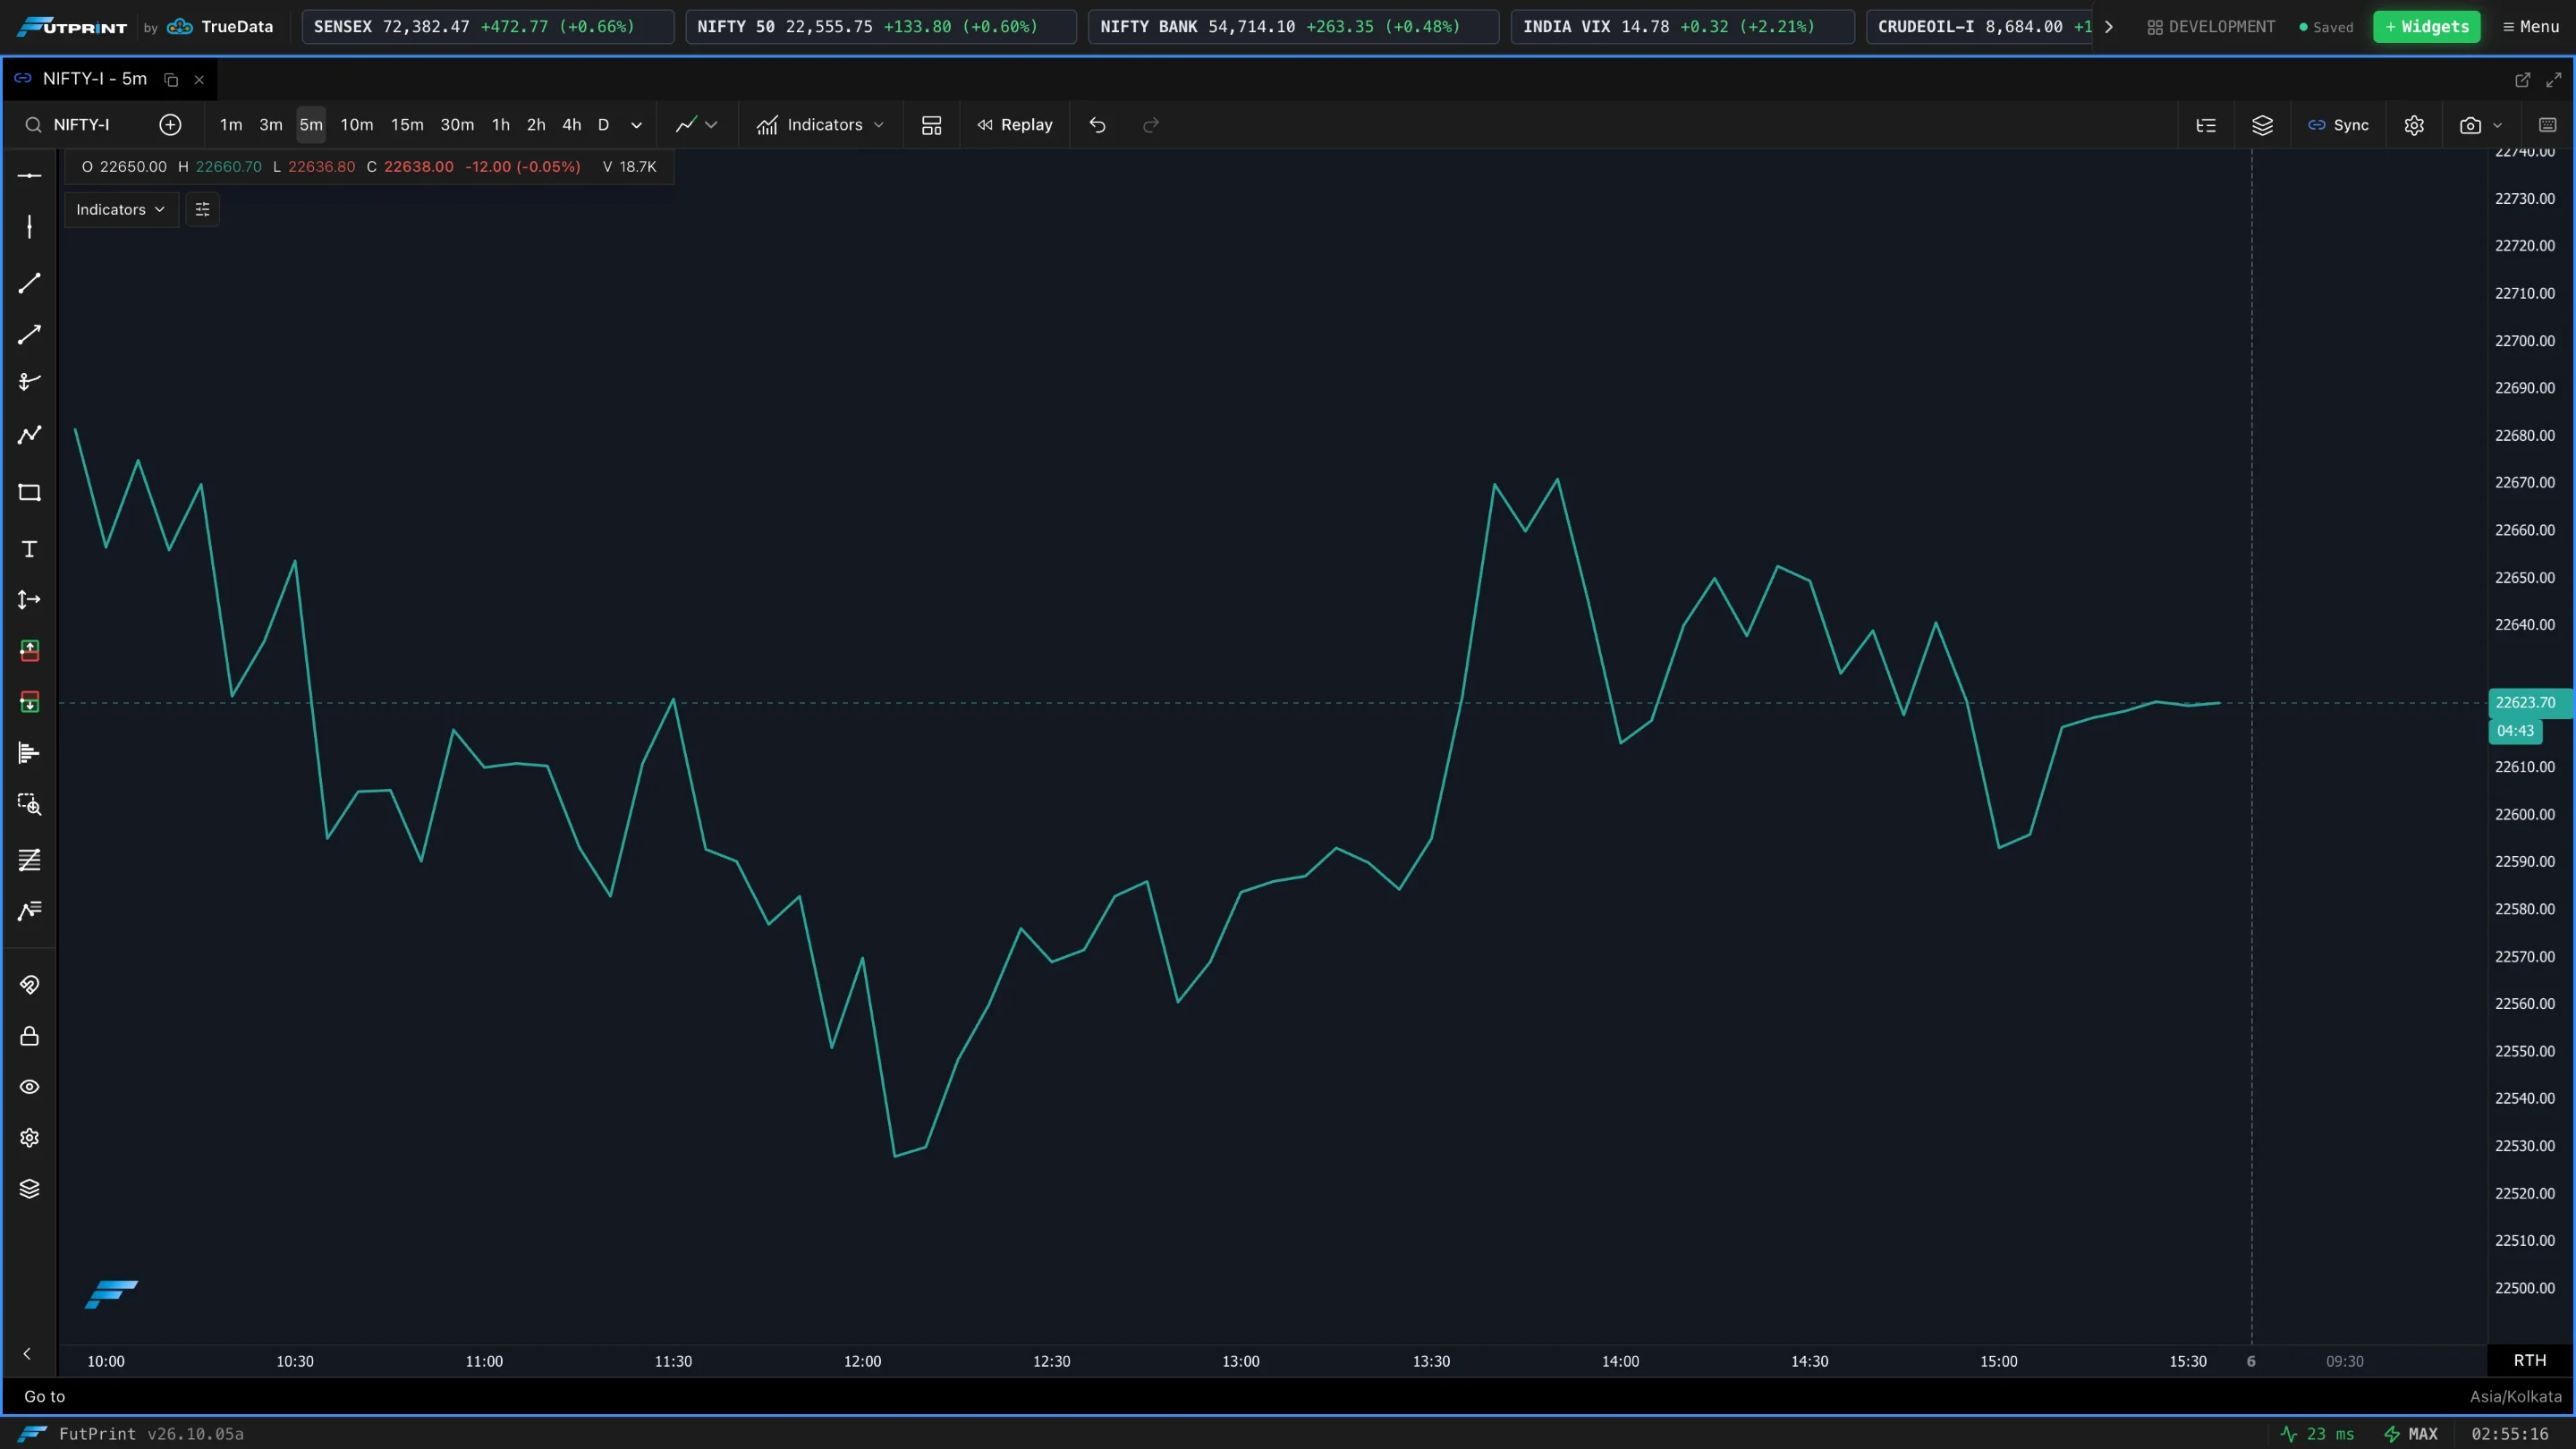
Line
A single line connecting closing prices. Strips out intrabar noise — good for seeing the underlying trend and for clean screenshots.
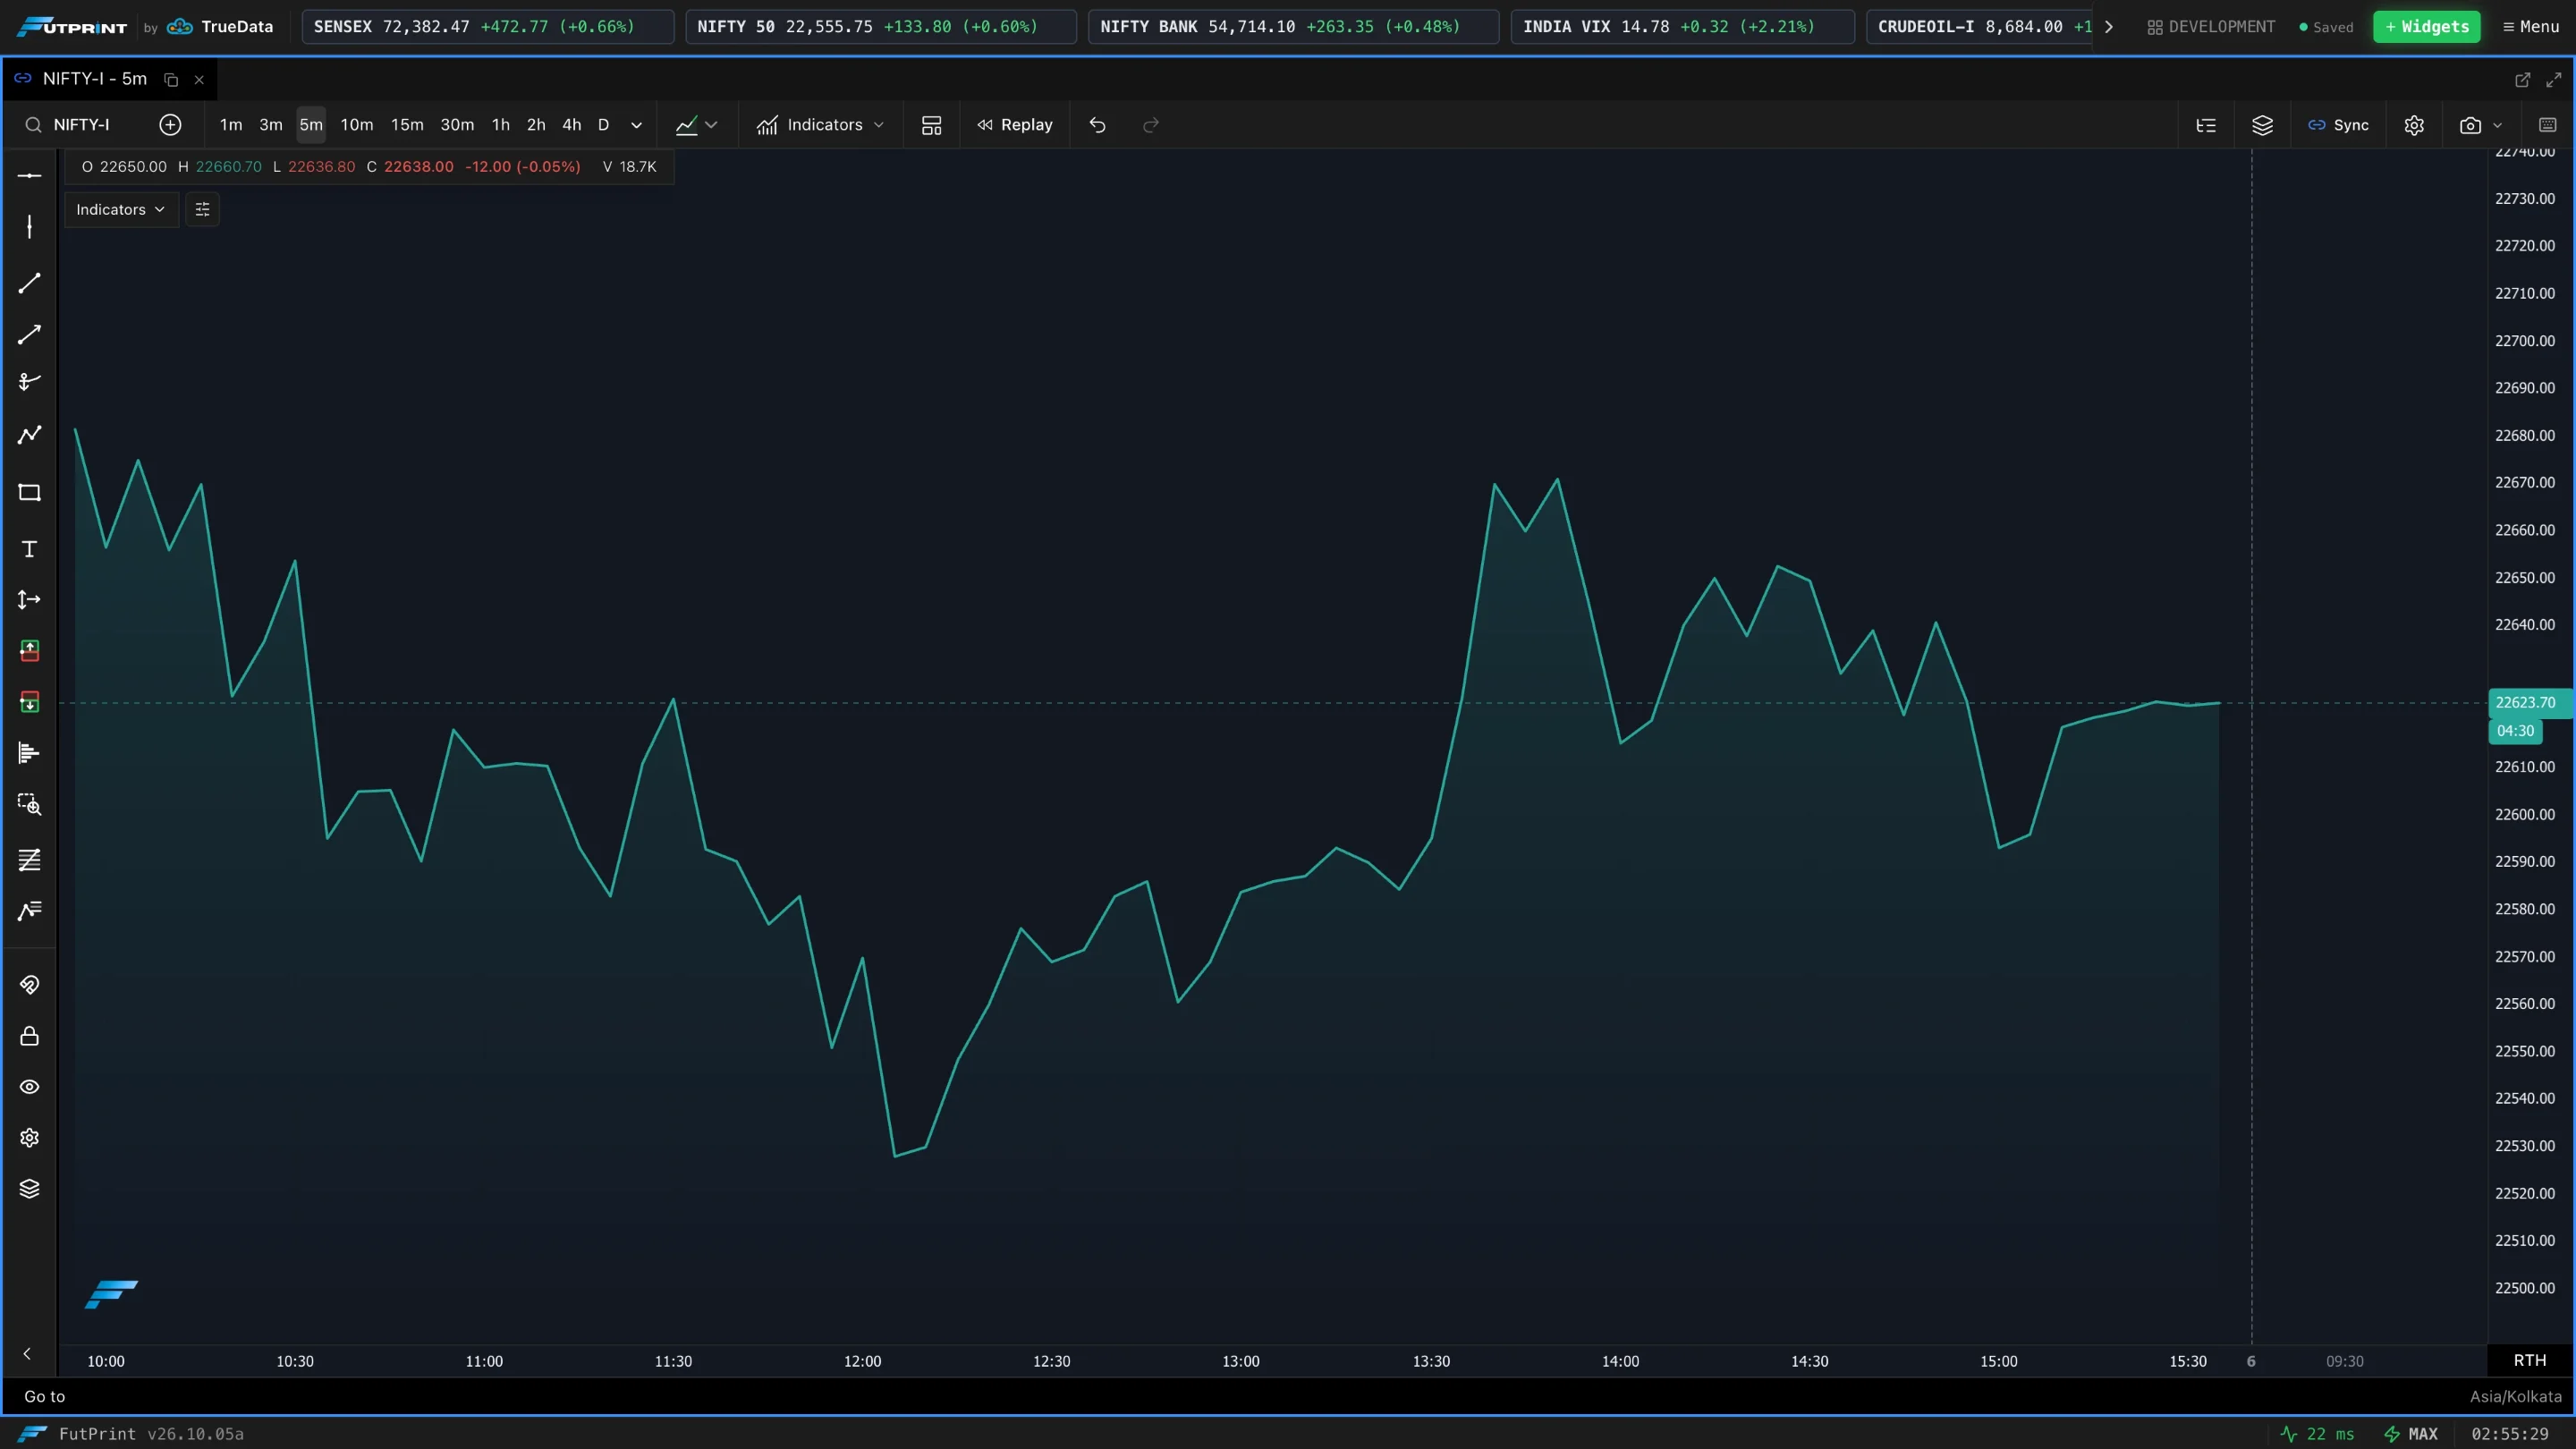
Area
Like Line, but with the area filled below it. Emphasises the overall shape and level of price over fine detail.
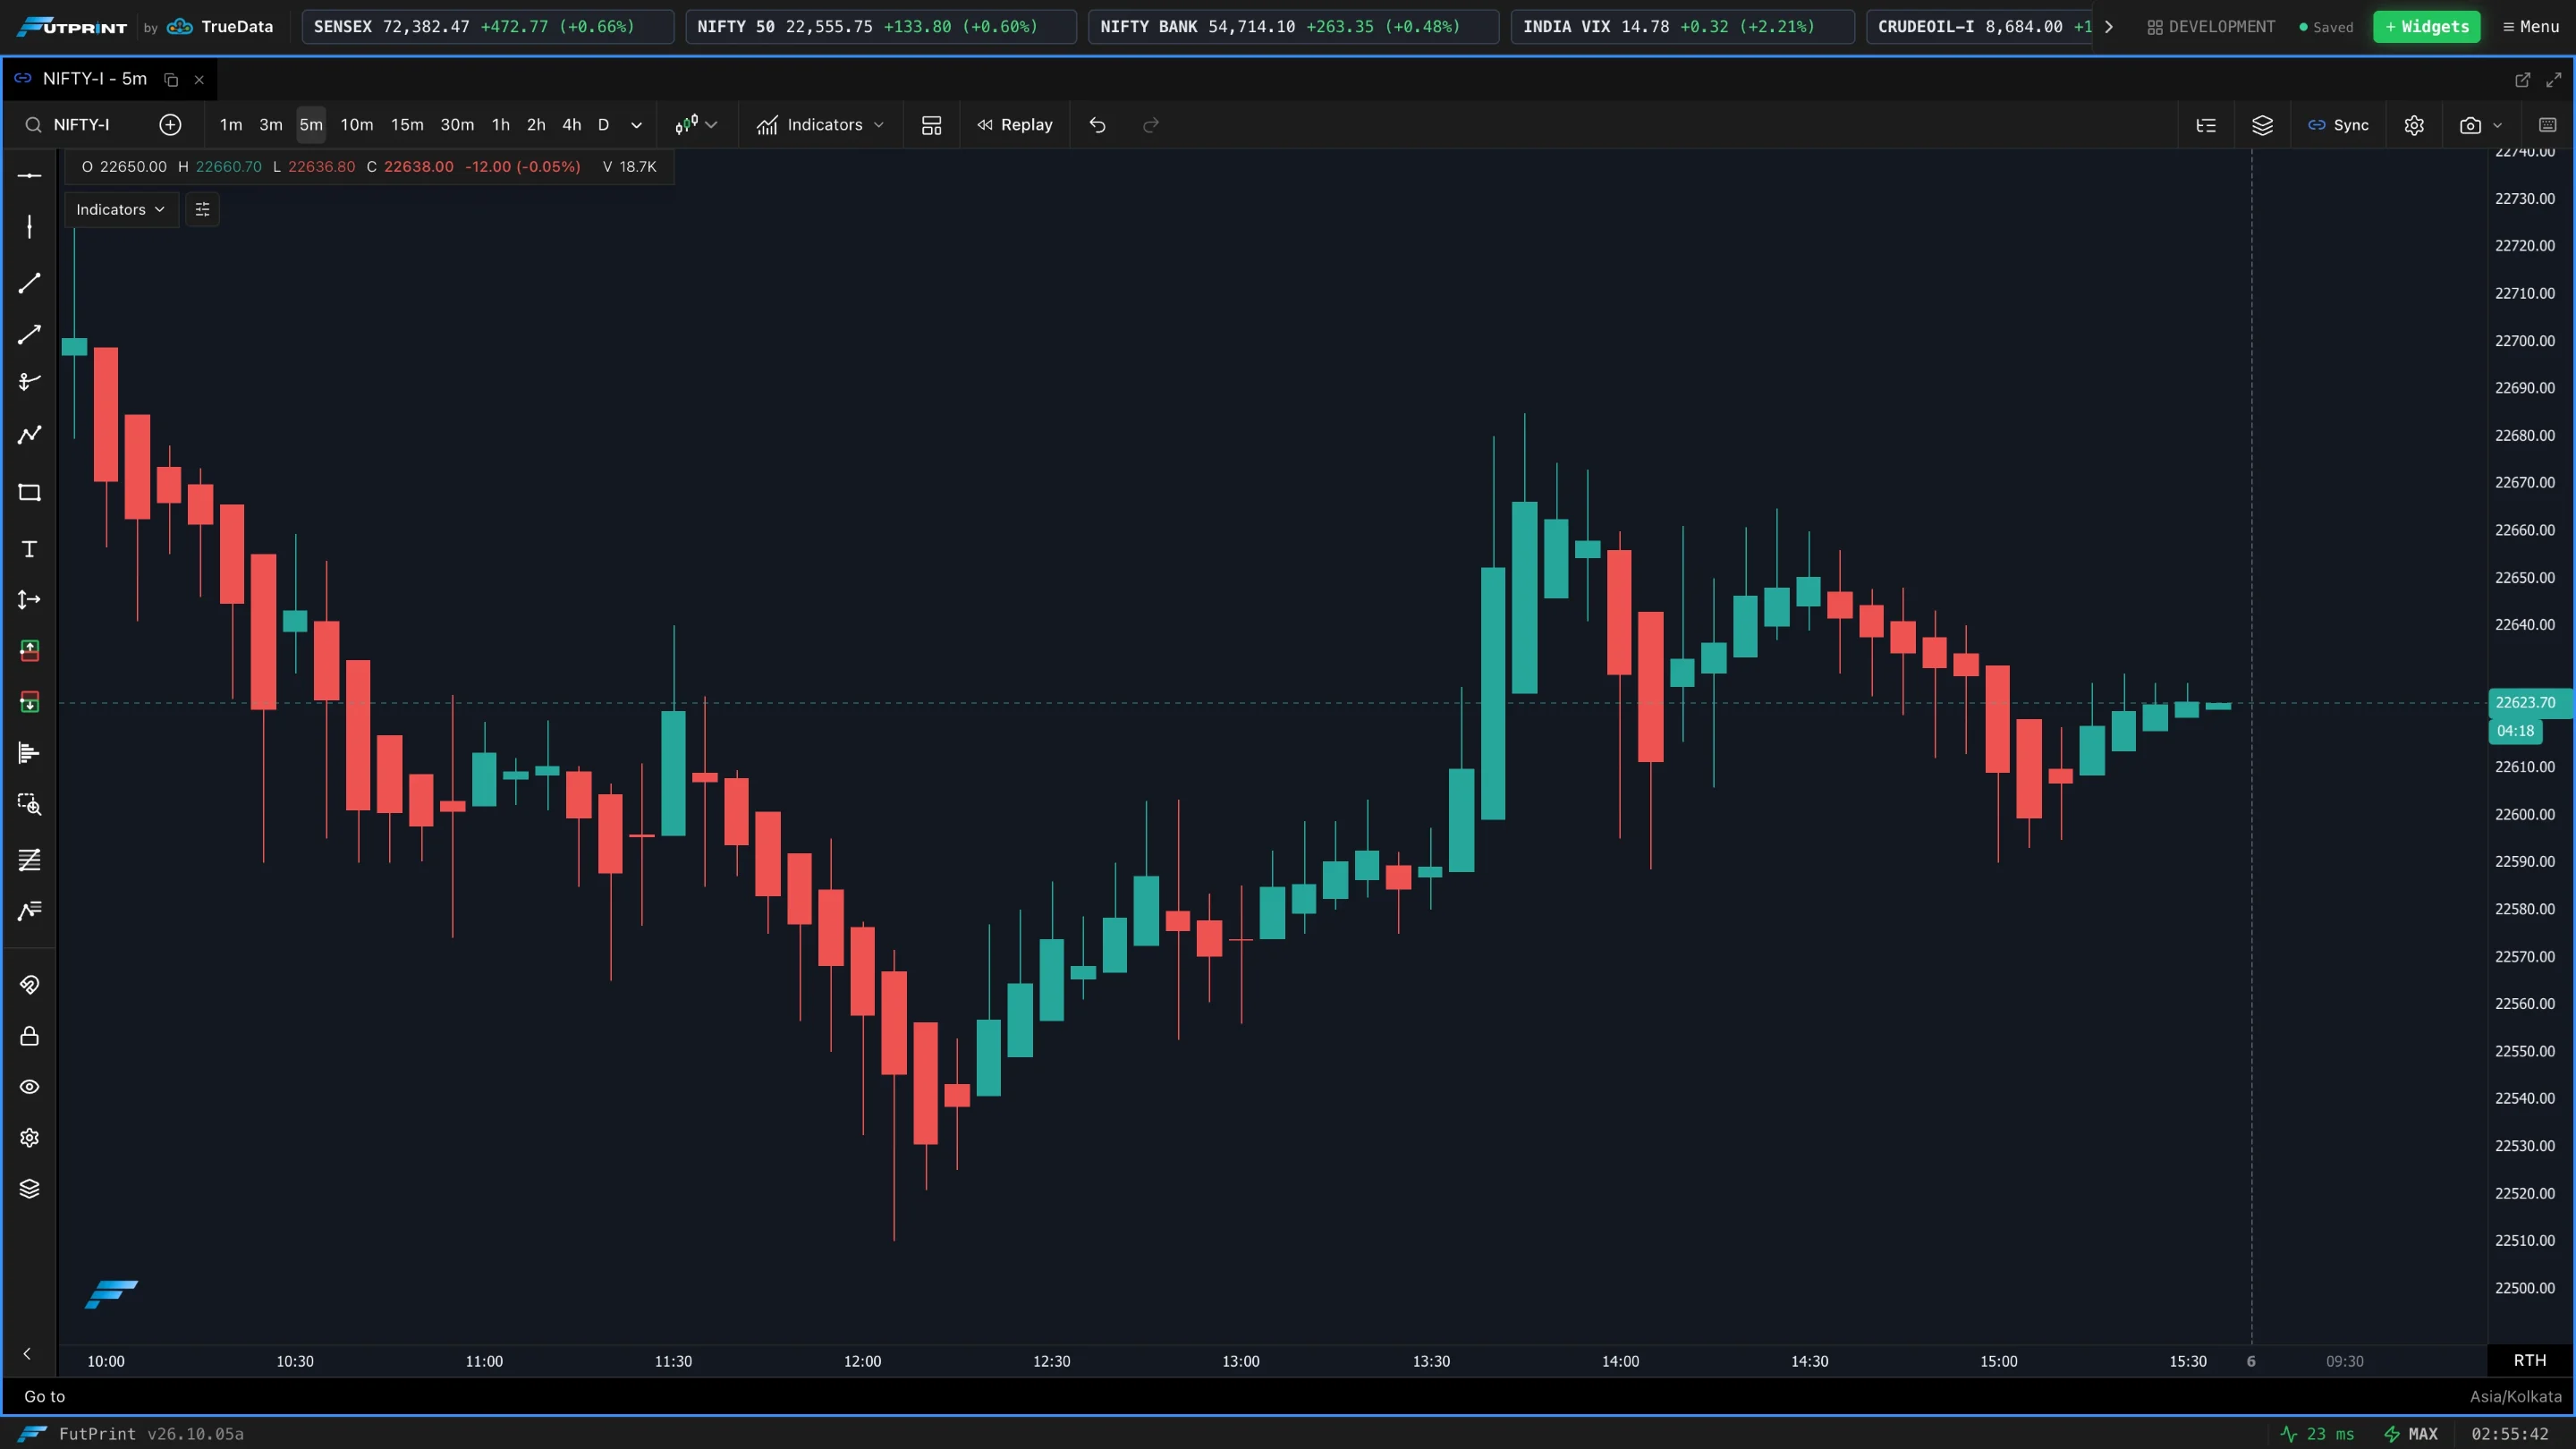
Heiken Ashi
A smoothed candlestick built from averaged values. Consecutive same-colour candles make trends and pullbacks stand out, at the cost of showing the exact open/close of each period. Great for trend-following.
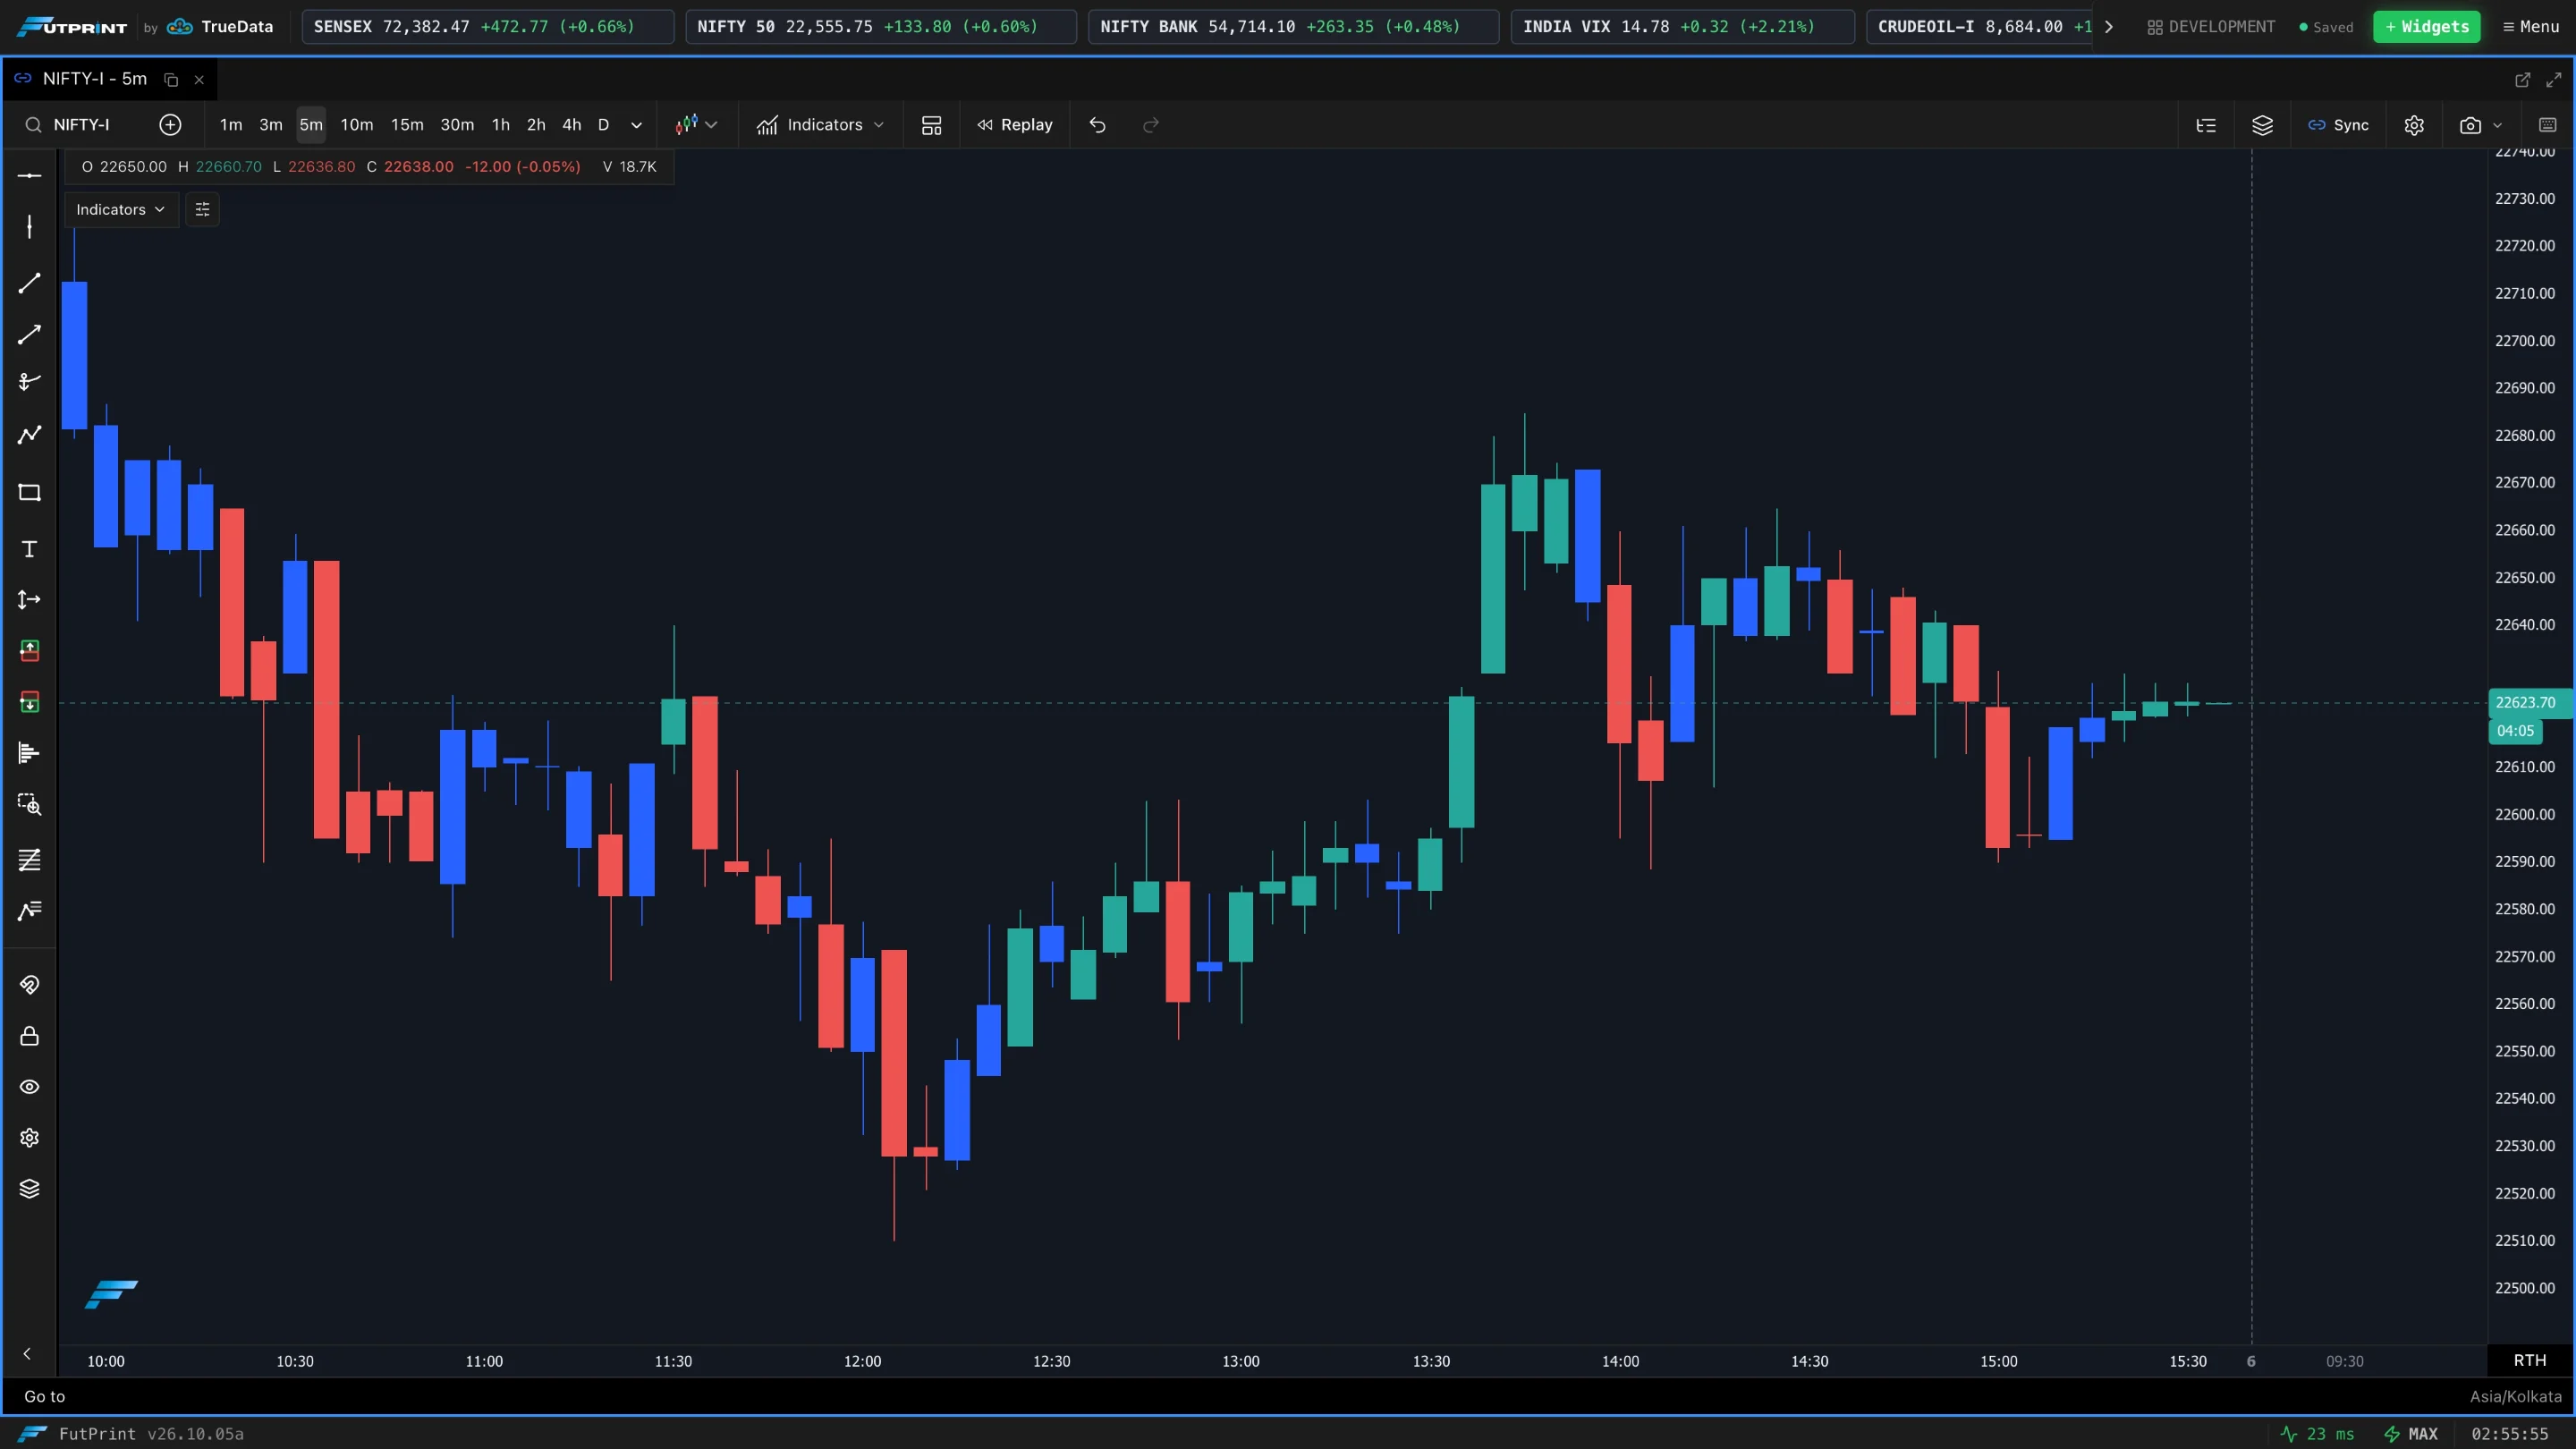
Elder Impulse
Candles coloured by Alexander Elder's Impulse System, which combines trend and momentum: one colour when both point up, another when both point down, and a neutral colour when they disagree. It answers "is it allowed to buy or sell here?" at a glance.
Price-movement modes
These ignore time and draw a new element only when price moves far enough, which filters out sideways noise.
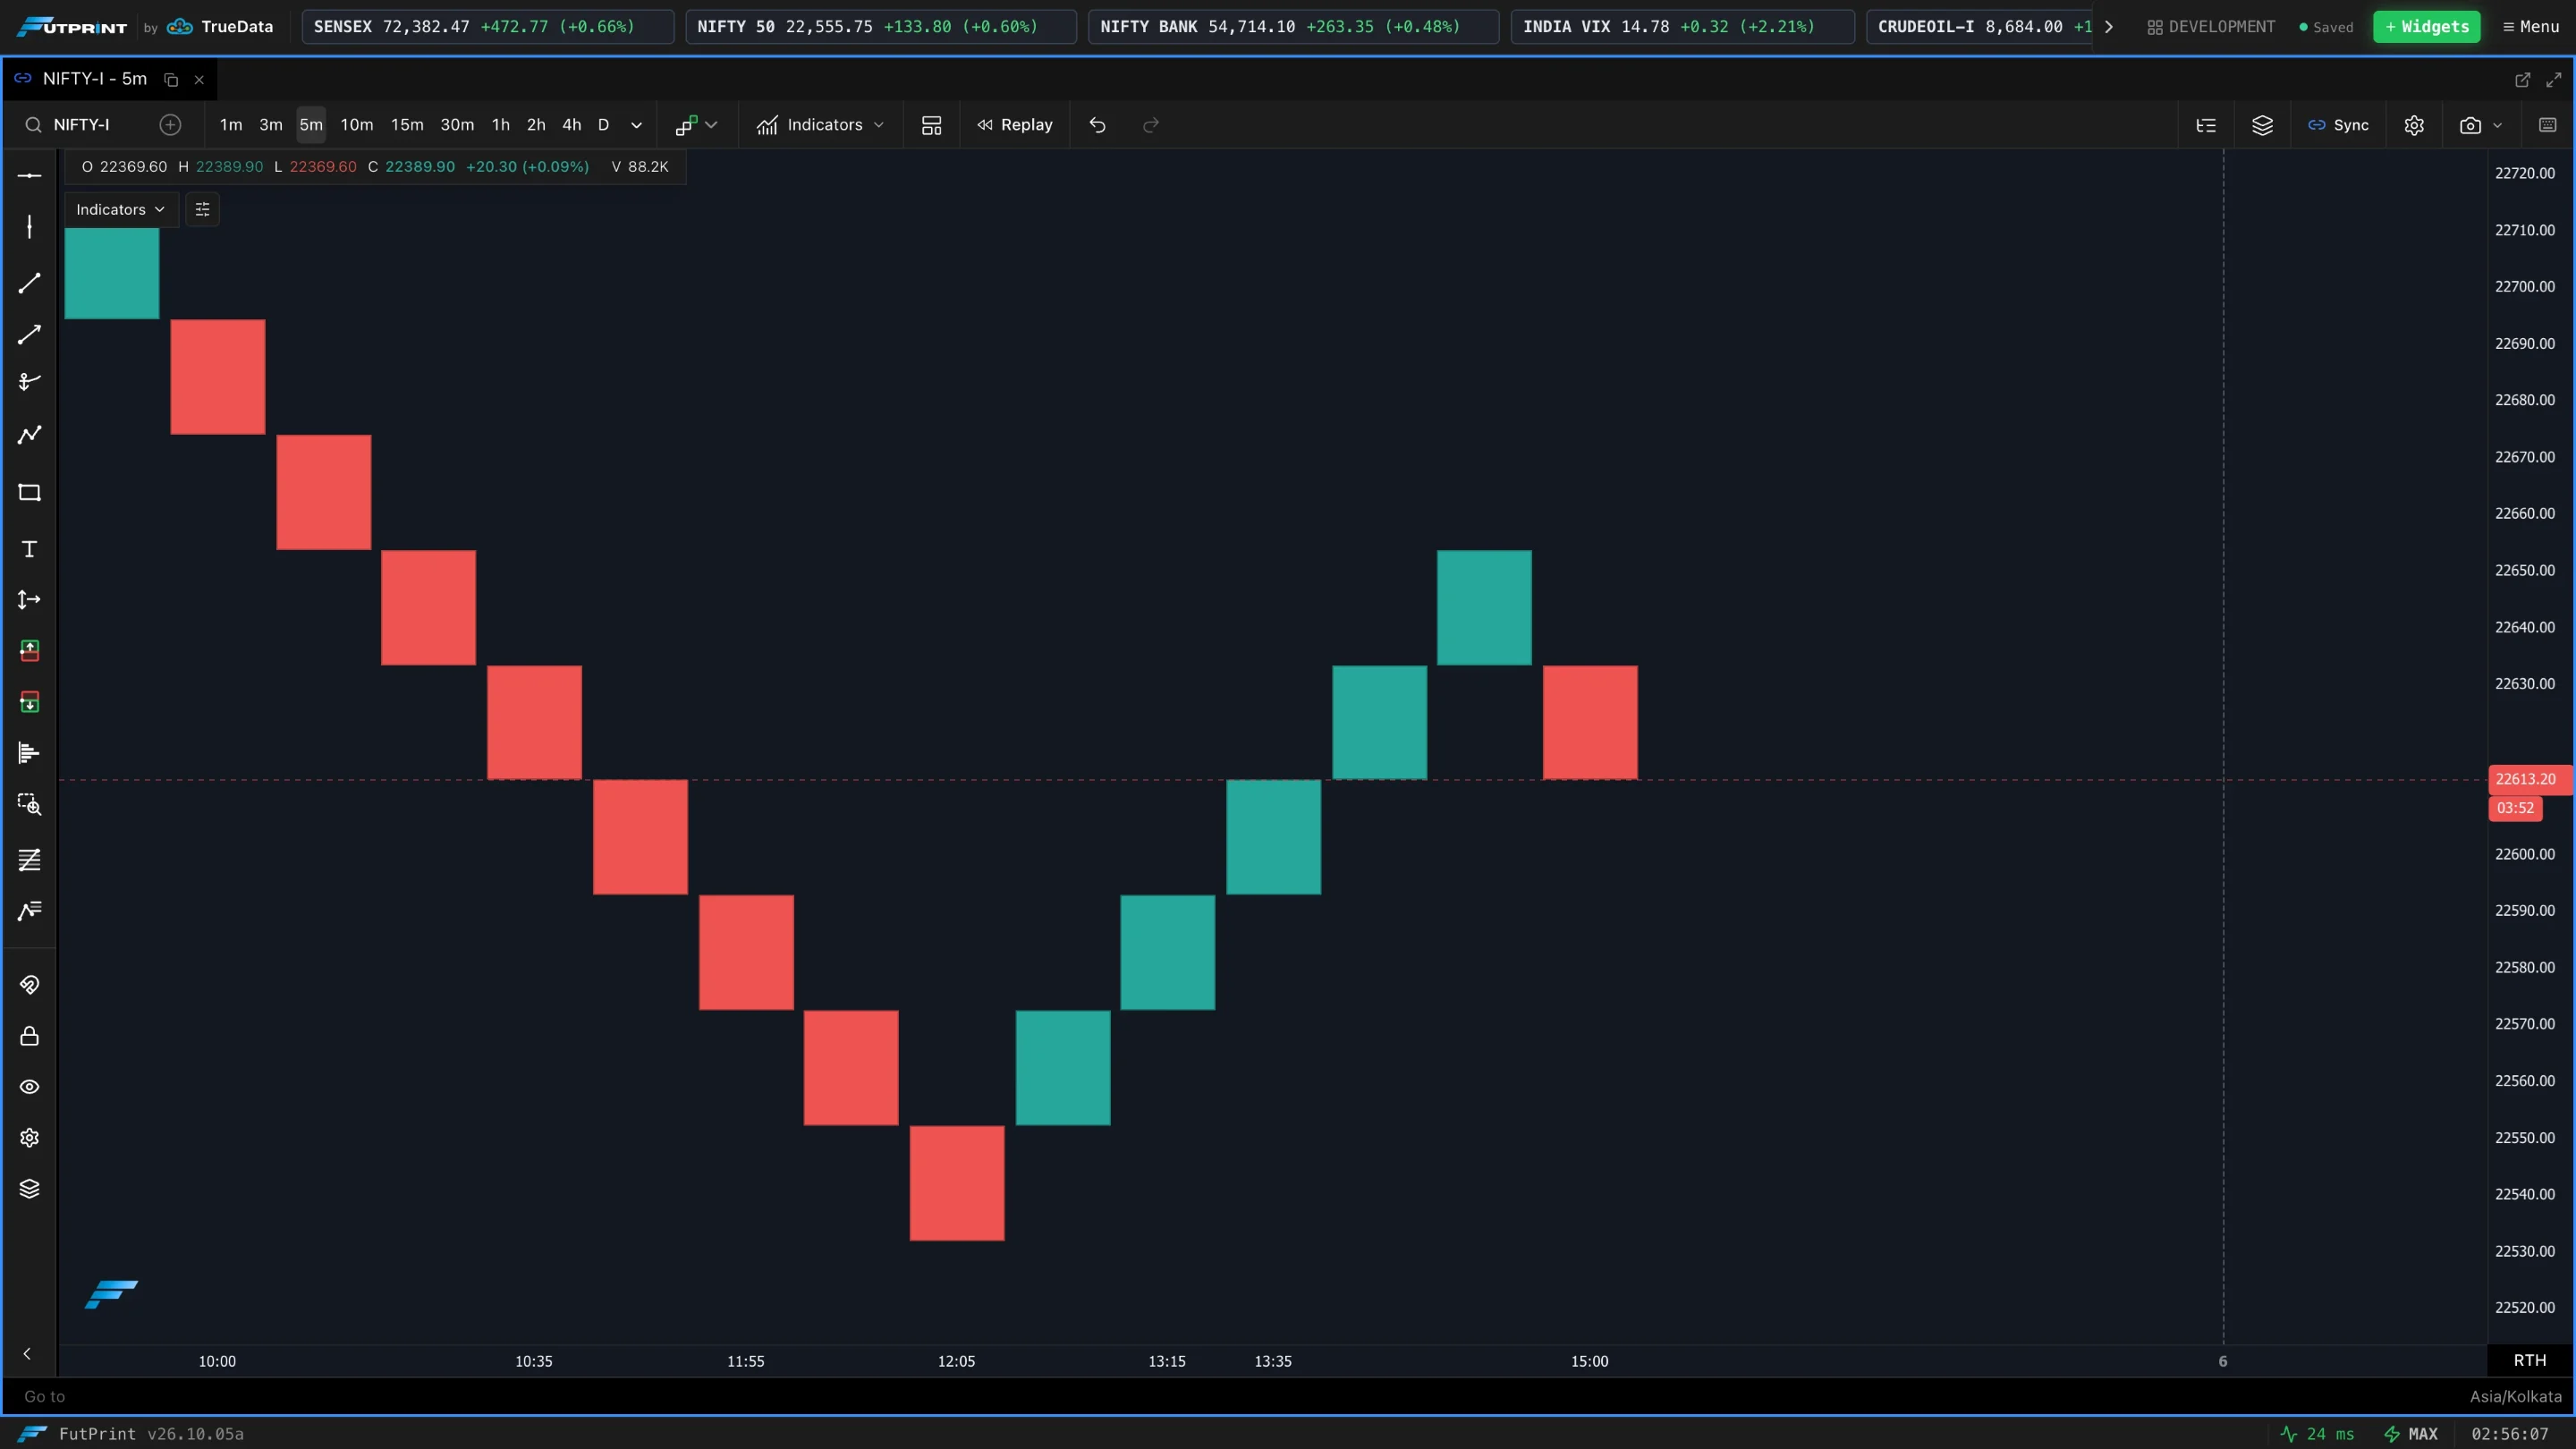
Renko
Equal-sized bricks. A new brick is added only when price moves one full brick beyond the last, so trends appear as clean staircases.
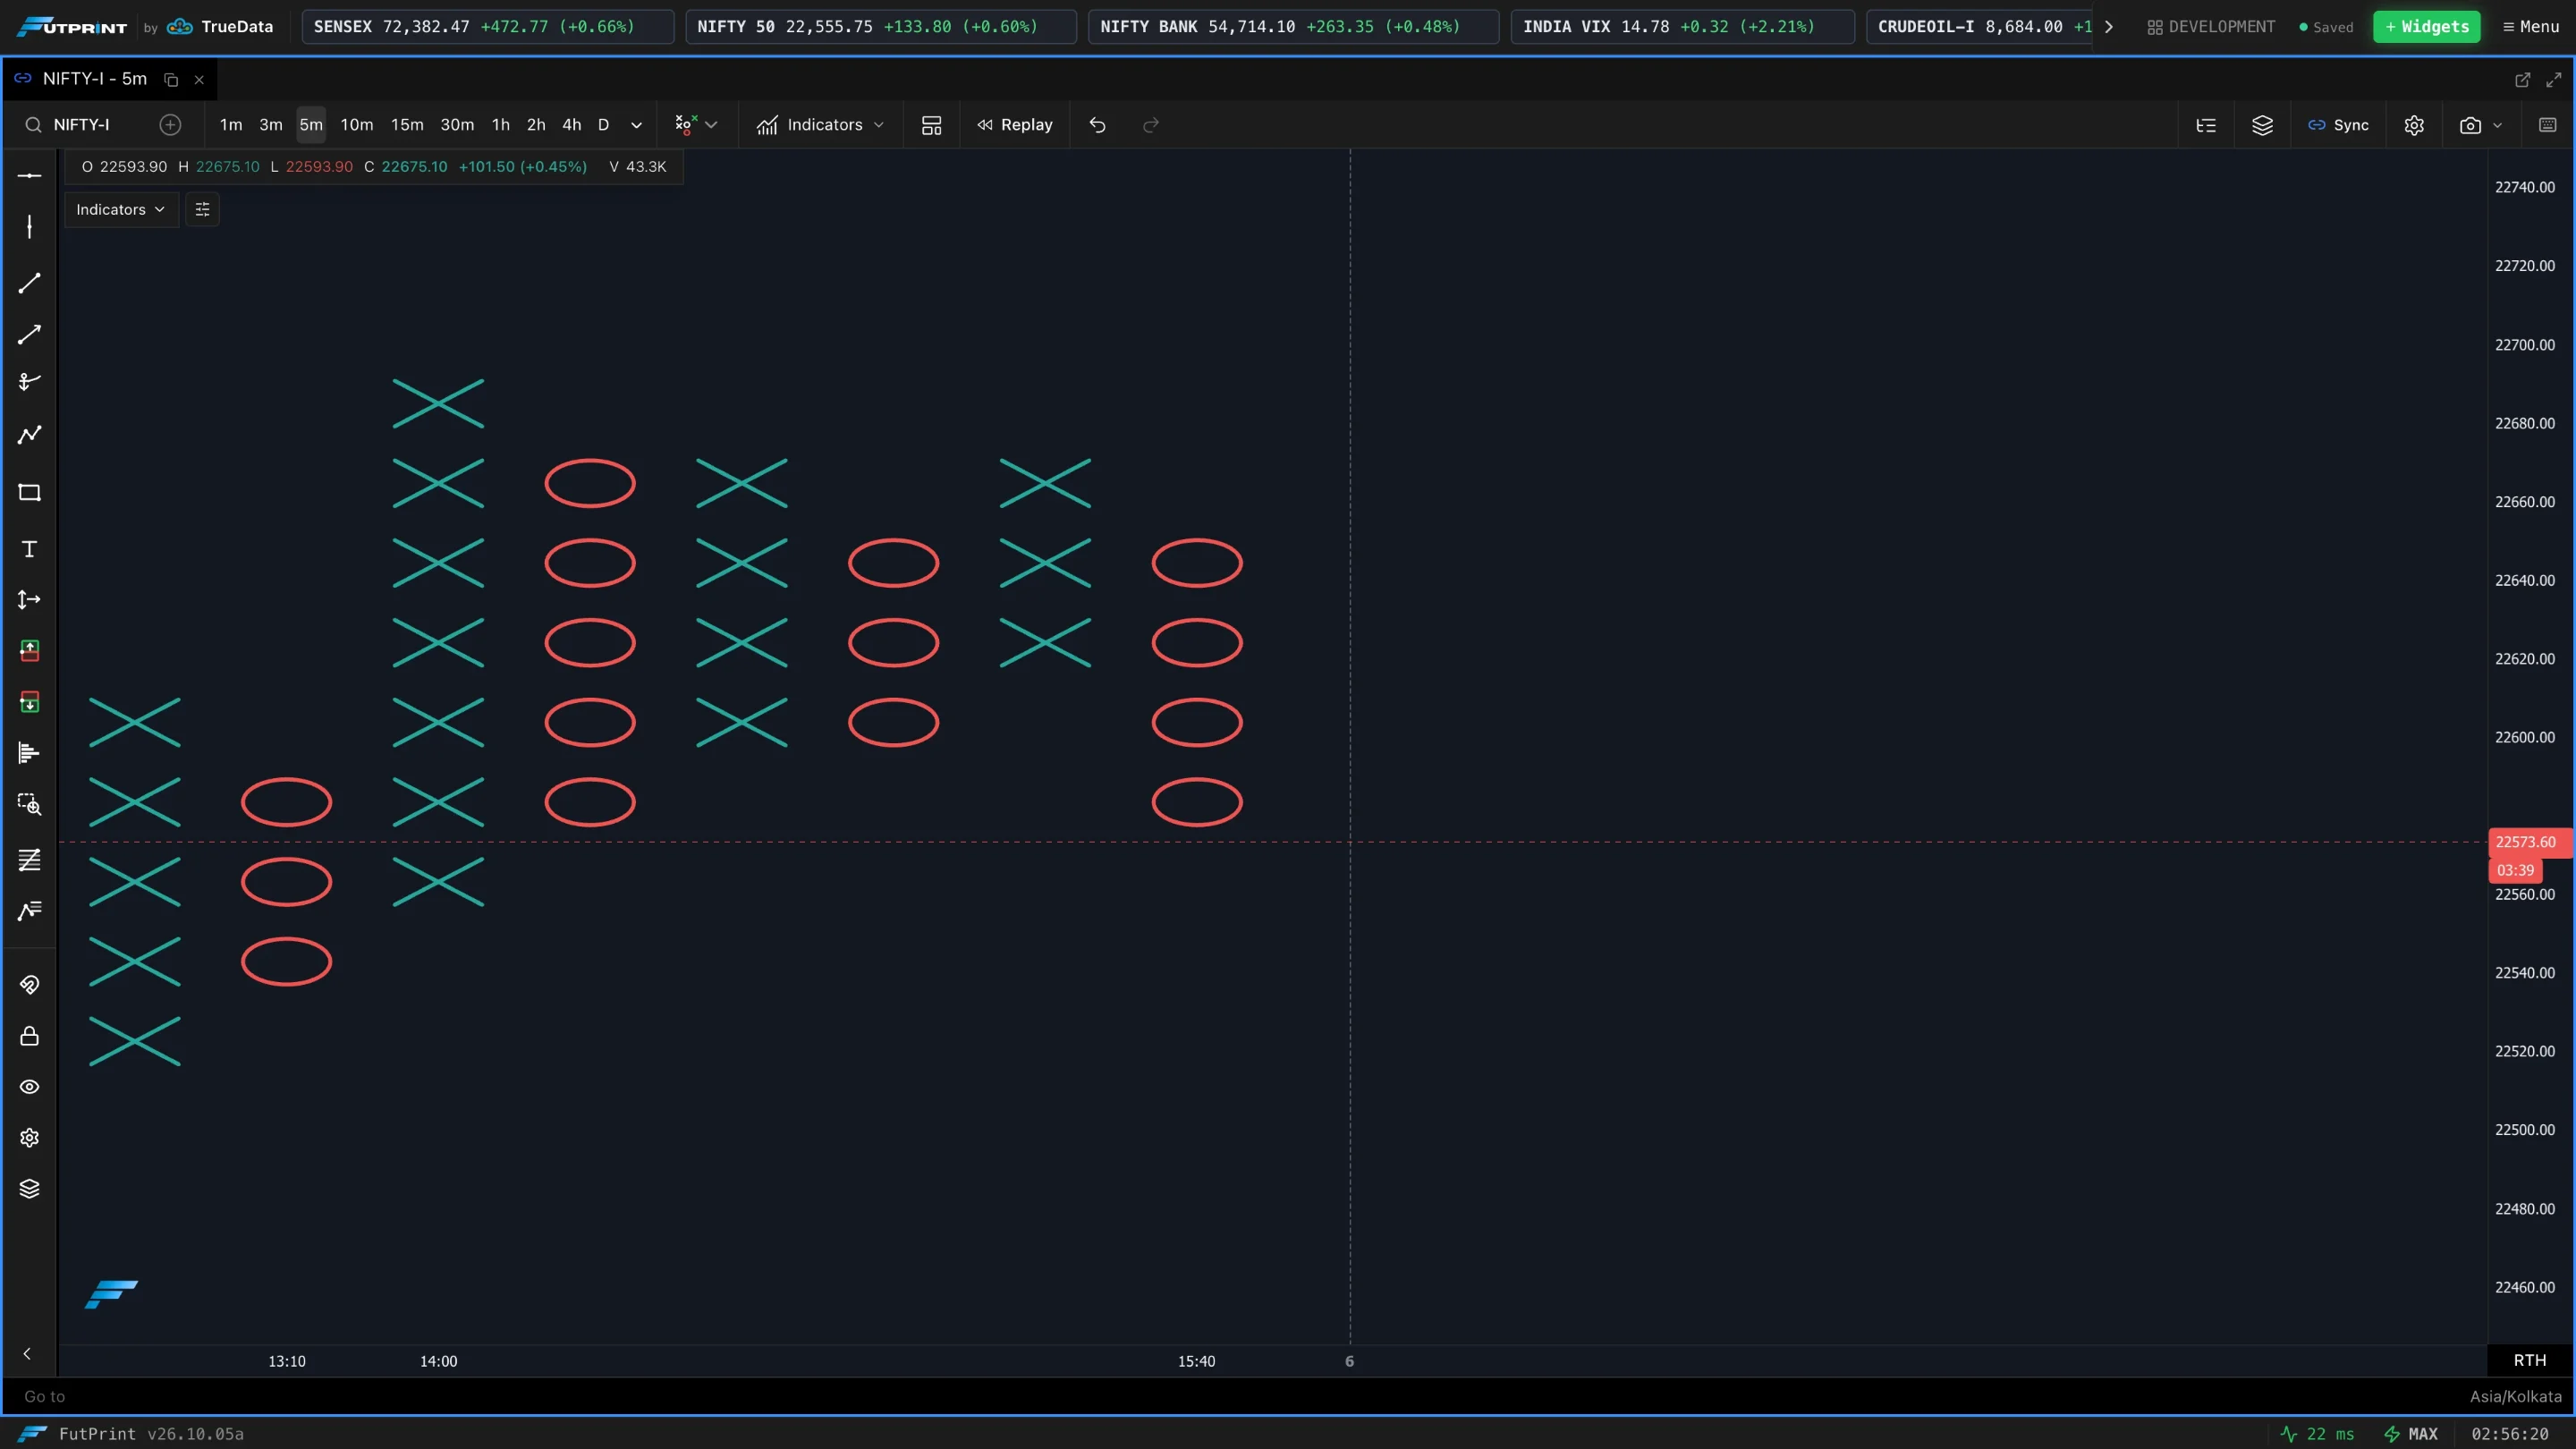
Point & Figure
Columns of X (rising prices) and O (falling prices). A new column starts only when price reverses by a set amount, so the chart shows supply and demand shifts without a time axis.
Kagi
A single line that thickens or thins as price breaks prior highs and lows, changing direction only on a set reversal.
Order-flow & profile modes
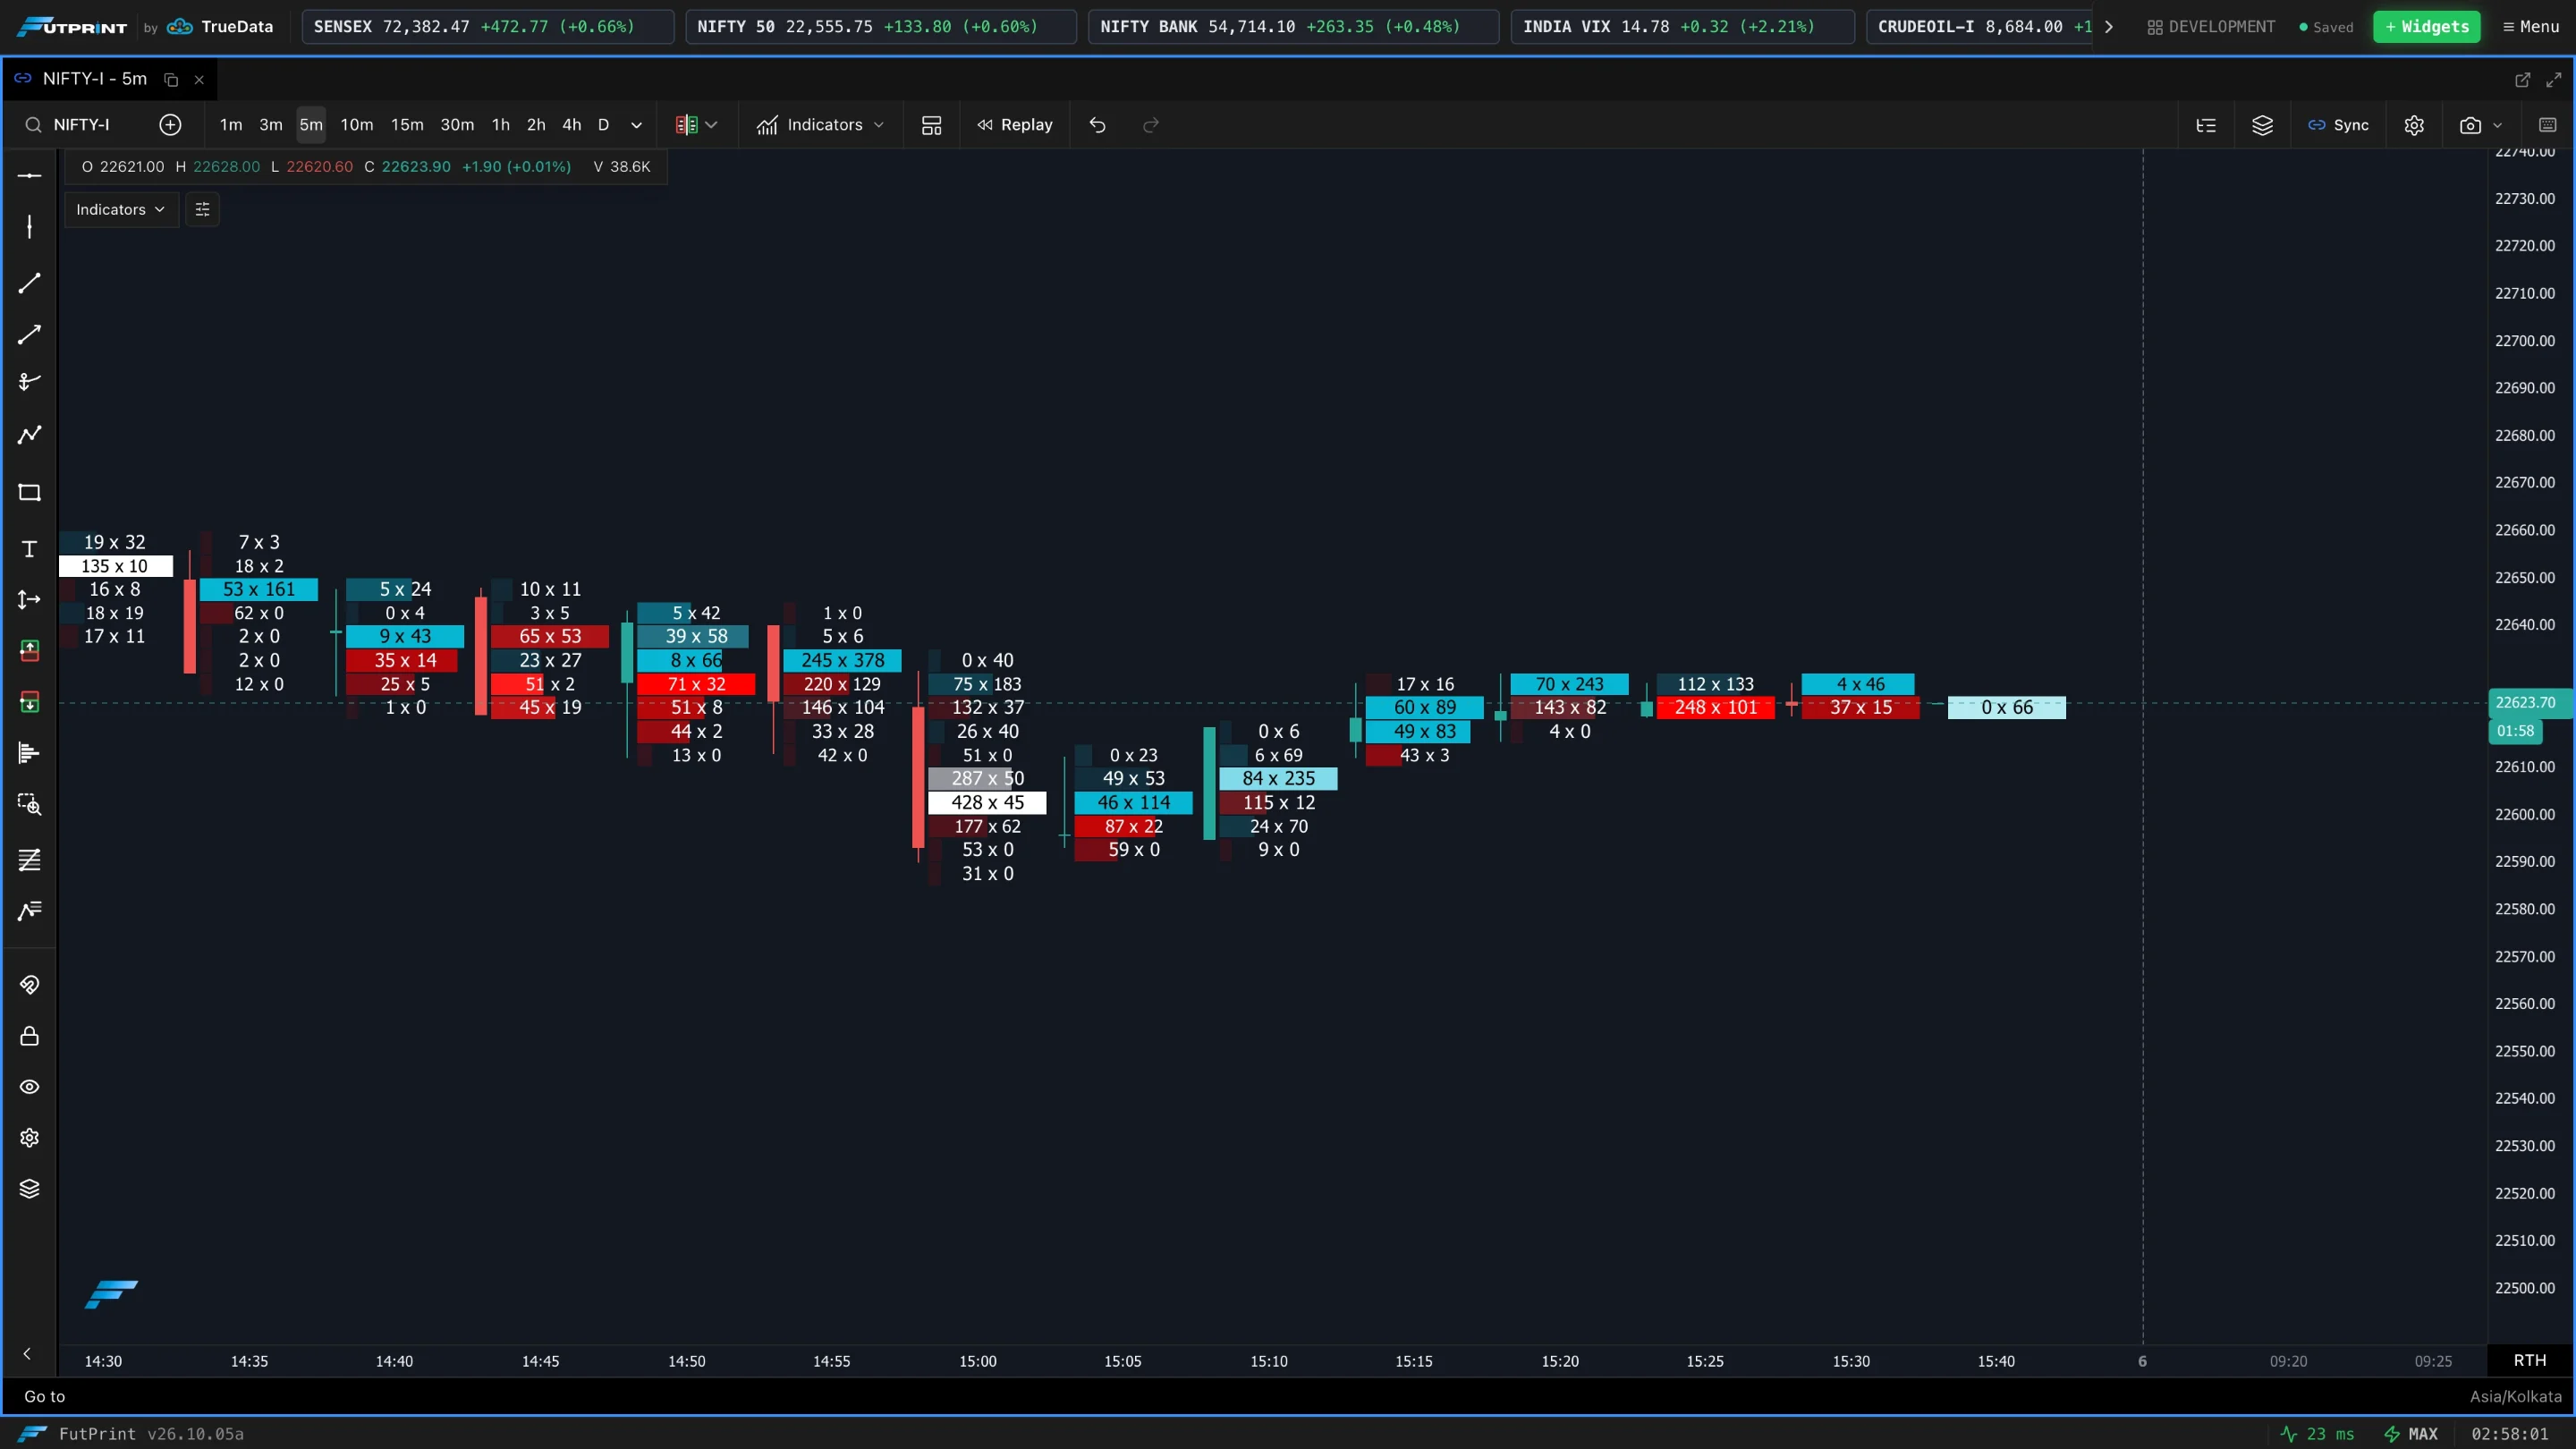
Orderflow (Footprint)
A volume footprint: each bar is broken into price levels showing the bid vs ask volume traded there. Reveals where buyers and sellers were active inside the bar — absorption, imbalances and point-of-control. The most detailed, microstructure-level view.
See Footprint / Cluster Settings for every option.
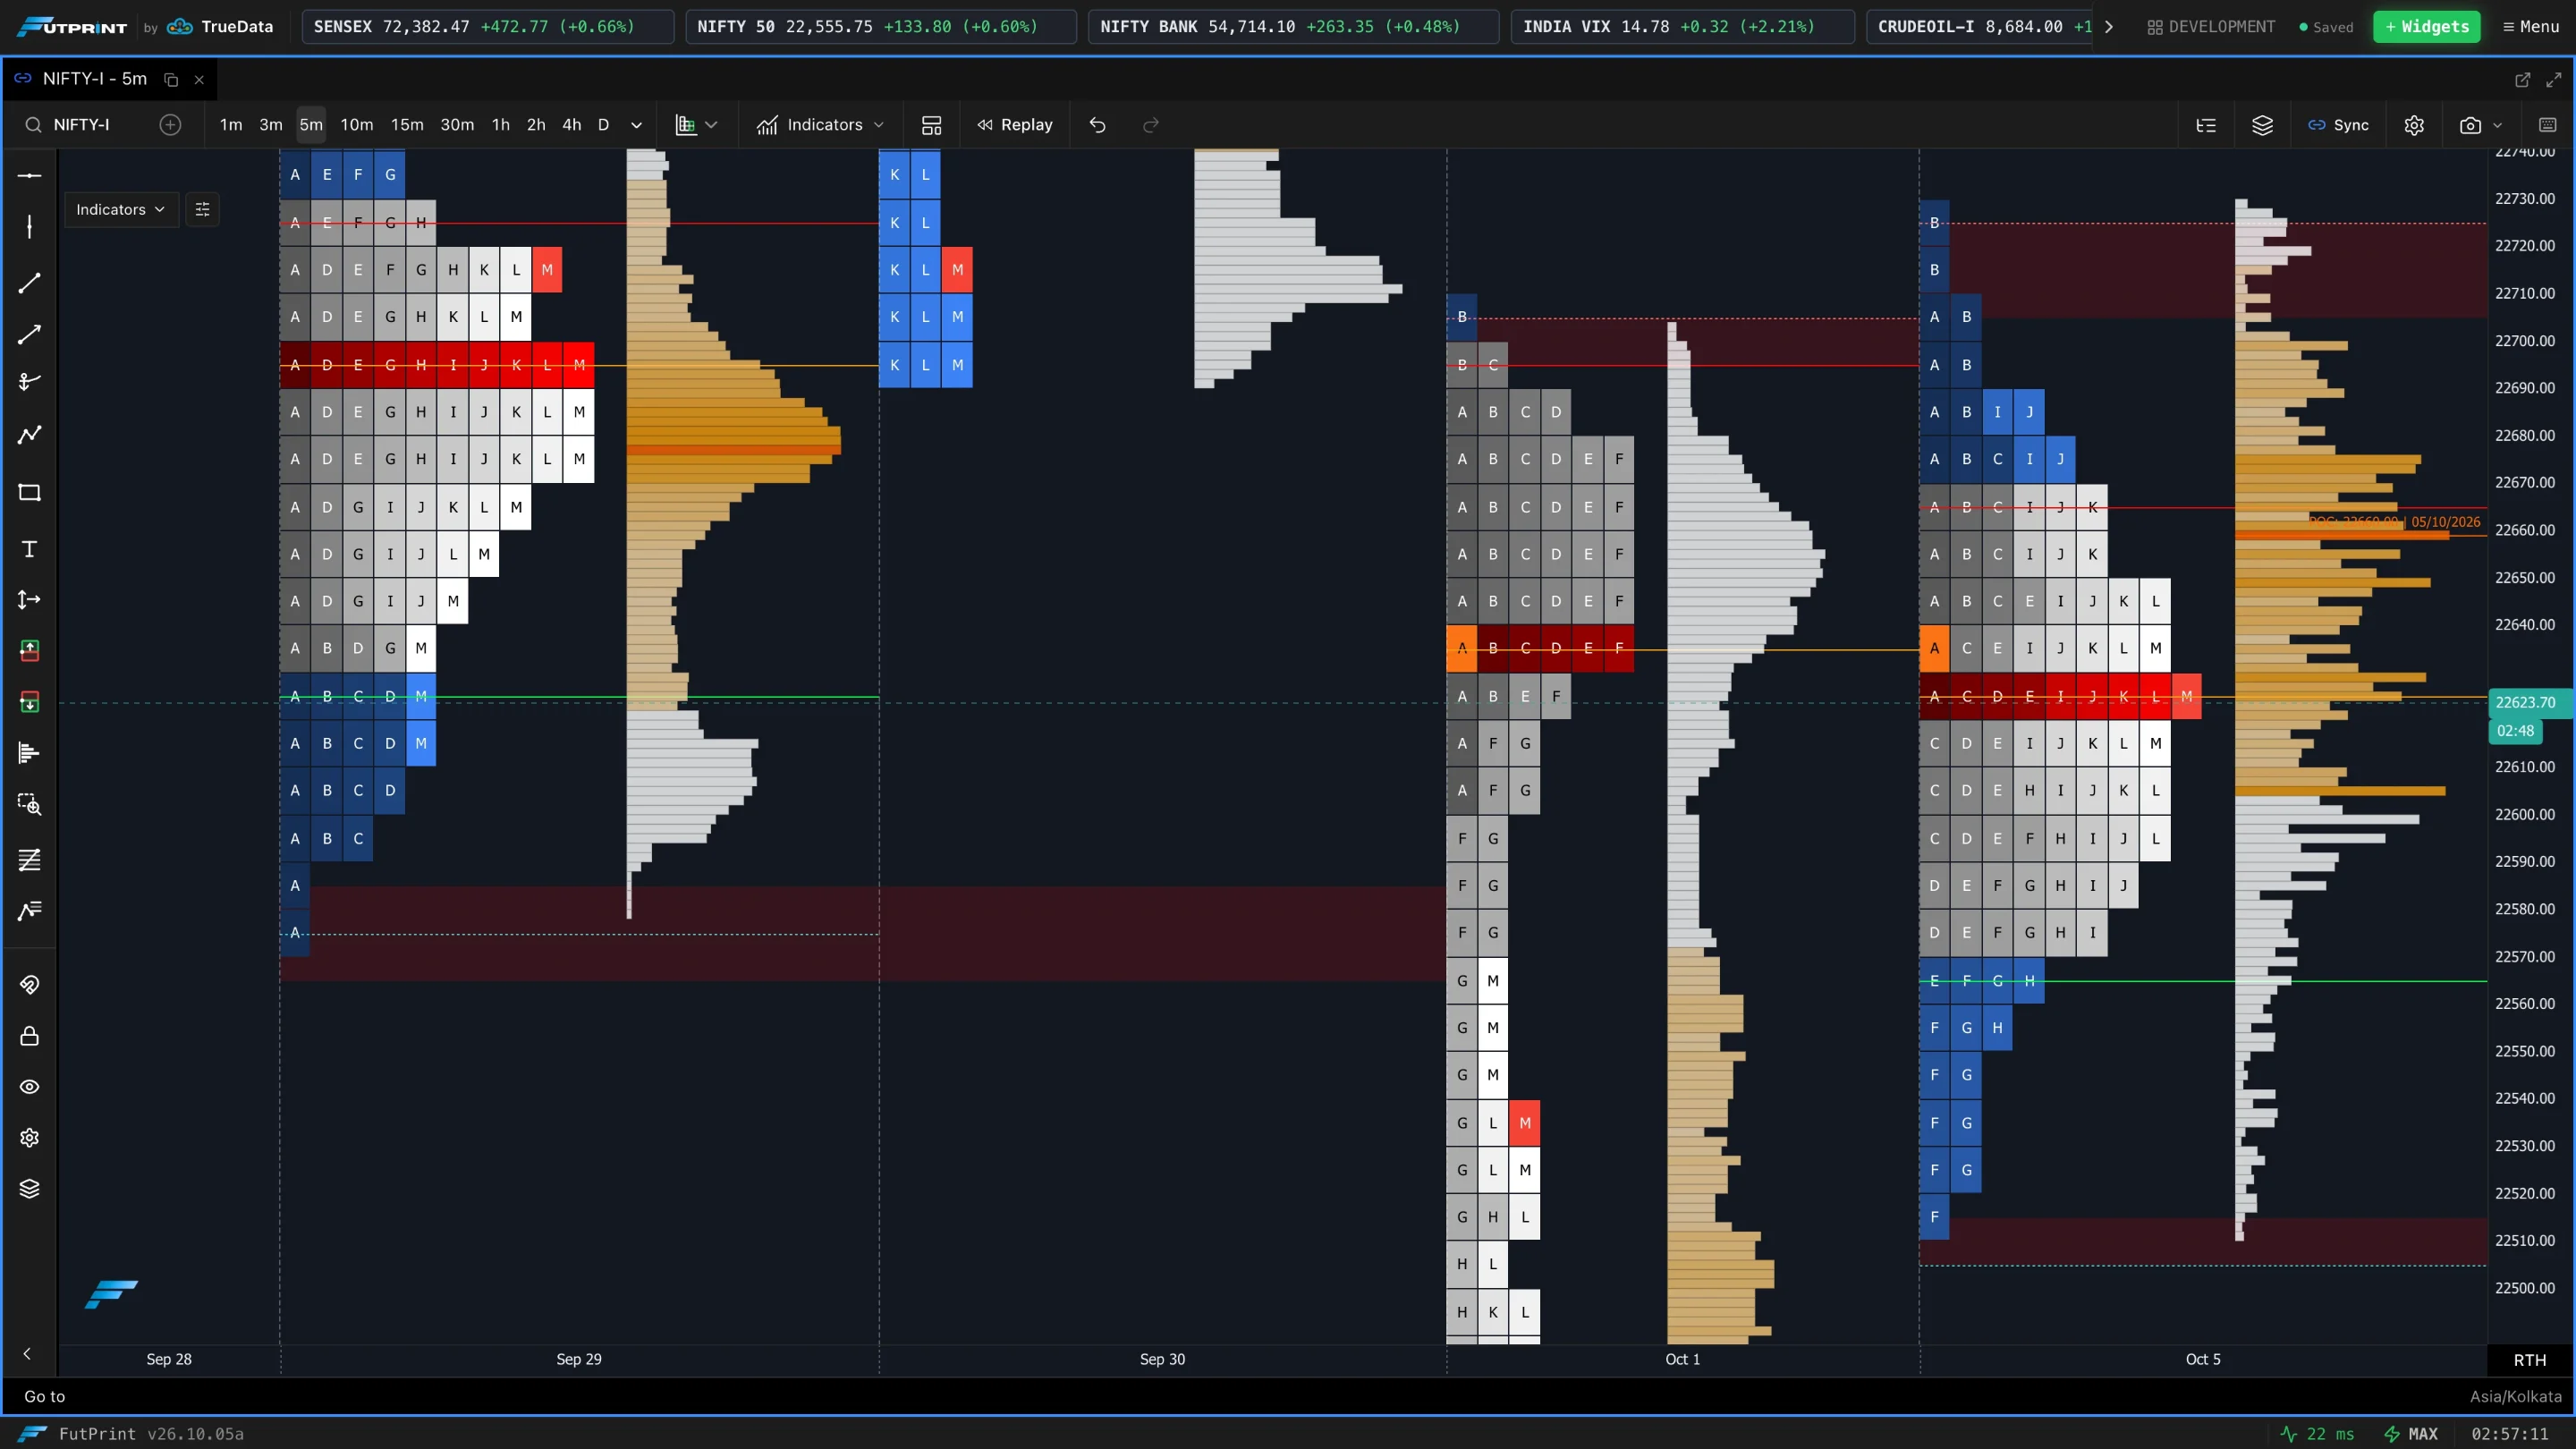
TPO (Market / Time-Price-Opportunity Profile)
Builds a profile of how much time price spent at each level, drawn as a distribution. Highlights value areas and the levels the market keeps returning to.
See TPO Profile Settings for every option.
Footprint (Clusters) and TPO are richest on liquid instruments and shorter timeframes, where there's enough trade detail to populate each price level.
Tick-based modes
These build bars from trades, not the clock — so they use their own input instead of the timeframe (see Symbol & Timeframes).
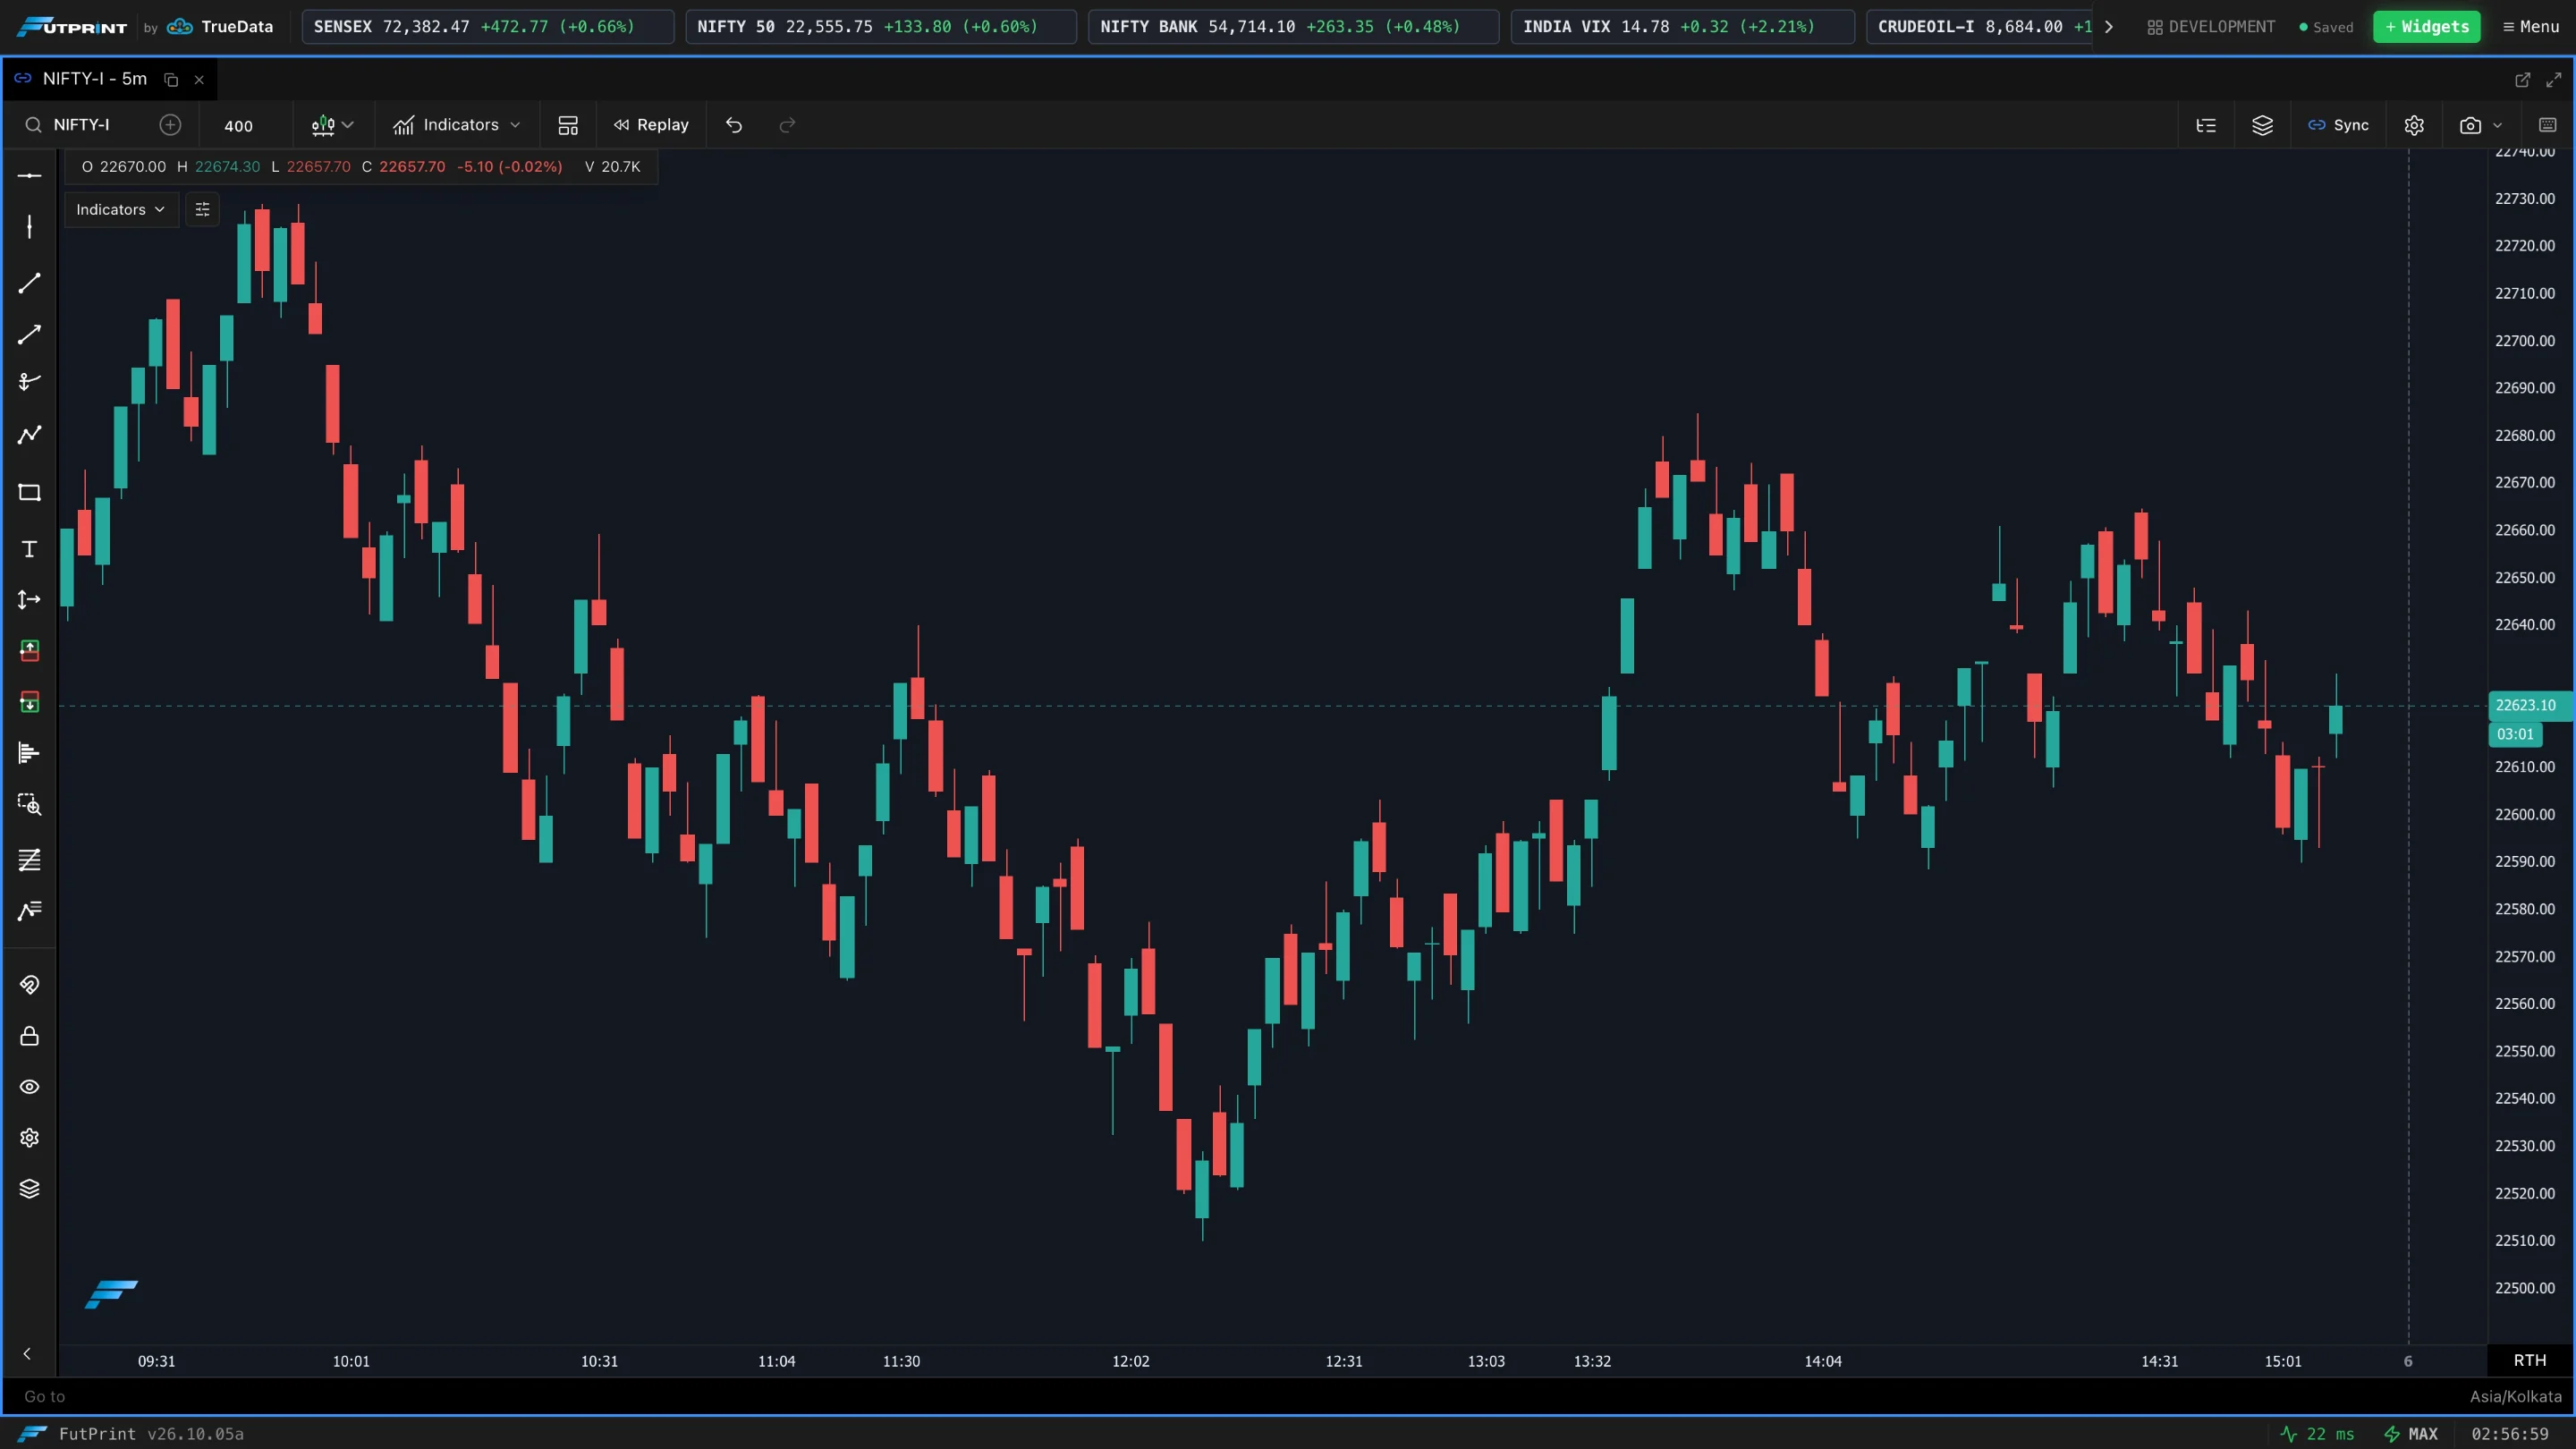
Tick Number
A new bar every N trades (set the Tick Count). Activity controls bar speed: busy periods print many bars, quiet periods few.
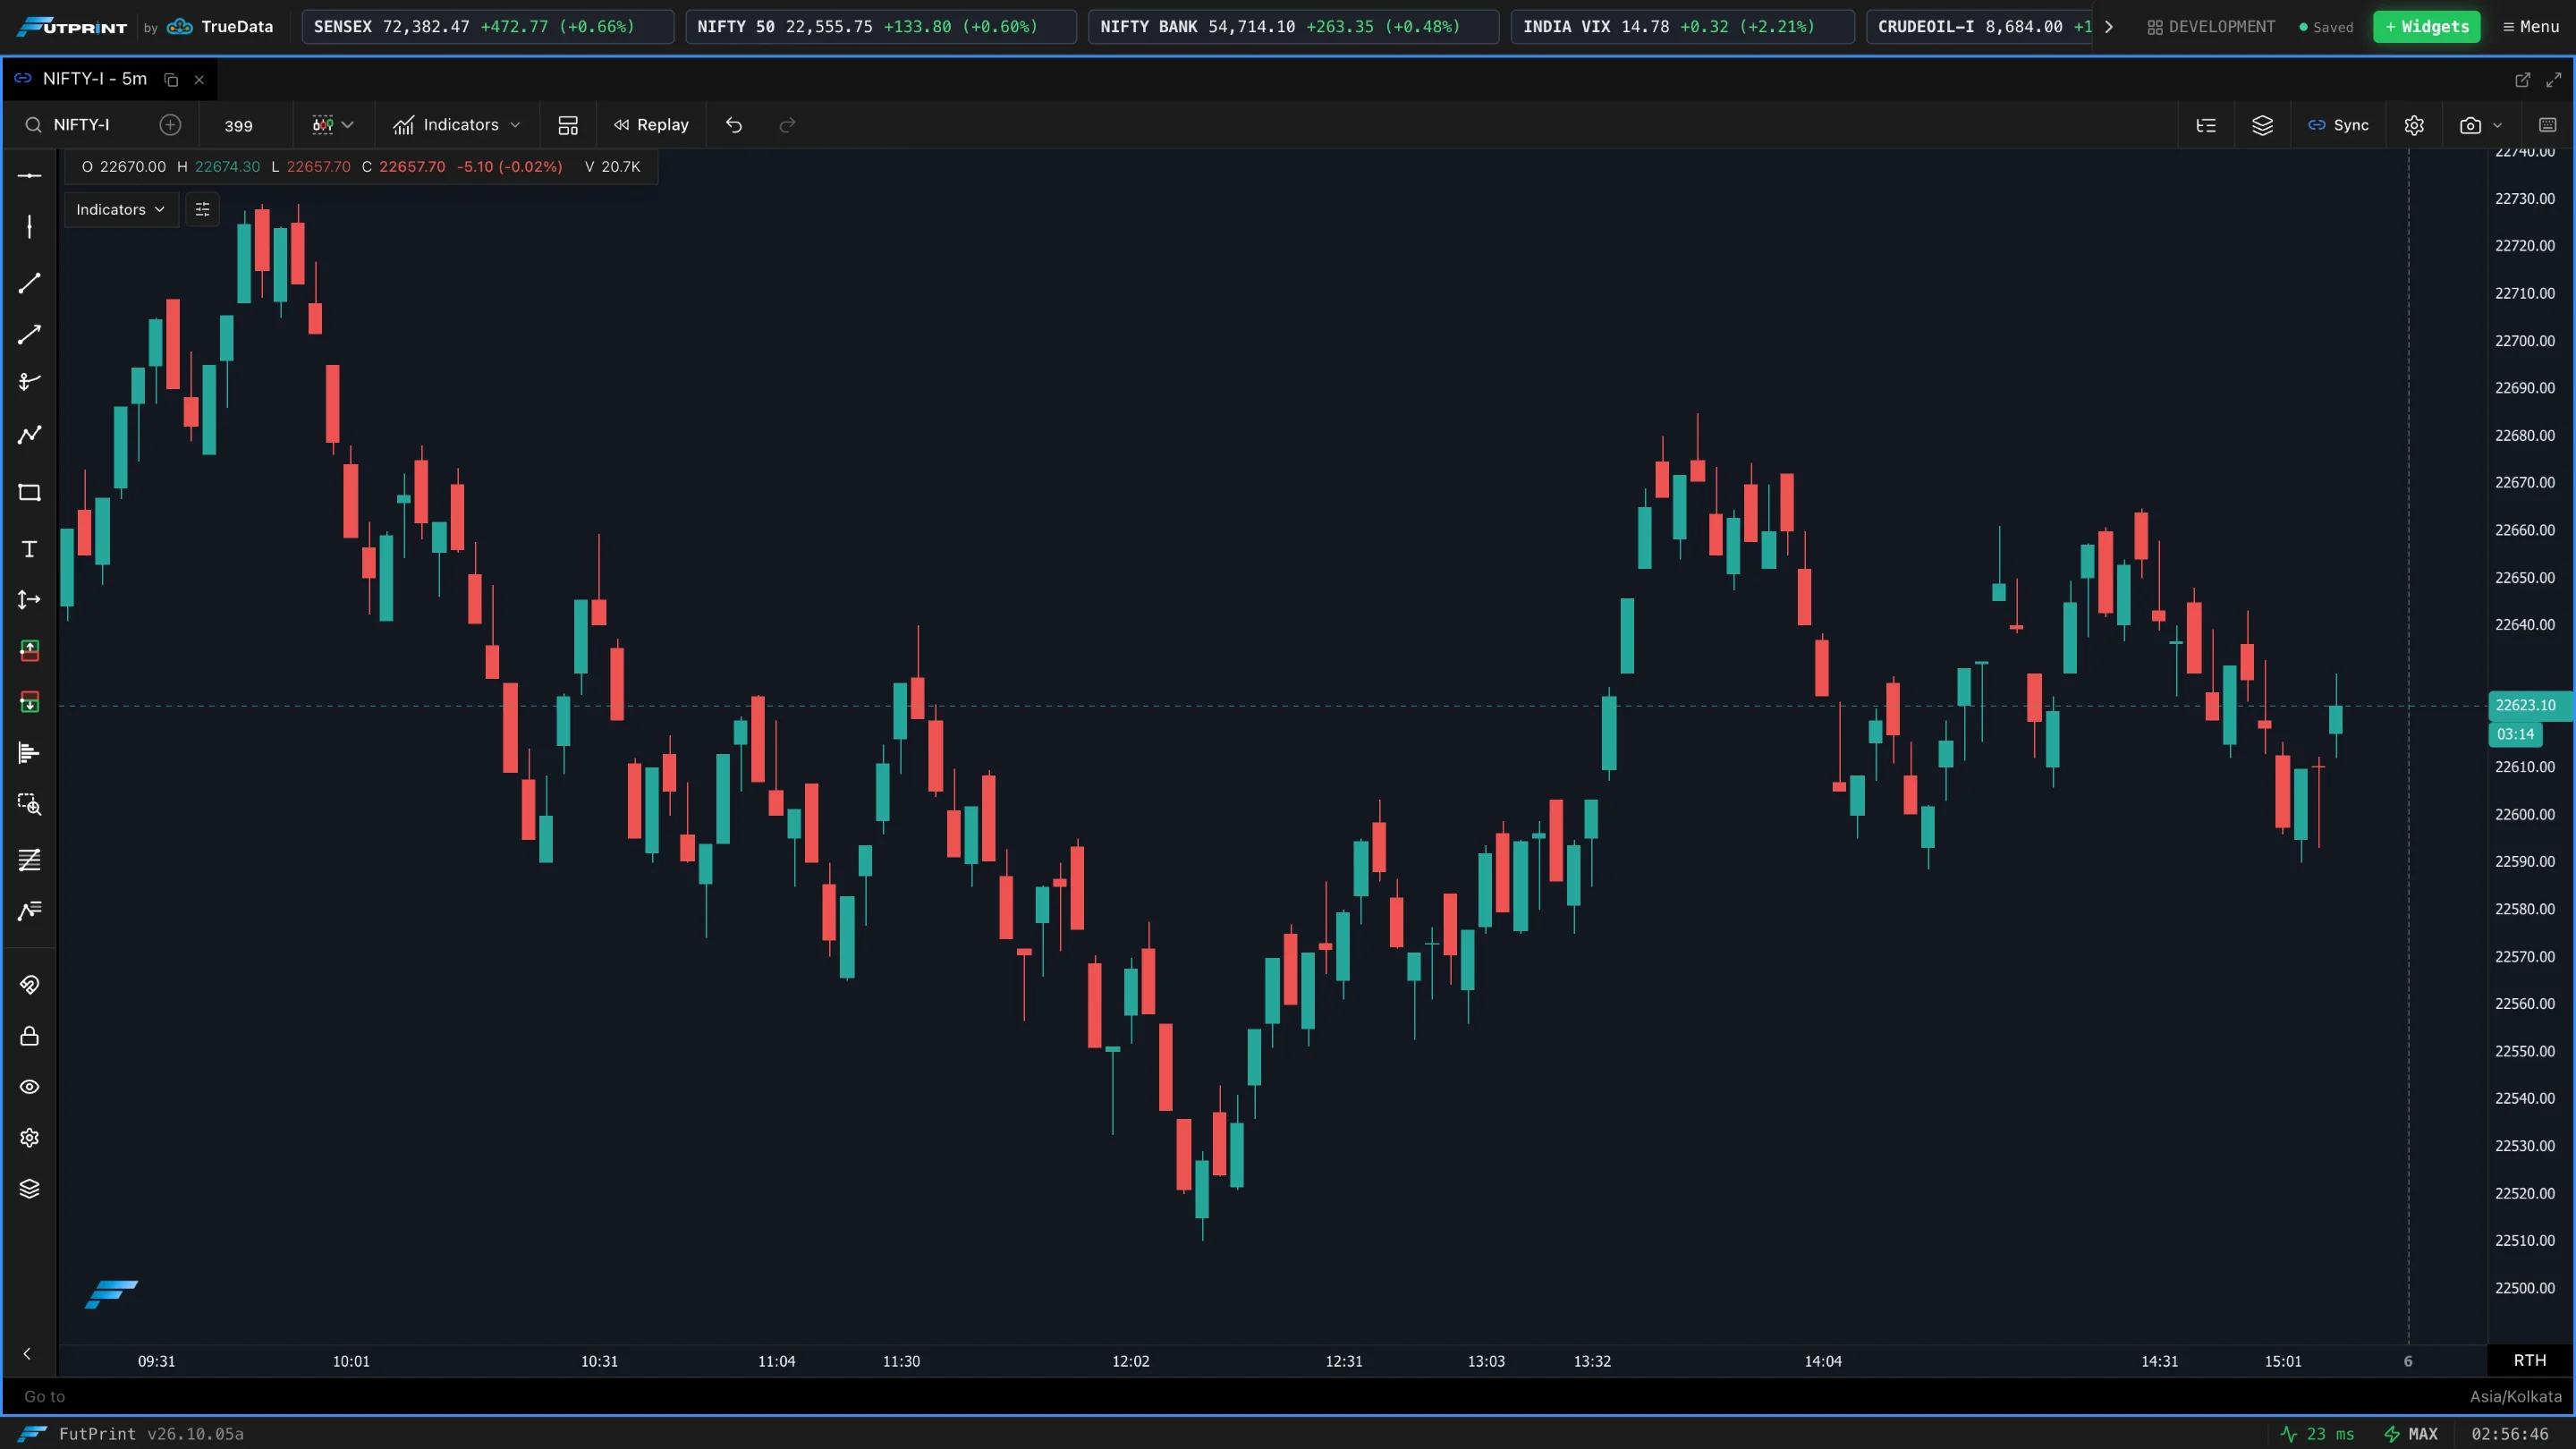
Tick Range
A new bar each time price travels a set range. Filters out chop and frames genuine directional moves.
Choosing a mode
| If you want to… | Use |
|---|---|
| Read price action generally | Candlesticks / OHLC |
| See the clean trend | Line / Area / Heiken Ashi |
| Study who's trading where inside the bar | Clusters (Footprint) |
| Find value areas and accepted price | TPO |
| Normalise by activity instead of time | Tick Number / Tick Range |
| Filter noise and see pure price movement | Renko / Point & Figure / Kagi |
| Combine trend and momentum in the candle colour | Elder Impulse |
Each mode has its own options under Settings (for example, footprint bin size and colour grading, or TPO profile options) — see Chart Settings.