Option Chain
The Option Chain shows the full set of call (CE) and put (PE) options for an underlying, side by side around the strike ladder, all streaming live. It's built for reading positioning at a glance — open interest, the at-the-money strike, put-call ratio, greeks and IV — and for jumping straight from a contract to its chart or time & sales.
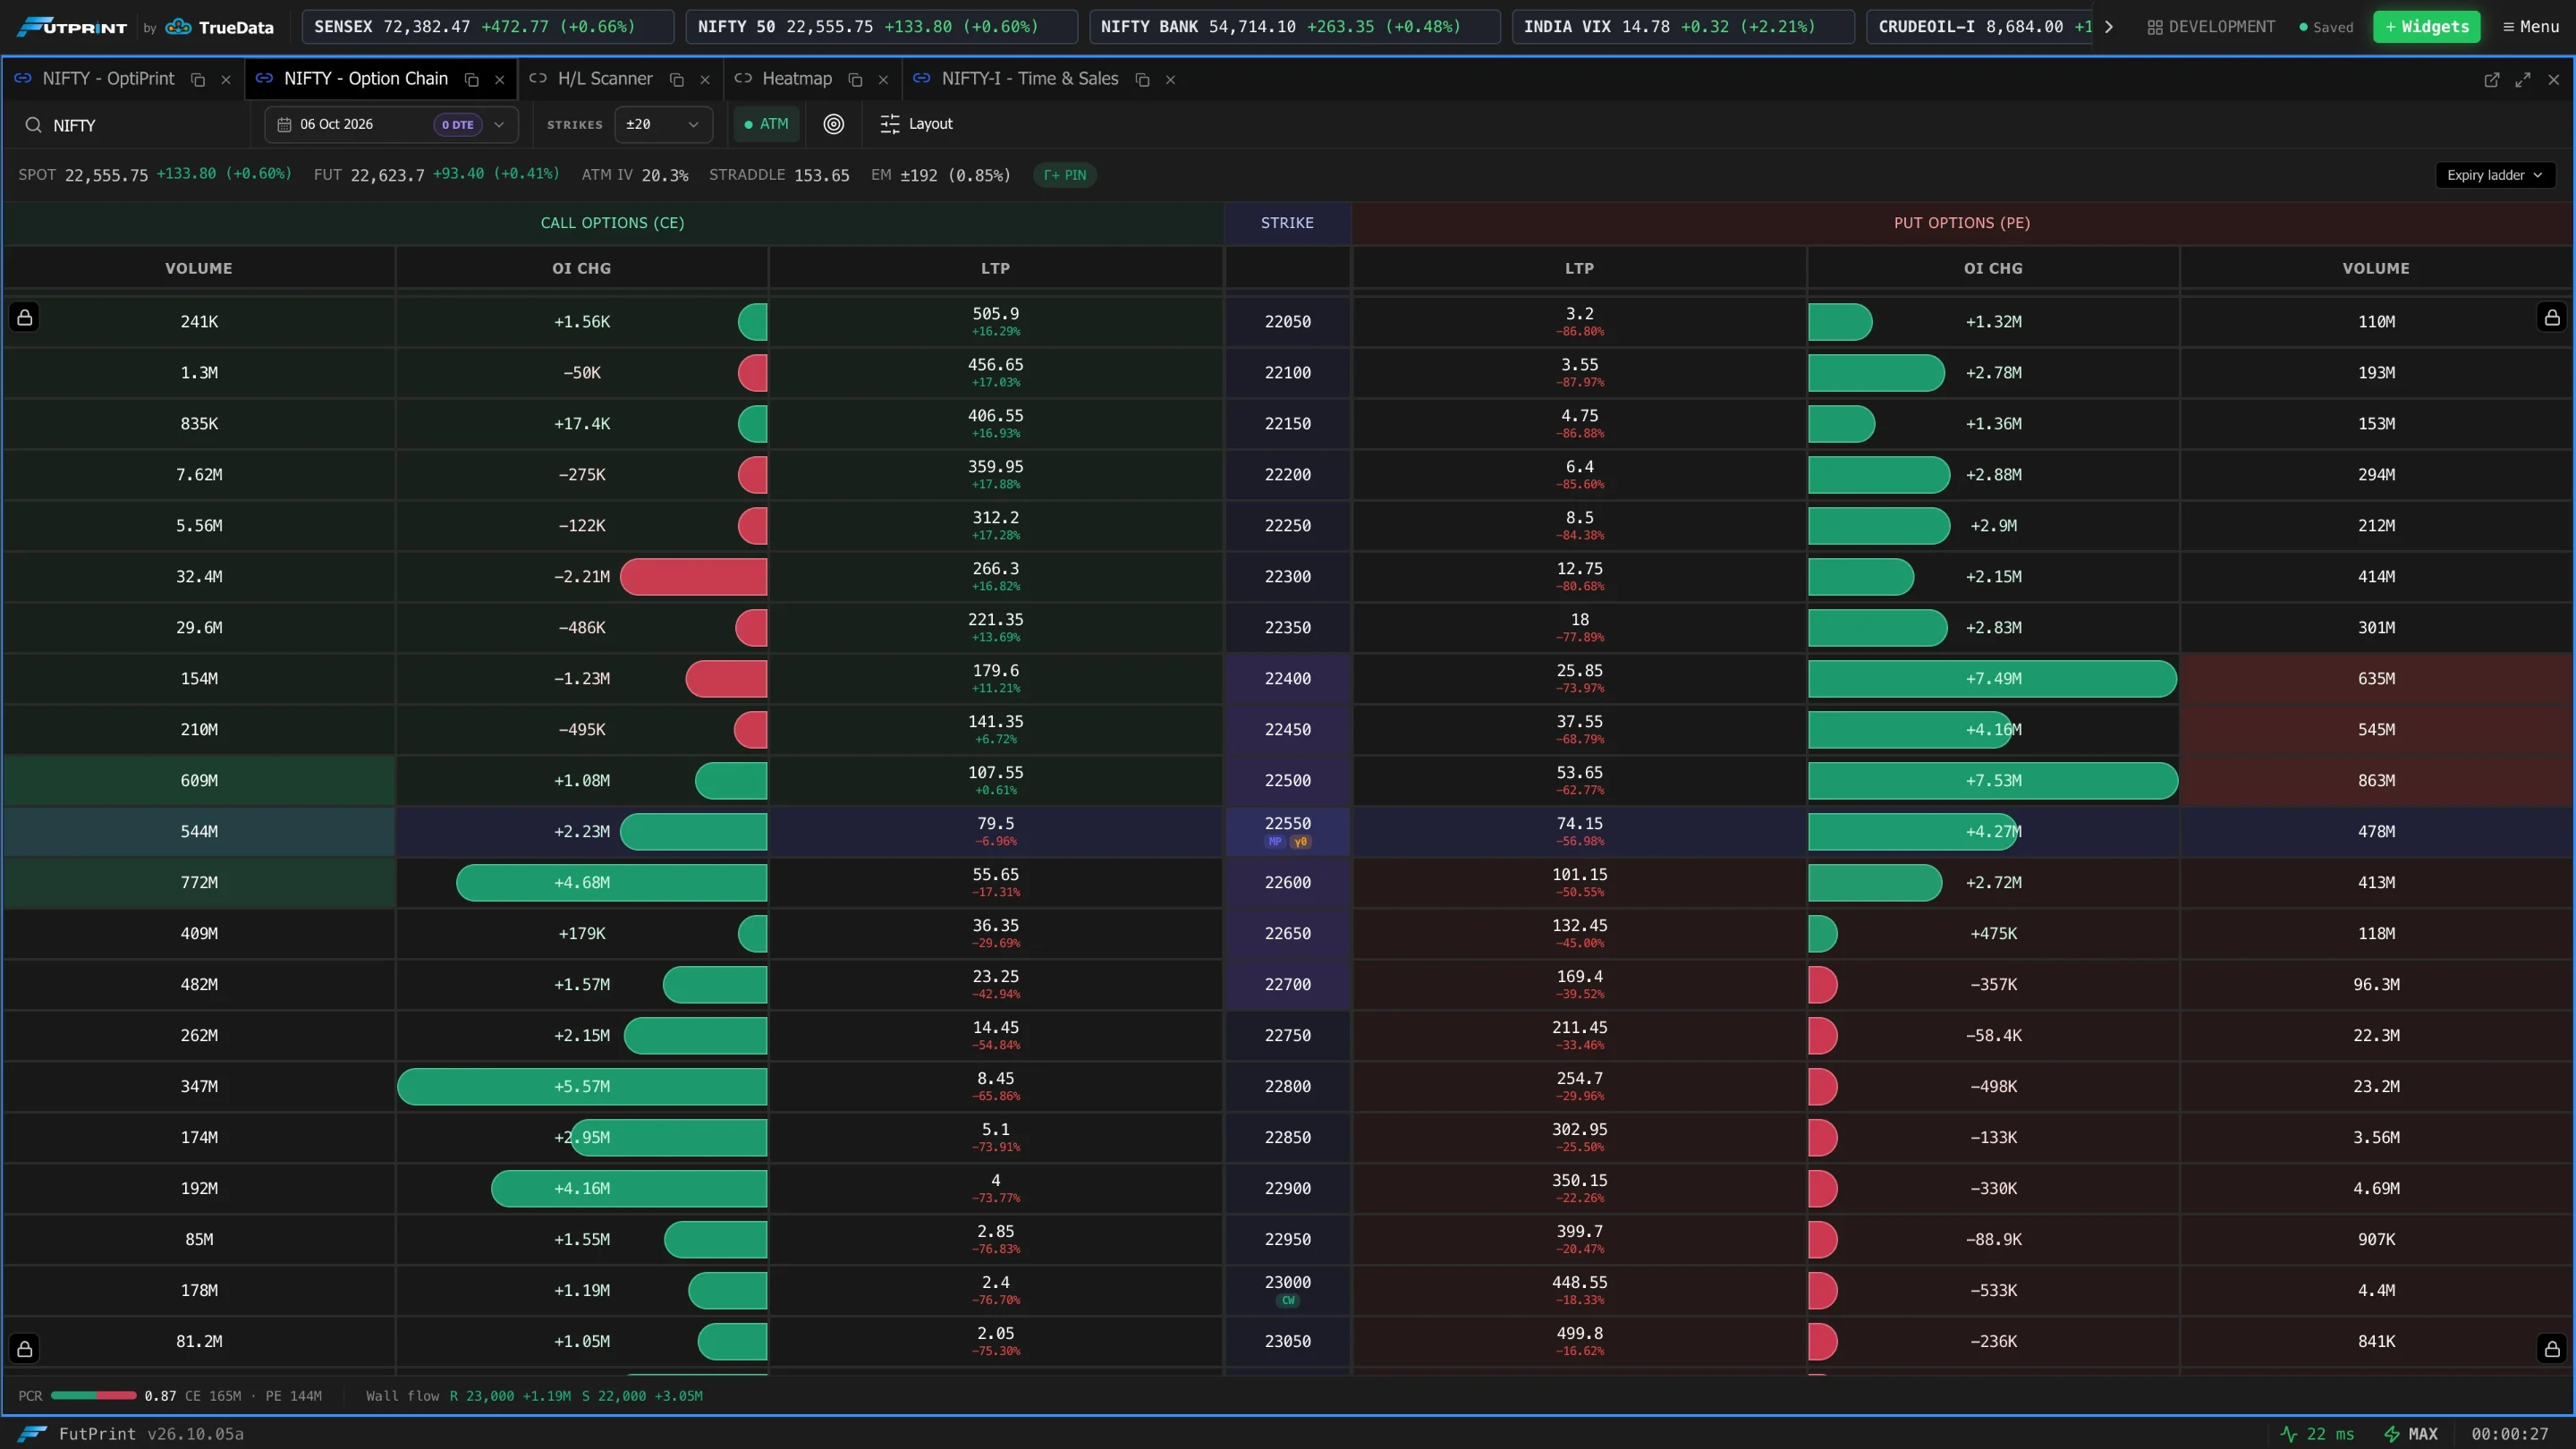
Layout
The panel has three regions that stay aligned as you scroll:
- Call Options (CE) on the left
- the Strike ladder in the centre (highlighted at the ATM strike)
- Put Options (PE) on the right
The CE and PE sides share a single vertical scroll, so the strikes always line up. Each side scrolls horizontally on its own (and mirror each other) when you turn on extra columns like greeks. Scroll arrows appear at the left and right edges; the section and column headers stay pinned at the top.
Loading a chain
- 1Search the underlying
Type 3+ characters in the toolbar's symbol box. Results are limited to underlyings that actually have an option chain — indices and stocks with listed options/futures on NSE, BSE or MCX. Each result shows the name, exchange and type.
- 2Pick an expiry
The Expiry dropdown fills with the available expiries. Each entry shows the full date and a DTE badge (days to expiry, e.g.
+2 DTE,0 DTE). The nearest valid expiry is selected for you. - 3Set the strike range
The ± selector controls how many strikes above and below the money are shown: 3, 5, 7, 10, 15, 20, 50 or 100.

If a futures contract is chosen, FutPrint resolves it to its underlying (e.g.
BANKNIFTY futures → BANKNIFTY) so the chain, spot and futures line up.
The spot & futures bar
Once a chain loads, a strip under the toolbar shows the live Spot and Fut prices with their change and percent, each with a pulsing "live" dot. If the underlying has more than one futures expiry, a small selector lets you switch which future is referenced. These prices drive the ATM calculation.

The ATM strike
The at-the-money strike is the strike closest to the current spot/future price. It's highlighted in the strike column and used as the anchor for the strike range. Two controls help you keep it in view:
- ATM toggle — when on, the chain auto-centres the ATM row and keeps it centred as prices move (vertical scrolling is locked; the edge arrows show a lock icon).
- Target button — centre the ATM row once, without locking.
/help-assets/option-chain/atm-autocenter.mp4Rows are shaded by moneyness: in-the-money calls (strikes below ATM) and in-the-money puts (strikes above ATM) are tinted so the ITM/OTM split is obvious.
Columns
Open the column selector (sliders icon) to turn columns on or off. Each toggle controls the column on both sides; if only one side is on it shows as partially-checked. Reset Default restores the standard set (OI, LTP, Analysis, Volume).
| Column | Meaning |
|---|---|
| OI (Hist) | Open interest, with a bar whose length is relative to the largest OI on that side — green on the CE side, red on the PE side. The biggest bars mark the strikes with the most written/held contracts (support/resistance walls). |
| LTP | Last traded price of the option, with its change % underneath. |
| Analysis | A one-tag read of price + OI behaviour (see below). |
| Volume | Contracts traded. The top 3 volume strikes on each side are highlighted. |
| IV | Implied volatility, as a percentage. |
| Δ Delta · Θ Theta · Γ Gamma · ν Vega · ρ Rho | The option greeks (four decimals). |
The Analysis tag
The Analysis column summarises what price and open interest are doing together — the classic build-up read:
| Tag | Meaning | Price | Open Interest |
|---|---|---|---|
| LB | Long Build-up | Up | Up |
| SC | Short Covering | Up | Down |
| SB | Short Build-up | Down | Up |
| LU | Long Unwinding | Down | Down |
The Put-Call Ratio bar
Whenever a chain is loaded, a PCR bar shows the balance of total put OI versus total call OI:
- a proportional bar (green = call OI share, red = put OI share),
- the PCR number (total PE OI ÷ total CE OI),
- the total CE and PE OI (in lakhs,
L).
A high PCR (lots of puts relative to calls) and a low PCR read very differently to options traders; the value is colour-coded to flag the extremes.
Working from a contract
Every CE/PE cell is interactive:
- Click a cell to open that exact contract's chart.
- Hover the LTP cell for quick buttons: open Chart, add to a Watchlist, or open Time & Sales for the contract.
- Right-click a row for the same actions in a menu.
- Click a strike in the centre column to open the underlying's chart.
/help-assets/option-chain/cell-actions.mp4When you add a contract to a watchlist, you can drop it into an existing watchlist or spin up a new one for it.
OI analysis
The Chain / Split / Analysis switch in the toolbar opens the multi-strike OI analysis. Split keeps the chain above the analysis pane, with the chain as the strike selector, so there is nothing to load twice. Analysis gives the pane the whole panel and hides the chain; a Strikes menu takes over leg picking, and Show chain returns to the split layout.
- 1Pick strikes
In Split mode every CE and PE row gains a + toggle at its outer edge, and the strike cell gains a small pair button that adds or removes both legs at once. Selected rows are tinted green (calls) or red (puts). In Analysis mode the Strikes menu lists the same strikes with a call and a put toggle each, opens on the ATM strike, and clicking a strike selects both legs. Each selection appears as a chip in the pane; click its × to remove it, or Clear all.
- 2Or pick a range
Range — From / To selects every strike between two strikes and aggregates them into one CE and one PE series. Clear returns to per-strike selection. Rows inside the range are tinted violet.
- 3Size the pane
Drag the divider between the chain and the pane to resize it, or drag it all the way up to hide the chain and switch to Analysis mode. Double-click it to reset.
The pane's toolbar also carries the session (RTH 9:15–15:30 IST, or ETH for the extended session), the bar window (Today for minute bars, or 3 / 5 / 10 days of 5- or 15-minute bars with the overnight gaps collapsed on the time axis, so OI build-up across sessions reads as one line; OI change is measured from the first bar of the window), Dual / Multi colors (colour each call/put pair consistently, or give every contract its own colour), auto-refresh (every 60 seconds while on), Force refresh with the time of the last refresh, and the expiry's total Call OI, Put OI, PCR and Max pain.
The Timeline slider scrubs the session; Reset returns to the whole day.
| Tab | Shows |
|---|---|
| Overview | A bar chart per selected strike: base OI and the increase or decrease for the call and put. |
| Price | Each selected contract's price through the session. |
| Volume | Traded volume per interval for each contract. |
| Open Interest | Each contract's open interest through the session. |
| OI Change | The change in open interest since the session start. |
Rising OI with a rising option price suggests buyers are opening positions; rising OI with a falling price suggests writers are. Compare the call and put of the same strike to see which side is being defended.
Workspaces saved with the old Multi-Strike OI Analysis panel reopen as an Option Chain with the analysis pane open and the same strikes selected.
States you'll see
- Select Symbol — no underlying chosen yet; use the search box.
- Loading Chain — fetching the live option data.
- No Option Data — the chosen expiry has no options (try another expiry).
Expiry-eve strangle
From 15:00 IST on the last session before a weekly index expiry, an Expiry eve pill appears in the market-context strip. It carries the one option rule that survived FutPrint's 2019–2026 backtests: at 15:20, sell the call one straddle-price above the money and the put one below, and let both expire the next day. The card lists the legs with their last prices, the credit a lot after charges, the range the index must close in for the credit to be kept, the break-evens and the most the position can lose. Wings ×3 buys protection three straddle-prices out, which caps the loss and roughly halves the average take; None shows the uncovered version. The strikes are tagged SC / SP (sell) and HC / HP (hedge) in the chain. If another expiry is shown, the card offers to switch.
The rule is paid for carrying overnight gap risk. The uncovered version averaged about +₹850 a NIFTY lot and was profitable in seven of eight years, but lost ₹90,940 a lot on 12 March 2020. Nothing in the card places an order.
What's saved
The underlying, selected expiry, strike range, the chosen spot/futures, the Chain / Split / Analysis view, and the analysis selection, range, tab, session, colour mode and pane size are all stored with your workspace, so the chain reopens exactly as you left it.
Leave the defaults on (OI, LTP, Analysis, Volume), turn on ATM auto-centre, and widen the ± range on expiry day. The OI bars show the walls, the Analysis tags show who's building or covering, and PCR frames the overall sentiment — all without scrolling.