Indicator — Volume Profile
Volume Profile draws a histogram of how much traded at each price over a period — a day, a week, a month or a range you choose. It shows where the market did most of its business (the point of control and value area) and where it moved through quickly (low-volume nodes), which price-and-time charts cannot.
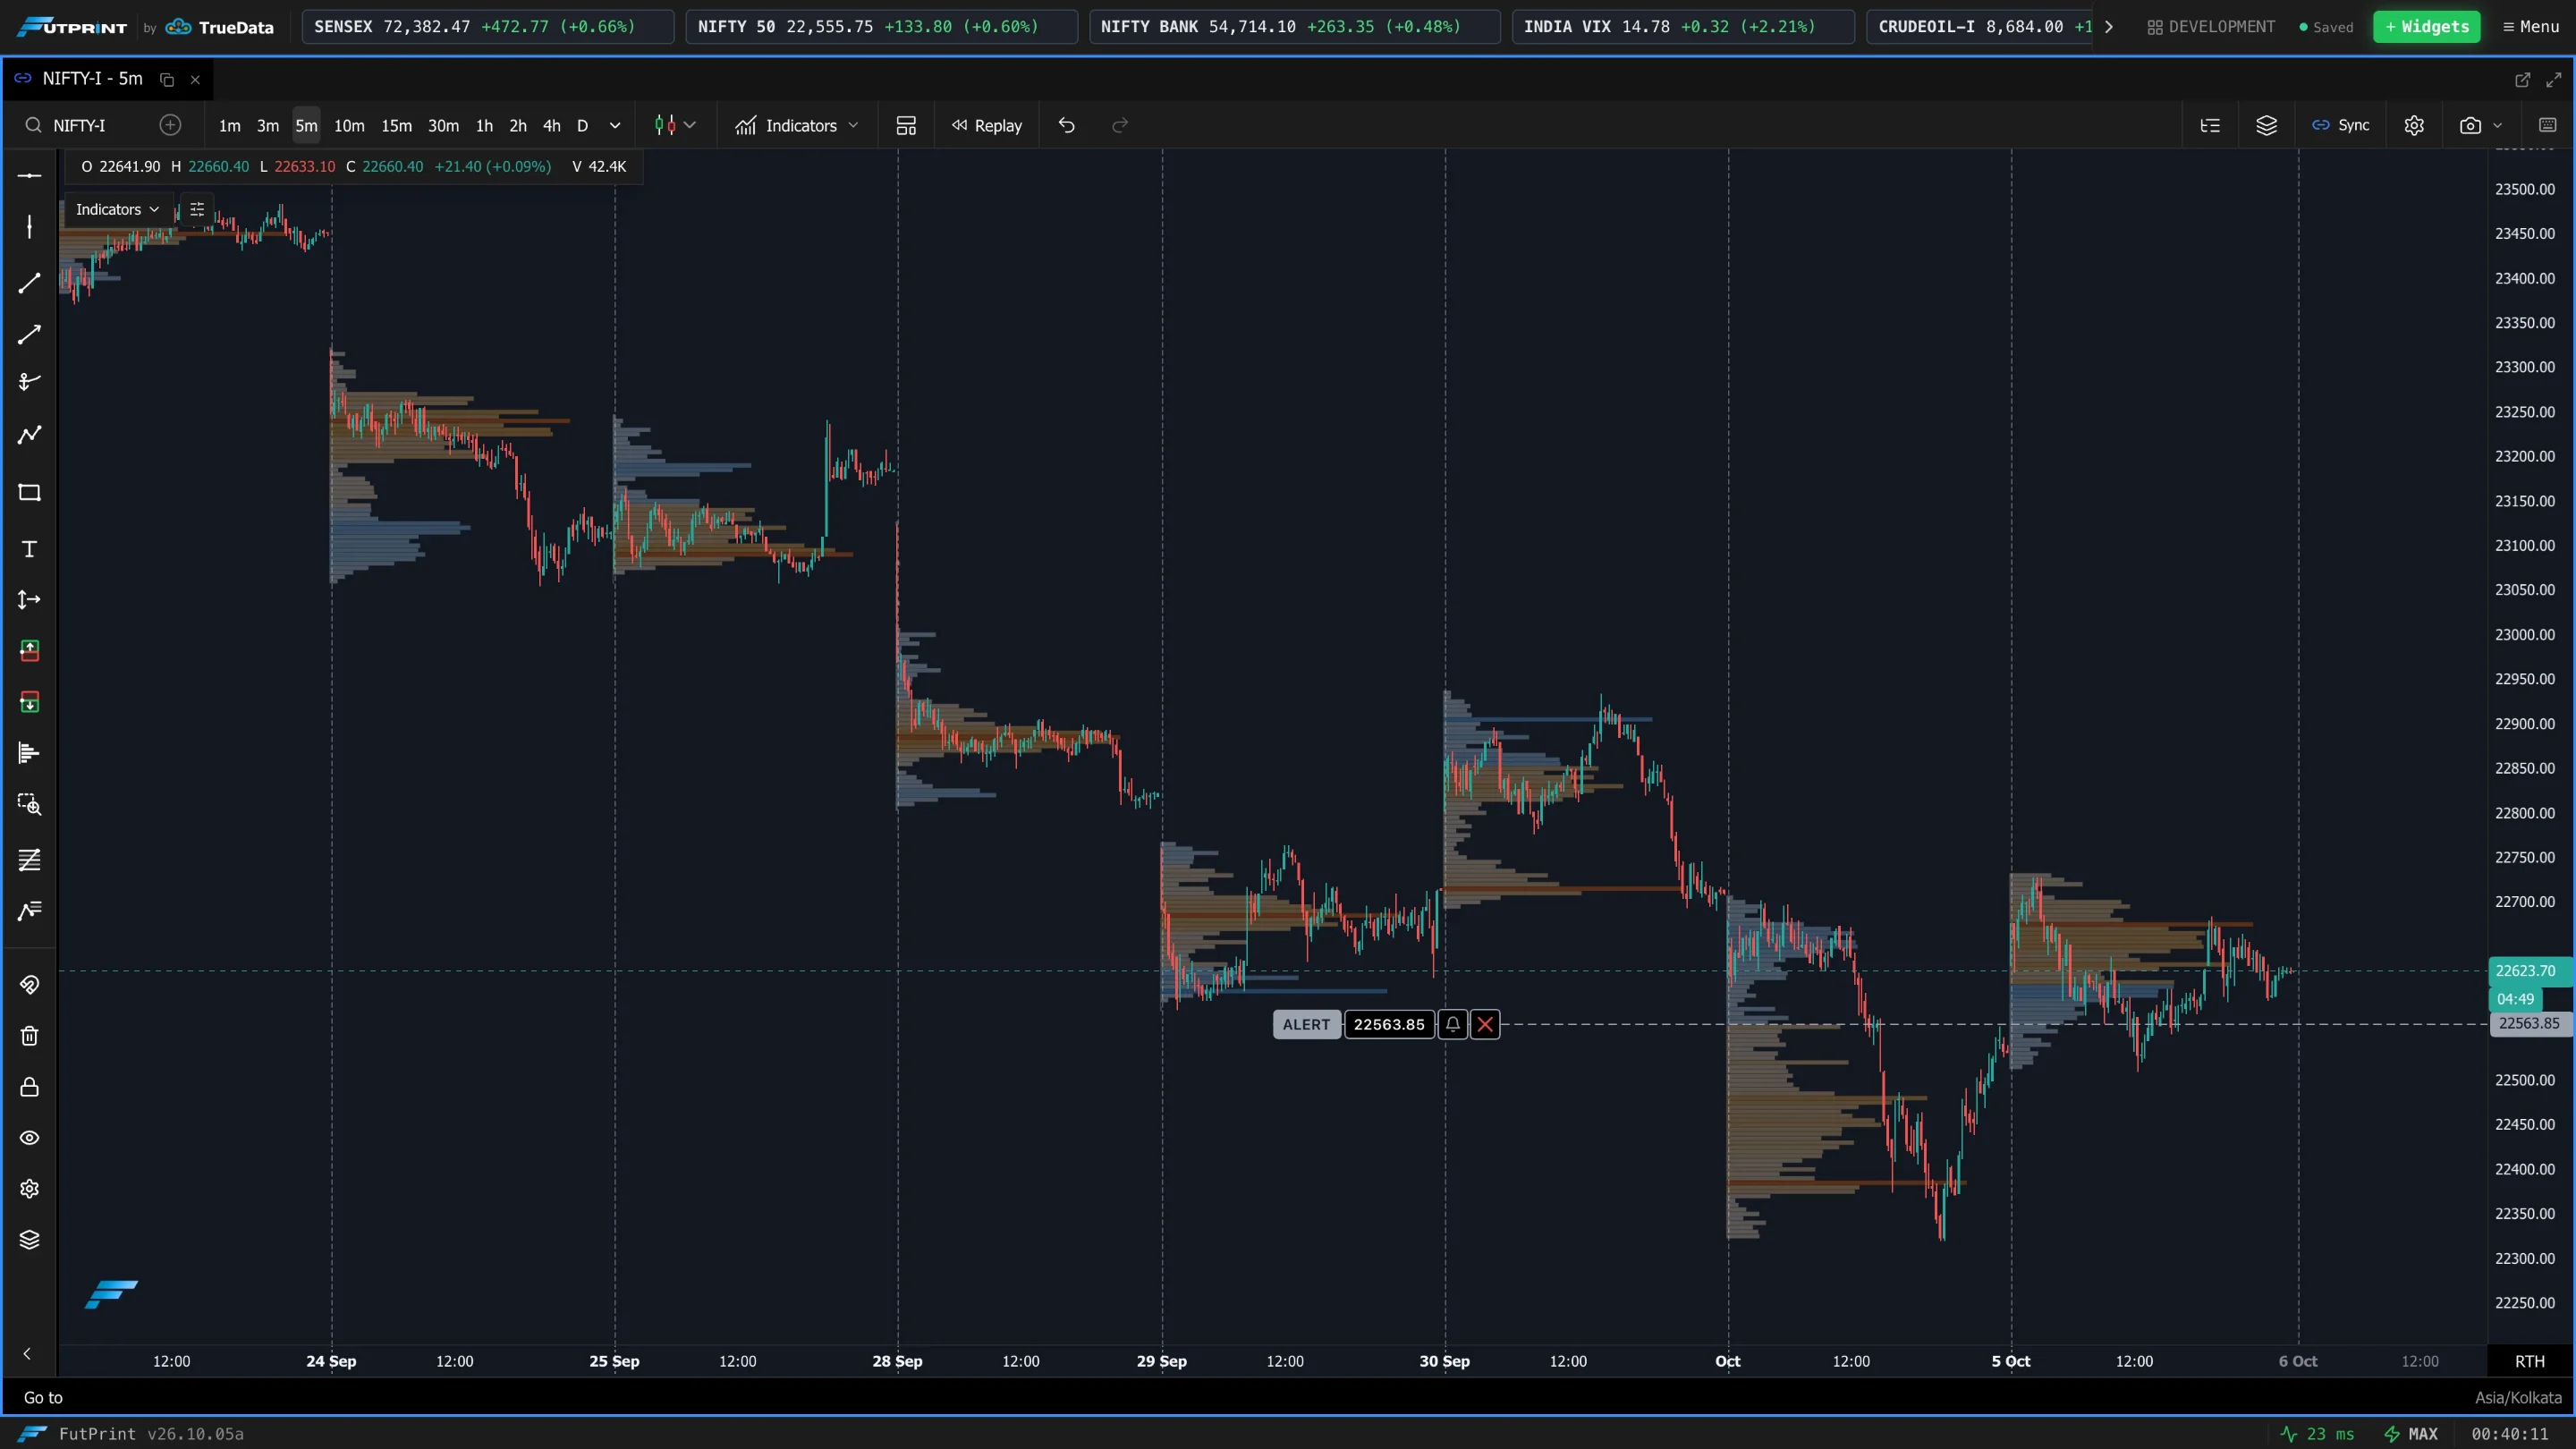
The screenshots on this page show Volume Profile on its own, on a candlestick chart, with its lines switched off unless the section is about them. Use the Dark / Light switch above any image, and click an image to open it full size.
Reading a profile
- Point of Control (POC) — the single price with the most volume in the period.
- Value Area — the band of prices around the POC holding a set share of the volume (70% by default). Its edges are the Value Area High (VAH) and Value Area Low (VAL).
- High-volume nodes (HVN) — peaks in the histogram; prices the market accepted.
- Low-volume nodes (LVN) — troughs; prices the market rejected or moved through fast.
Opening the settings
Open Indicators, click the profile under Added, and its options appear in the Settings pane. You can also use the settings icon on the indicator's row in the chart legend. Changes apply as you make them; press Done to close.
General
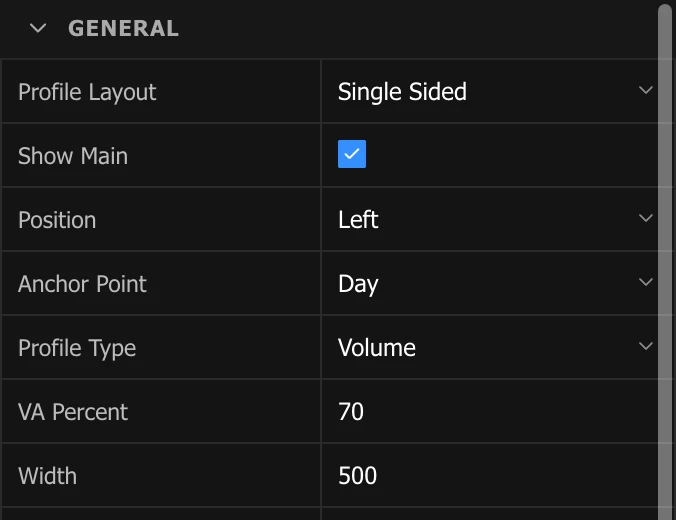
Profile Layout
- Single Sided — one histogram per period.
- Two Sided — two histograms per period, back to back, each with its own type and width. Two-sided profiles are centred on the start of each period, with the left side extending into the previous period.
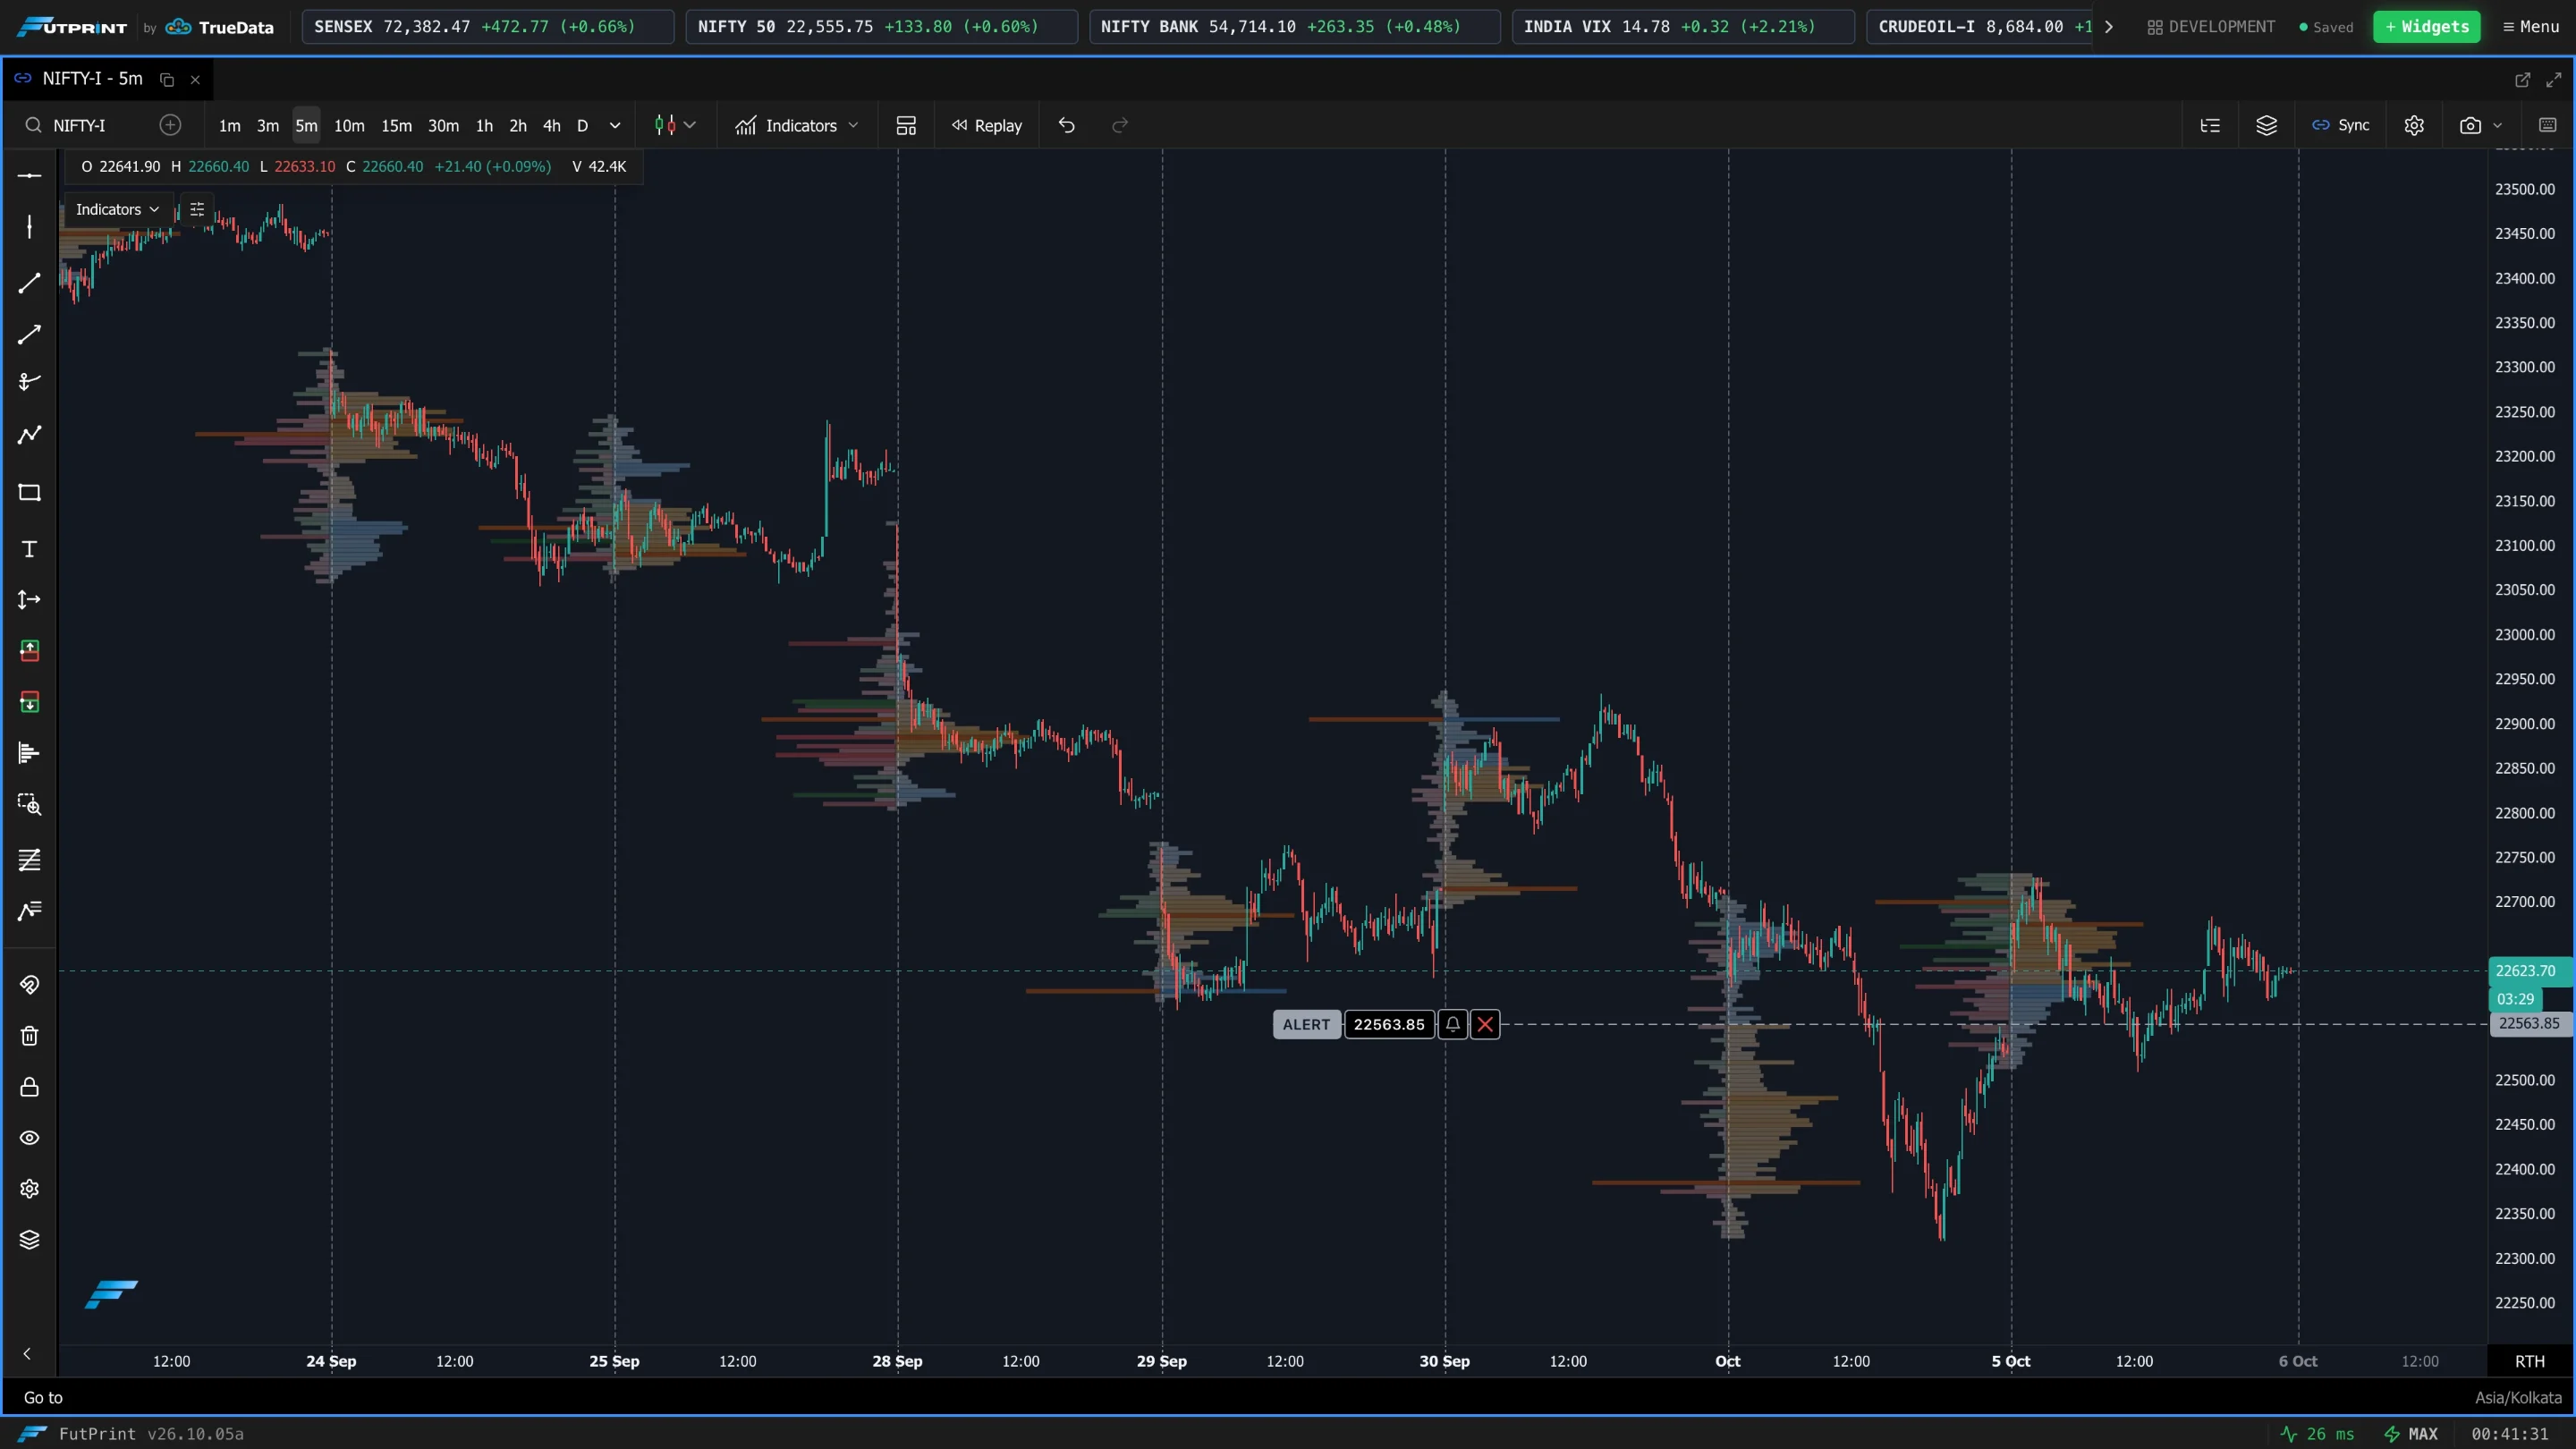
When Two Sided is selected, a Position option chooses the edge the pair is centred on — the period's start (Left) or its end (Right) — and Left Side and Right Side groups appear, each with a Profile Type and Width.
Show Main
Shows or hides the histogram bars themselves. With it off, the POC, value-area and node lines still draw according to their own settings — useful when you only want the levels.
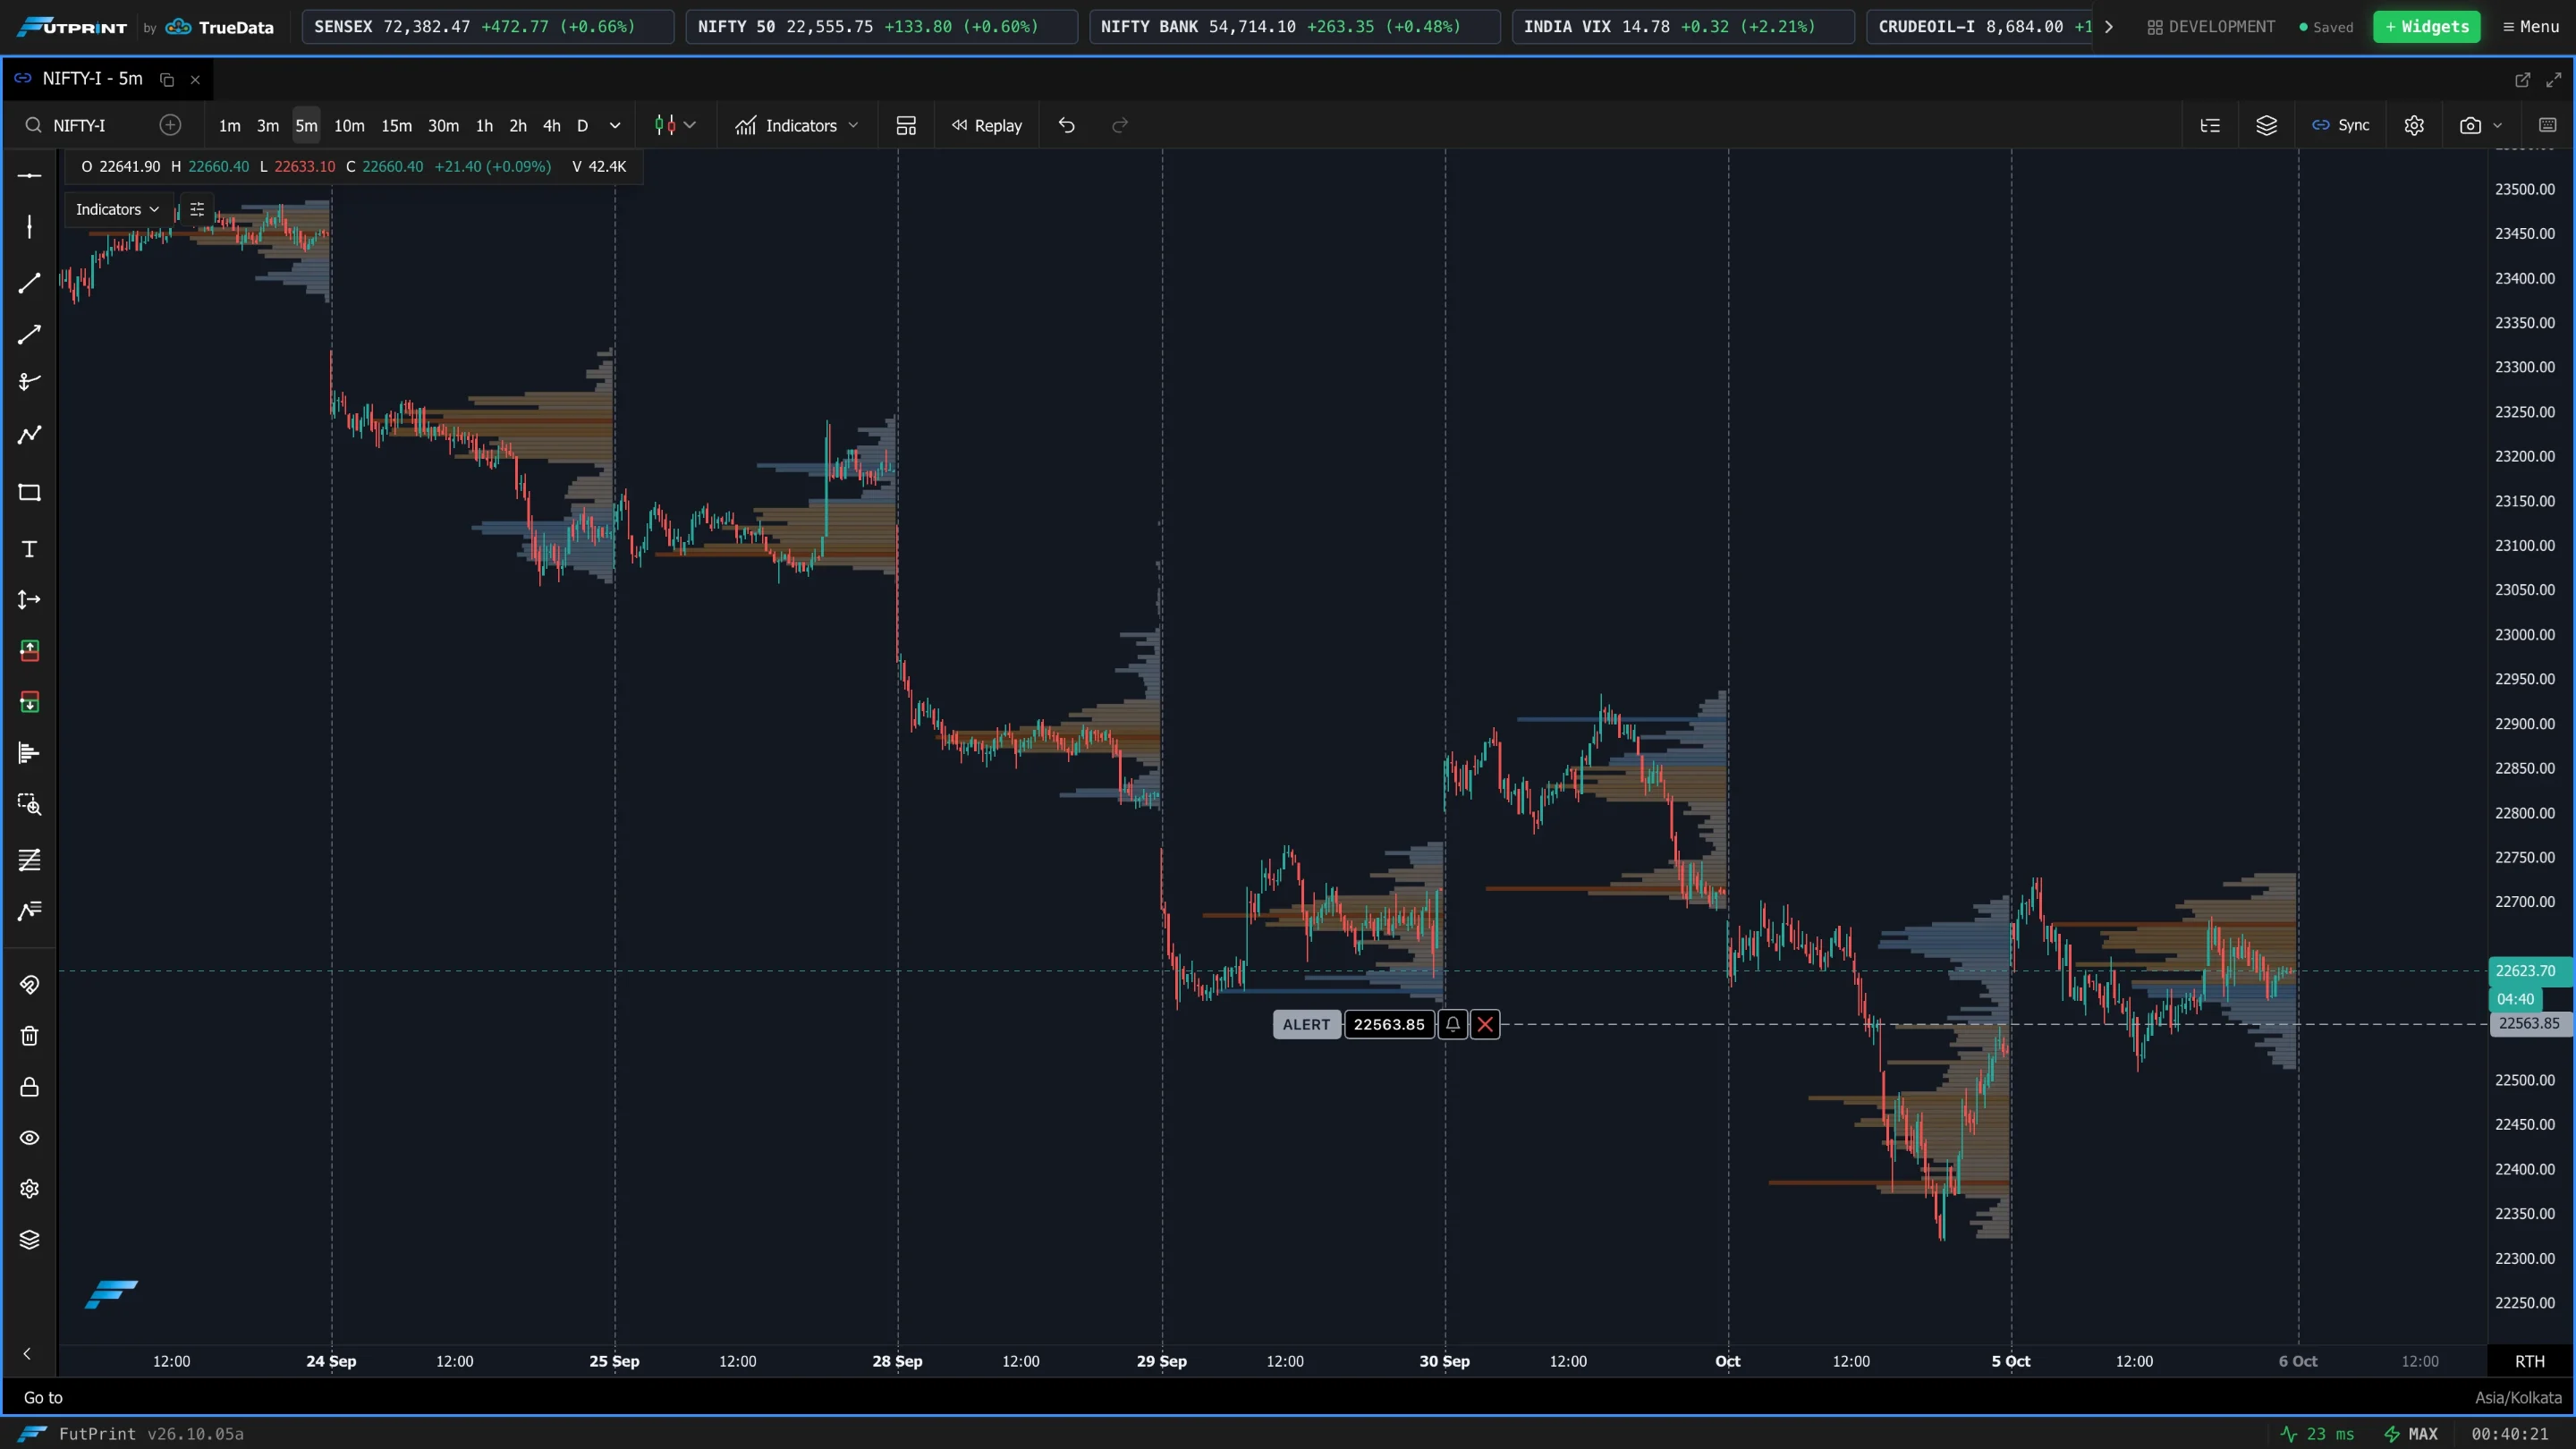
Position
(Single Sided) Where the histogram sits in its period.
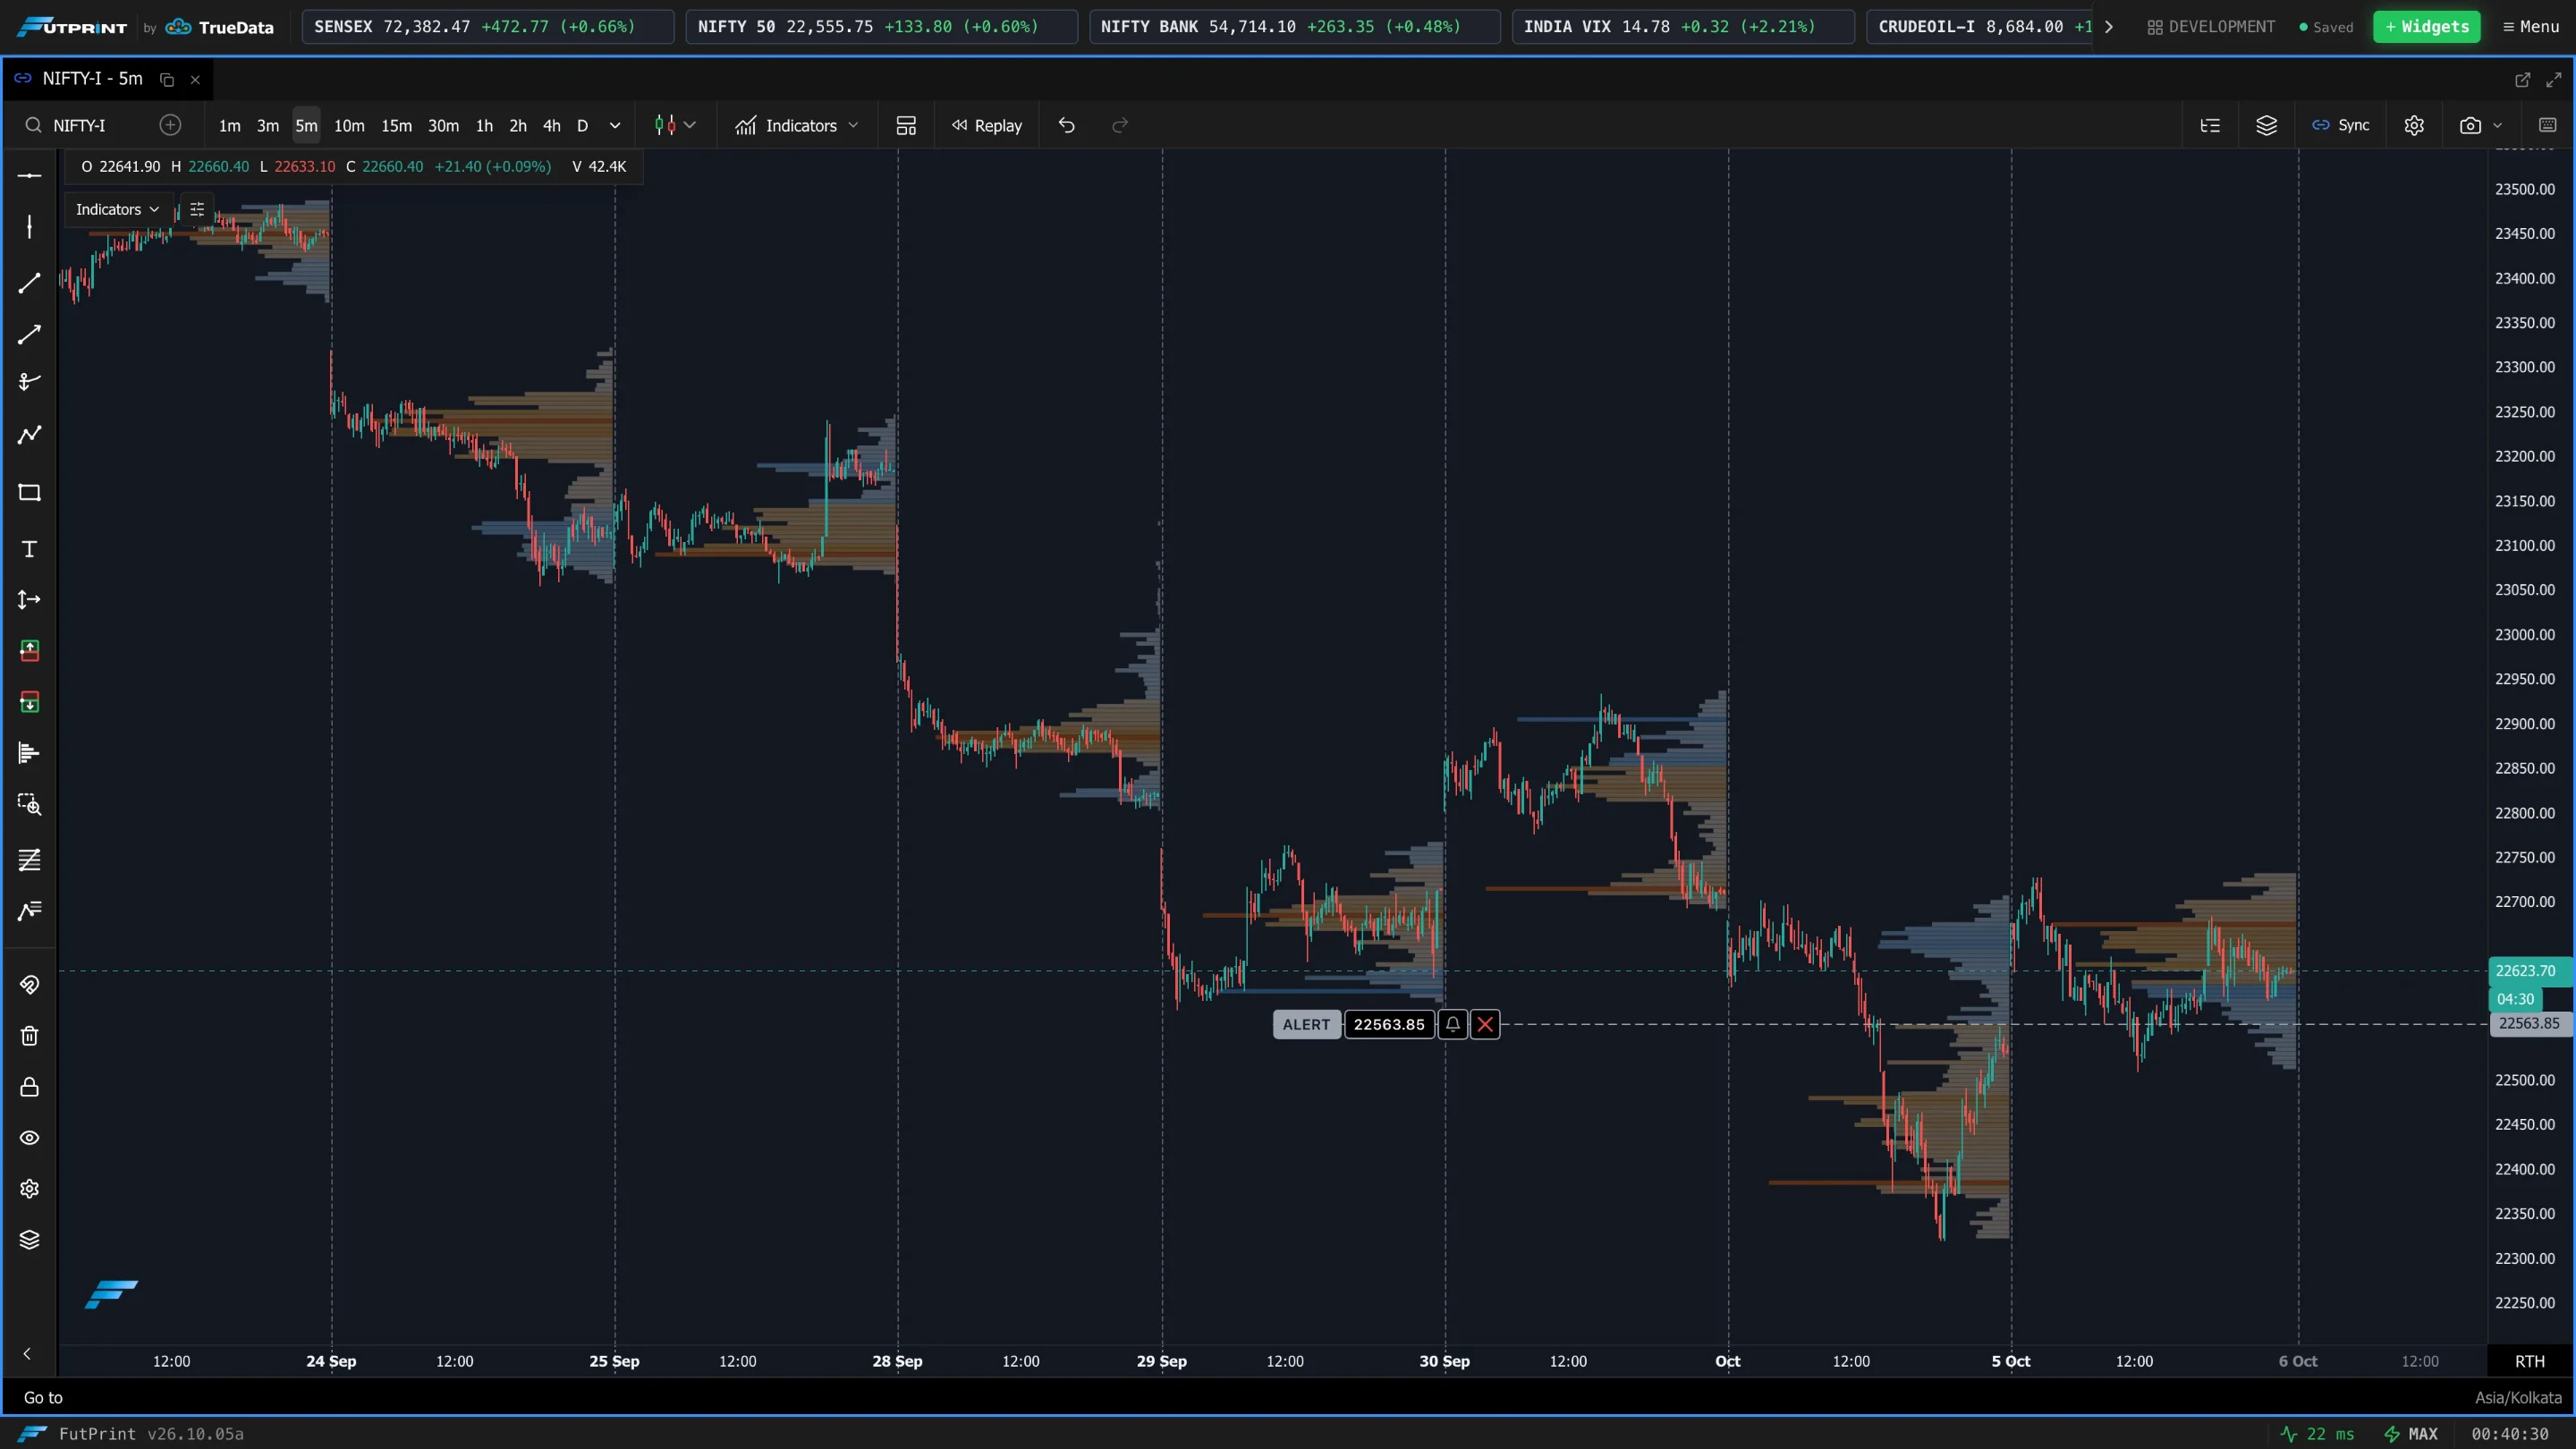
Anchor Point
The period each profile covers: Session, Day, Week, Month or Custom. Choosing Custom adds a Custom Anchor field for the start time.
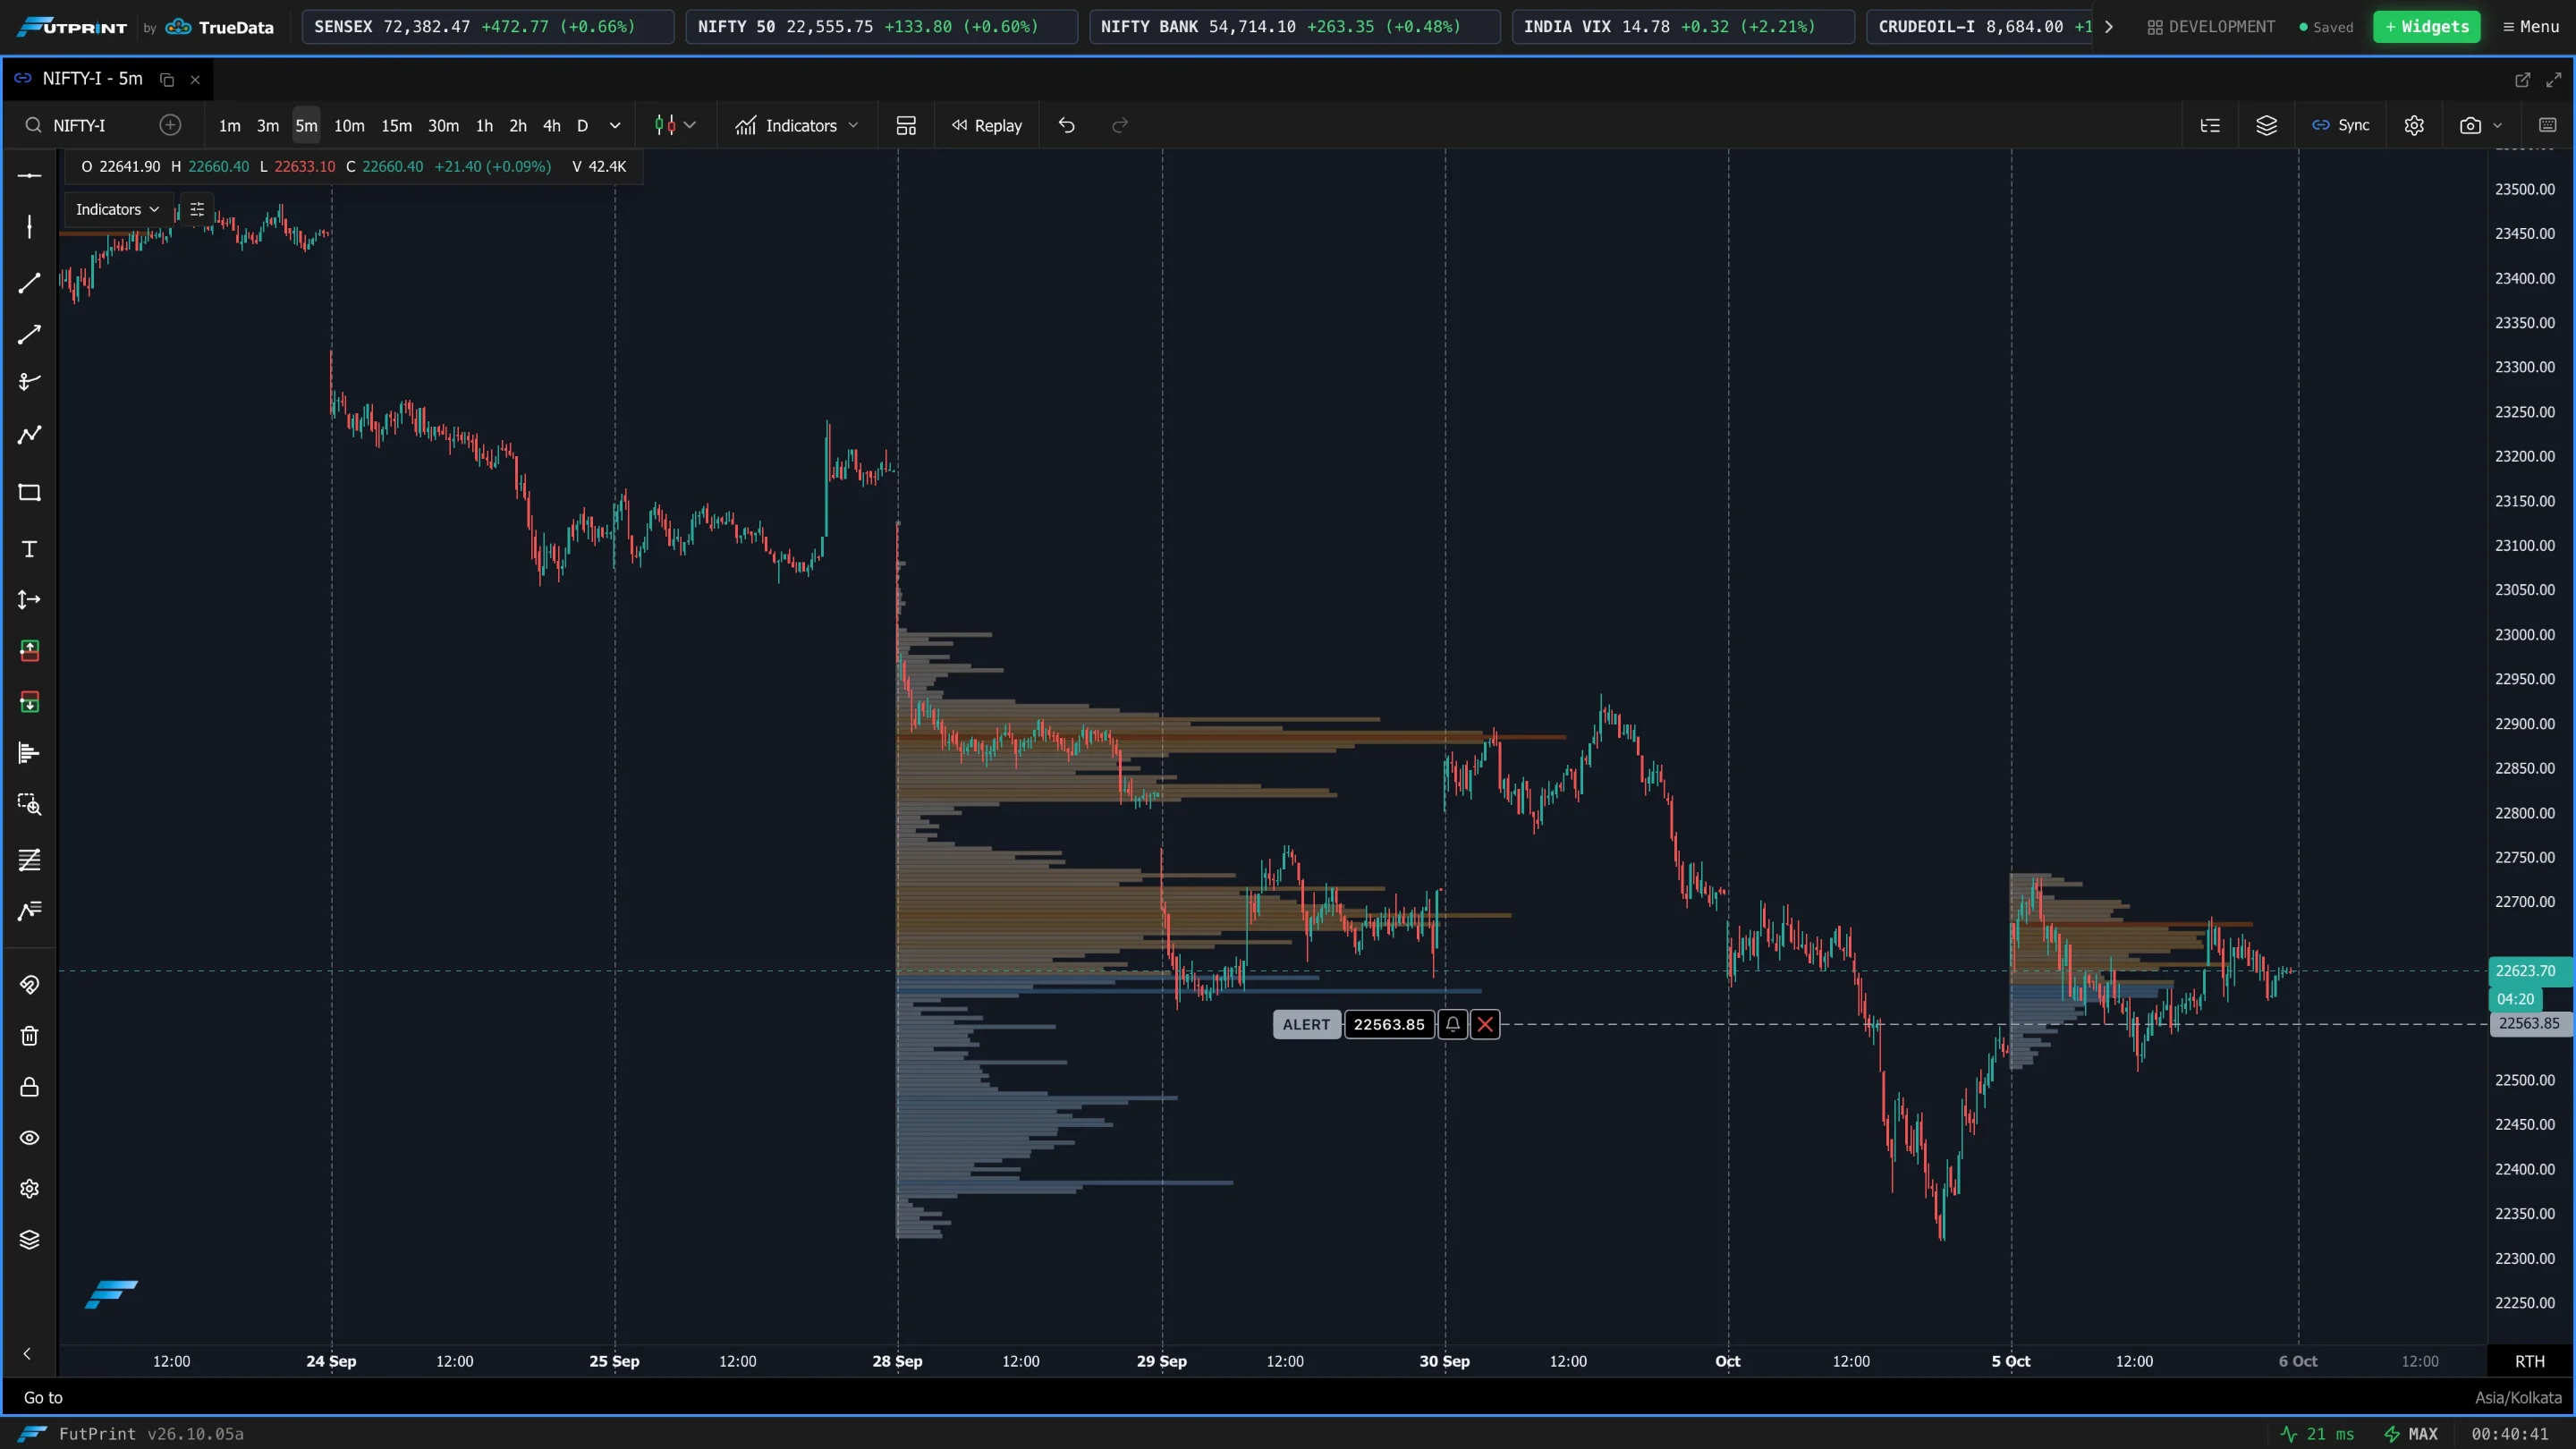
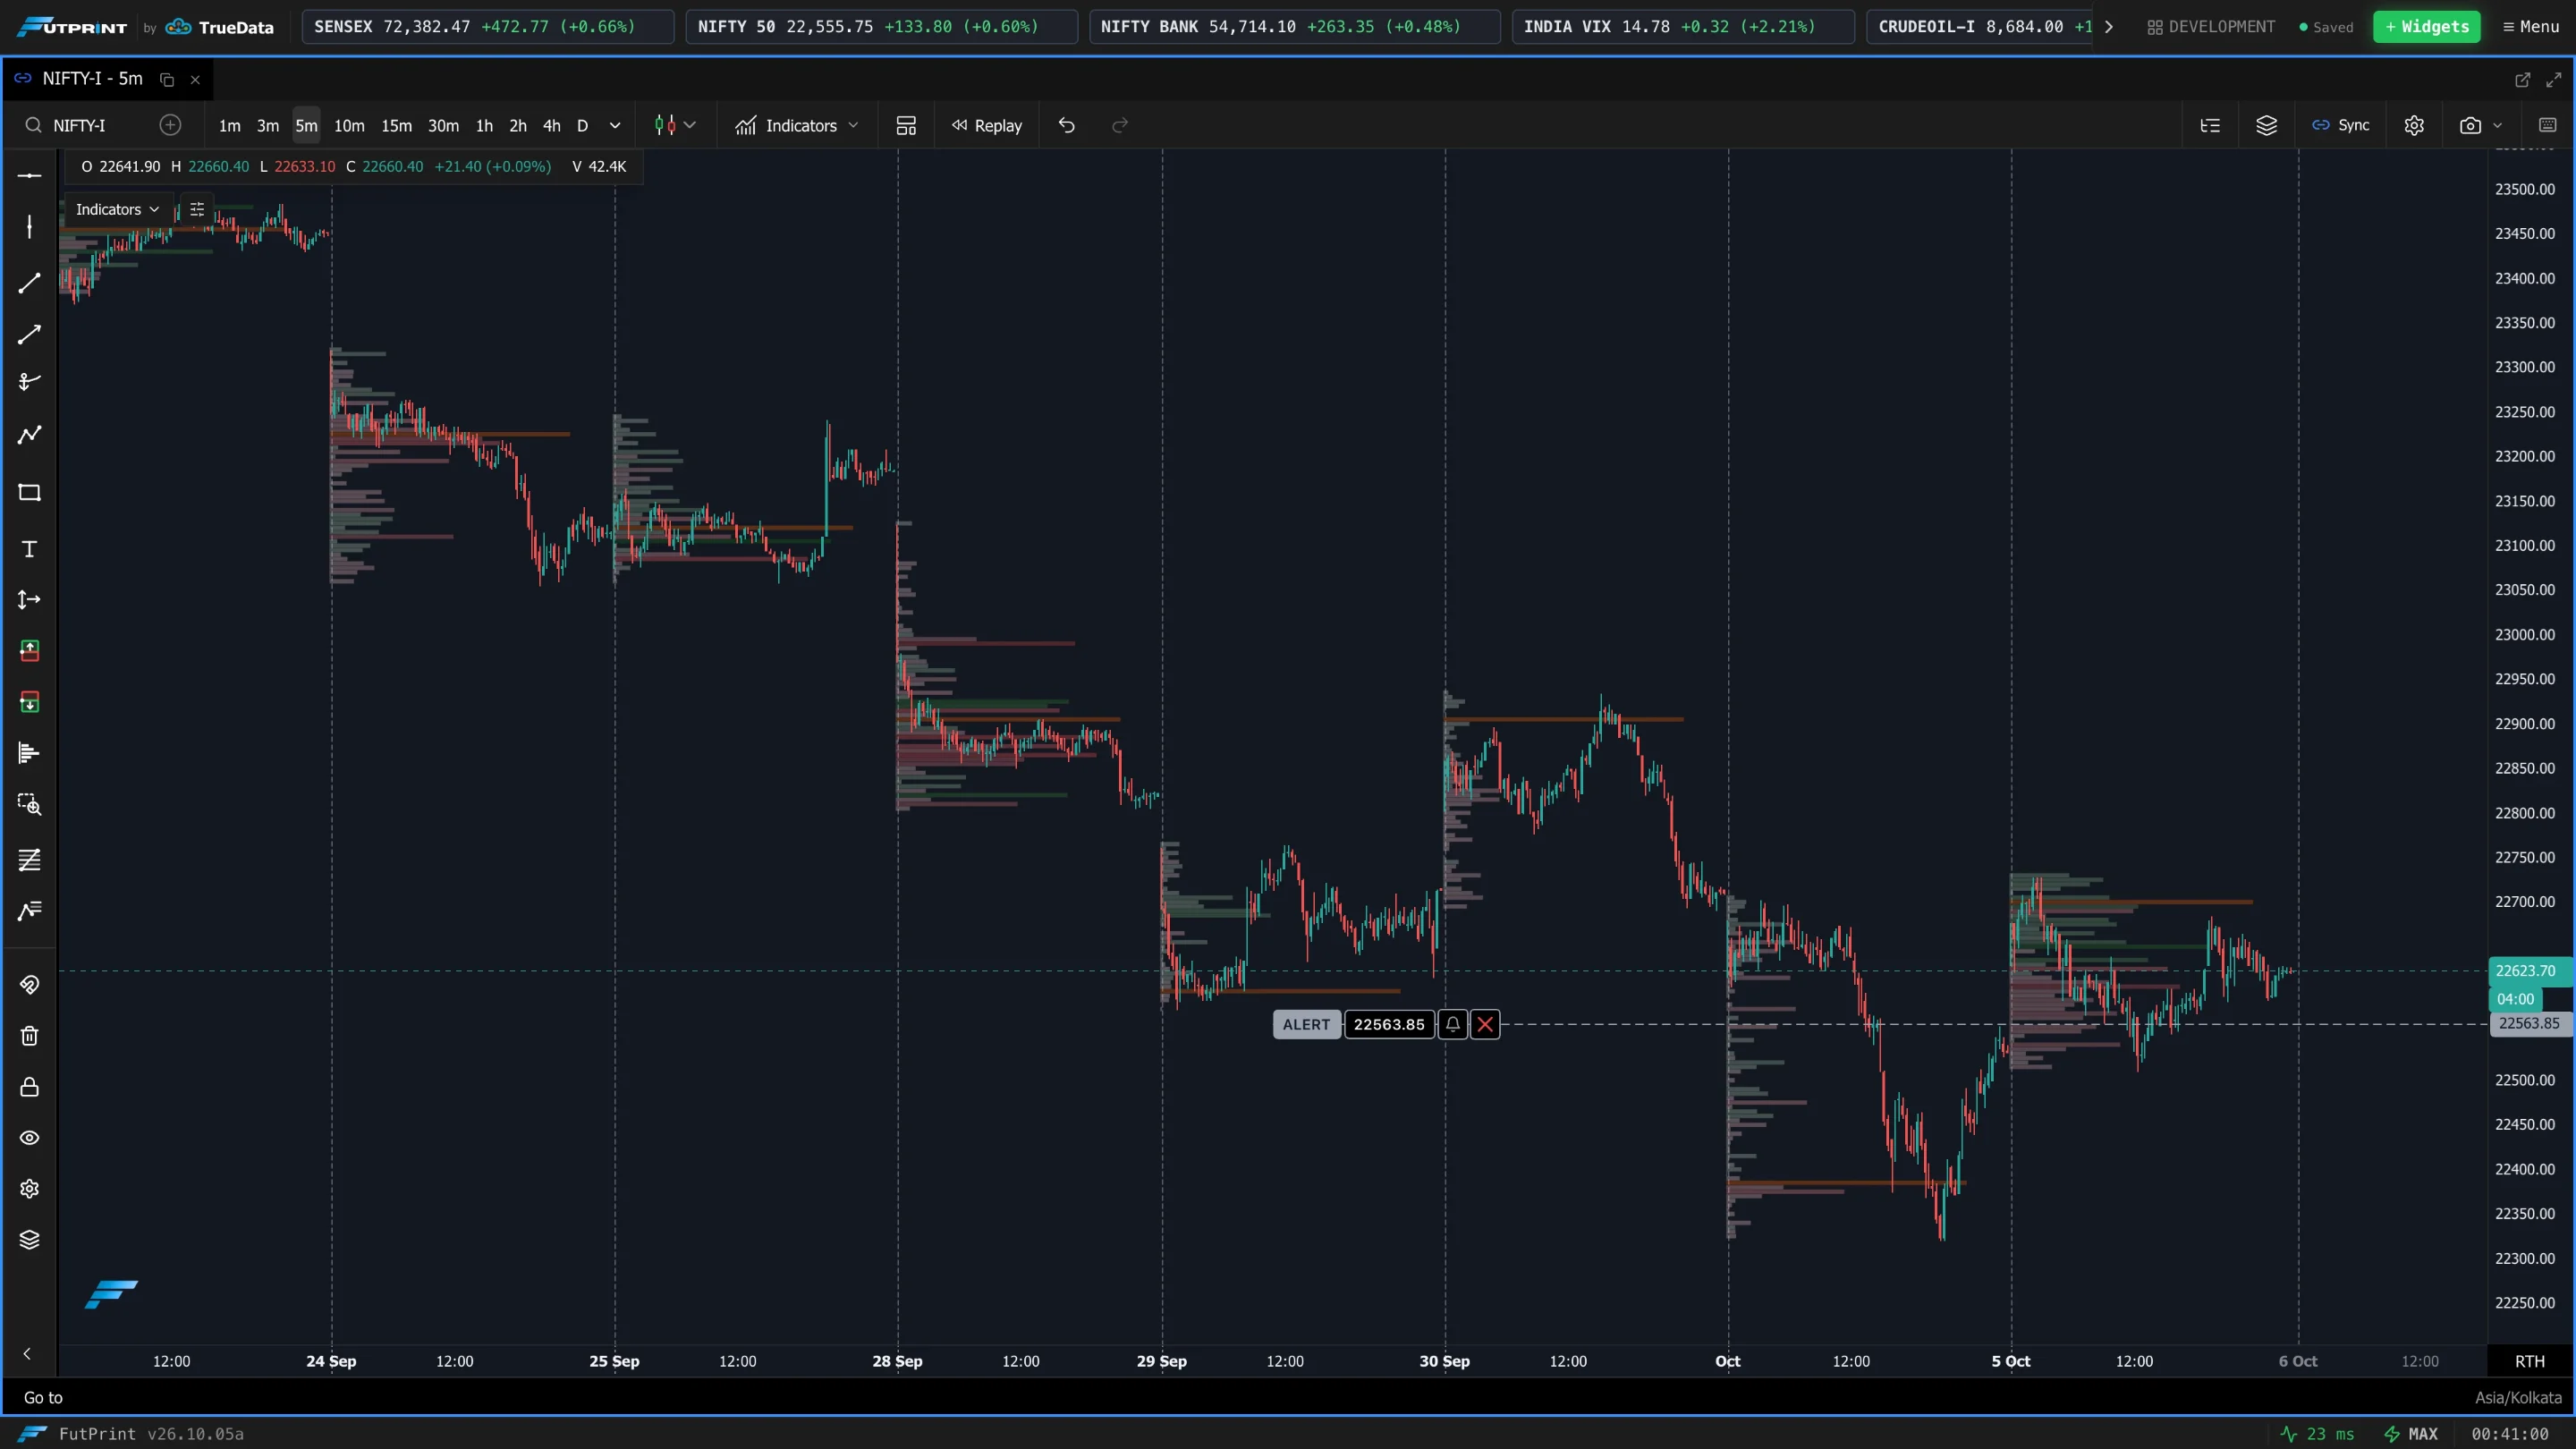
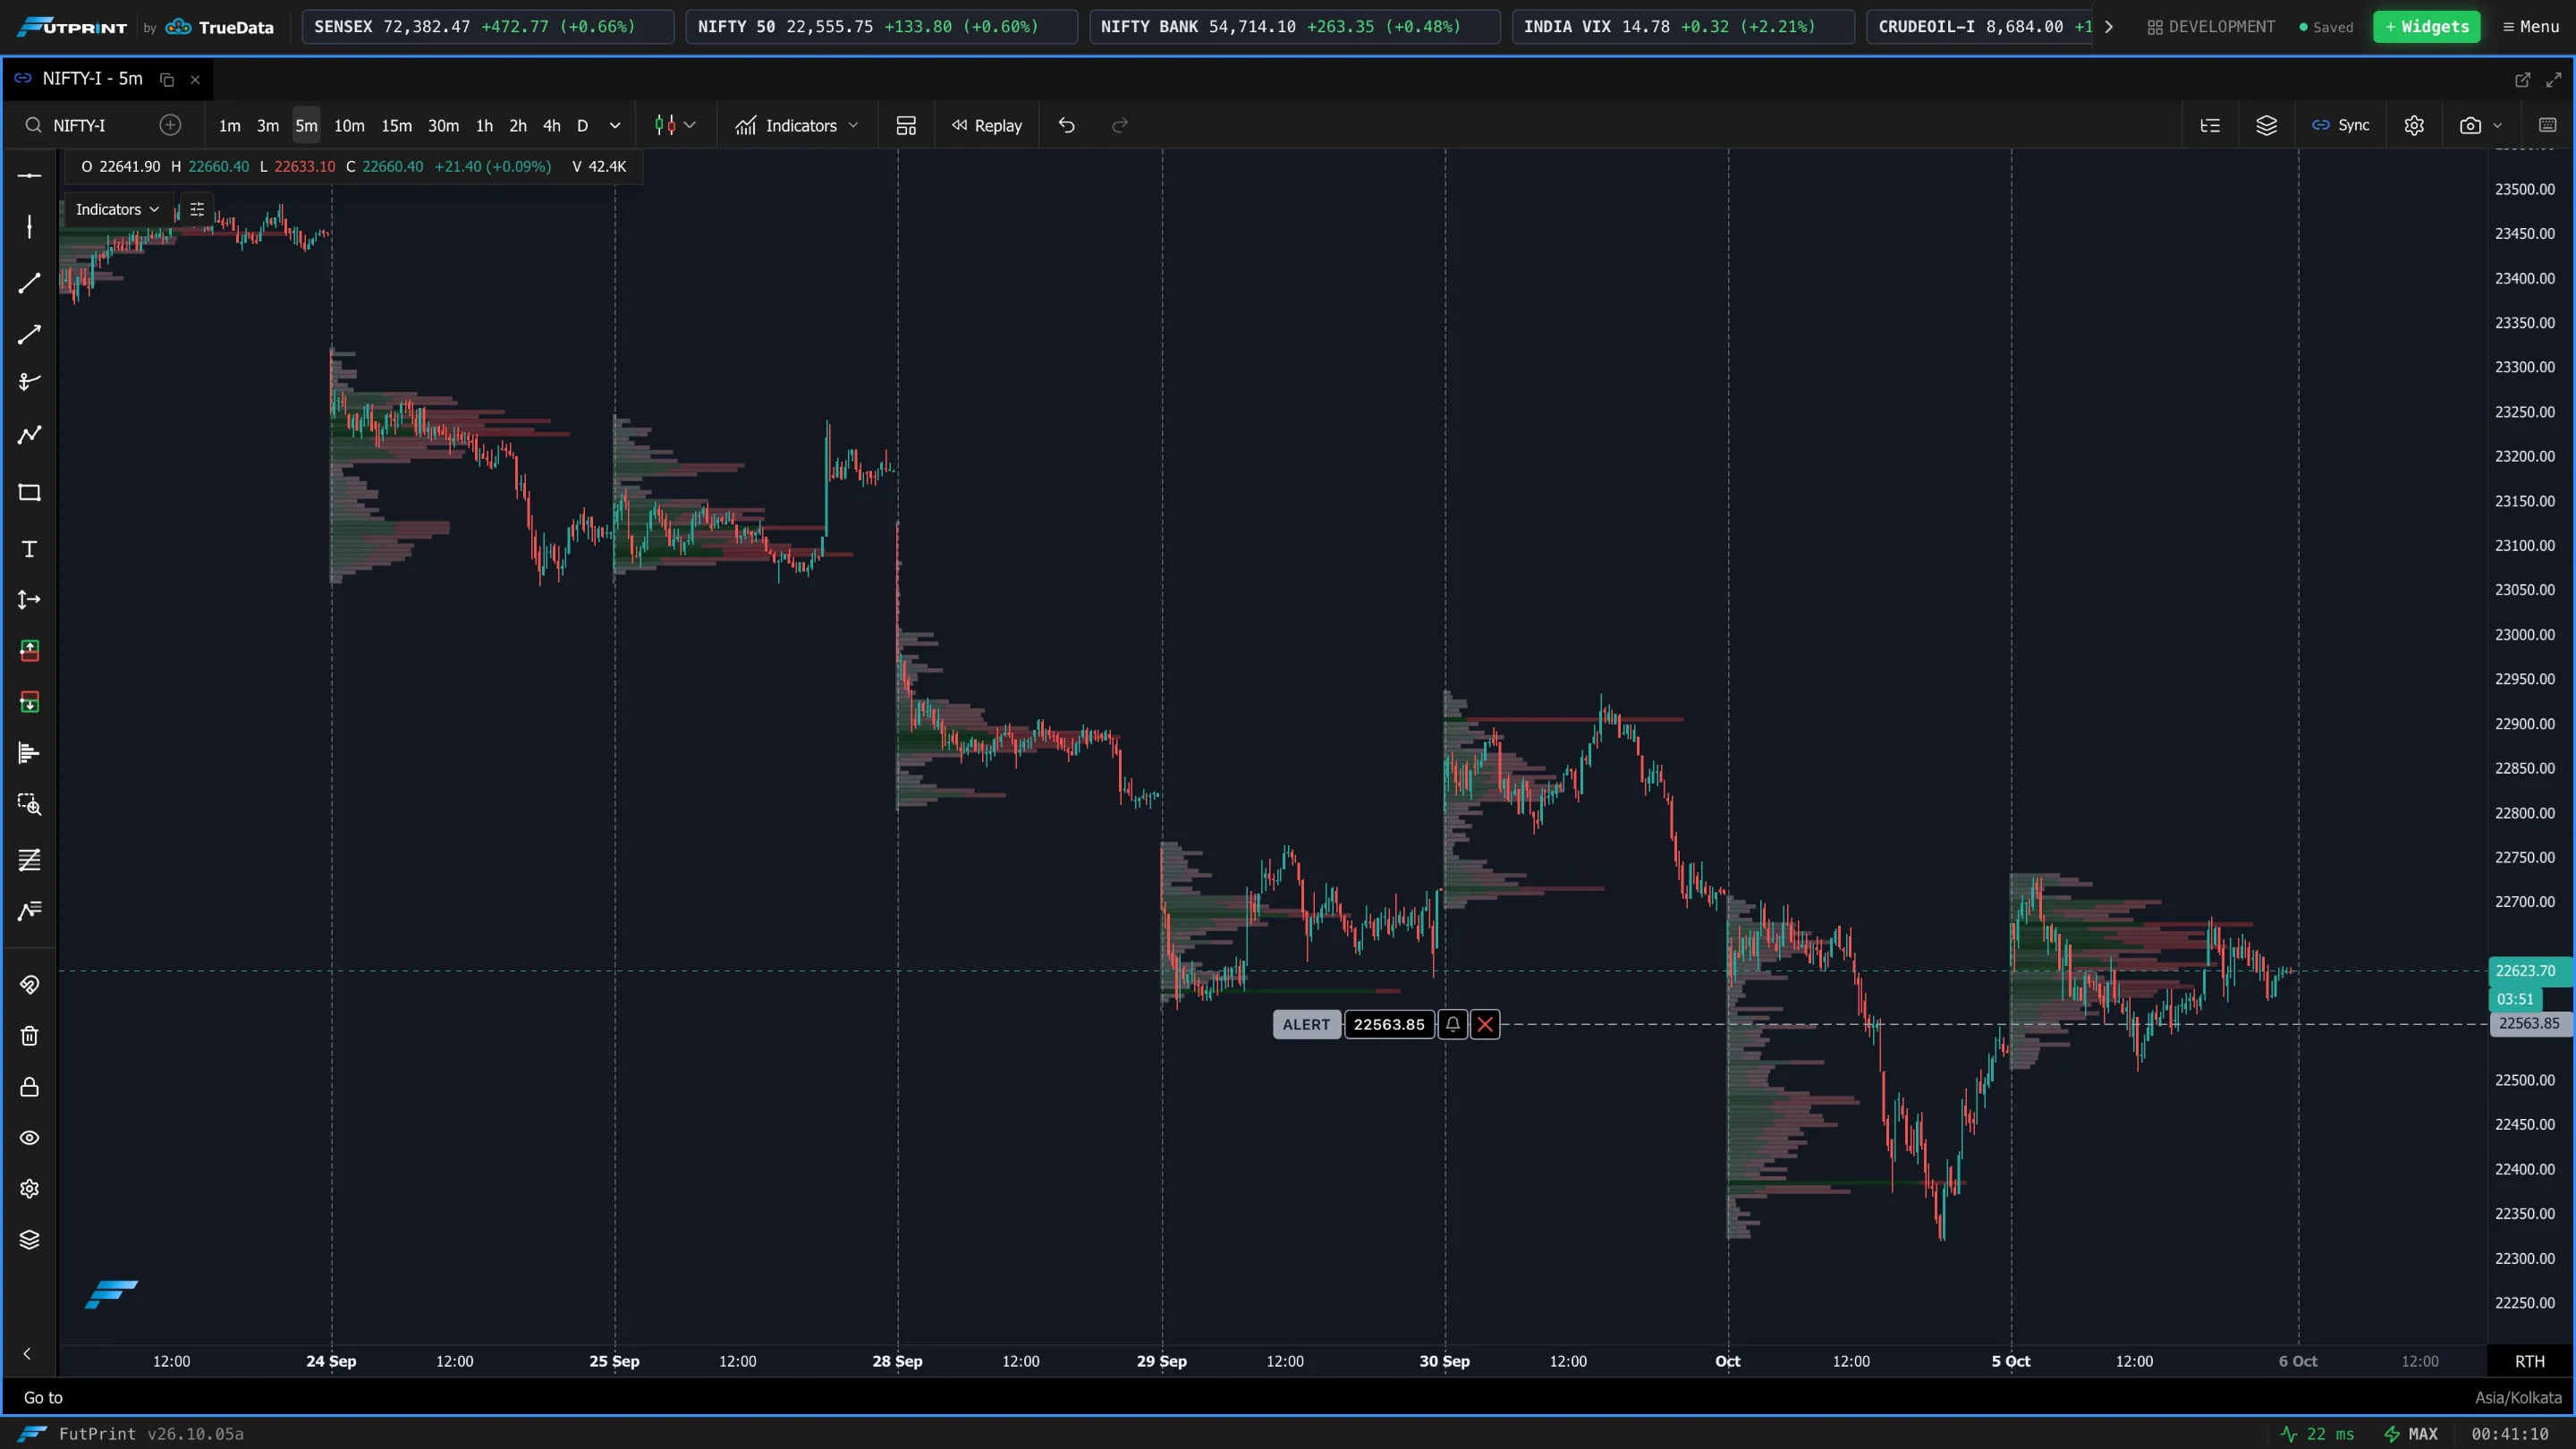
Profile Type
(Single Sided) What the bars measure.
| Type | Meaning |
|---|---|
| Volume | Total volume at each price. |
| Delta | Buy volume minus sell volume at each price. |
| Bid X Ask | Volume split into what traded at the bid and at the ask. |
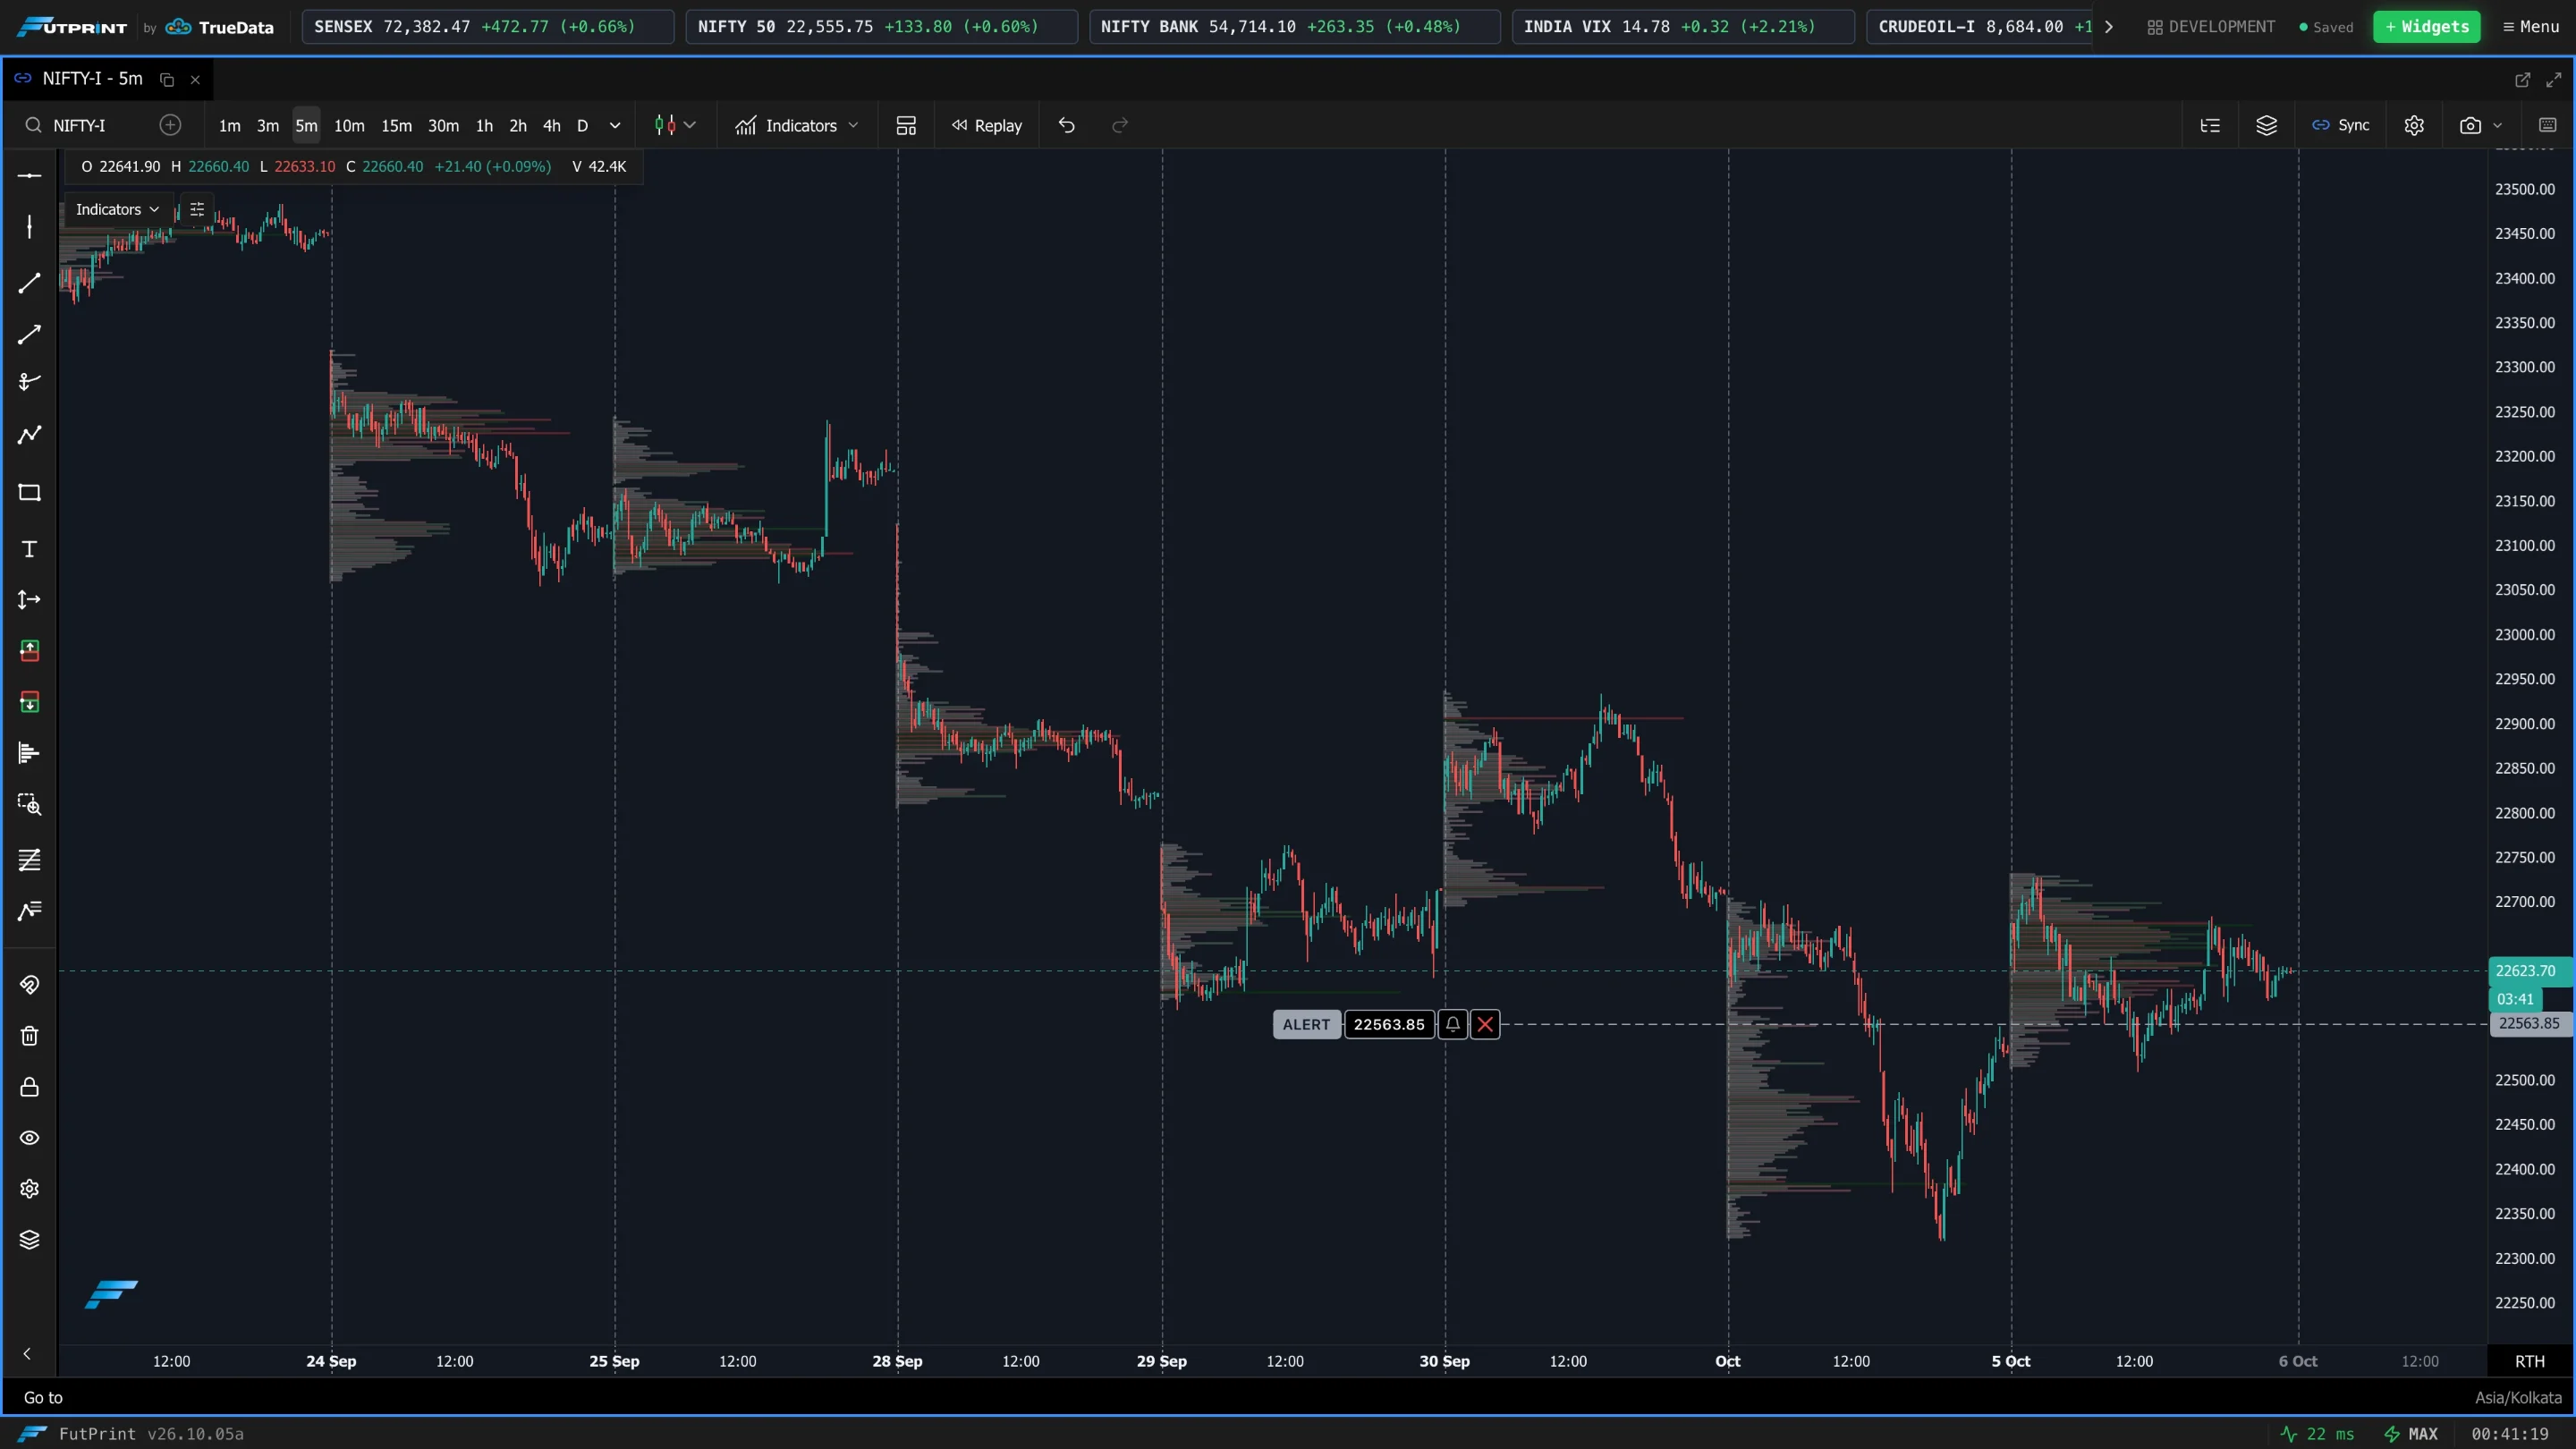
VA Percent
The share of the period's volume that defines the value area, from 50 to 100. The default is 70.
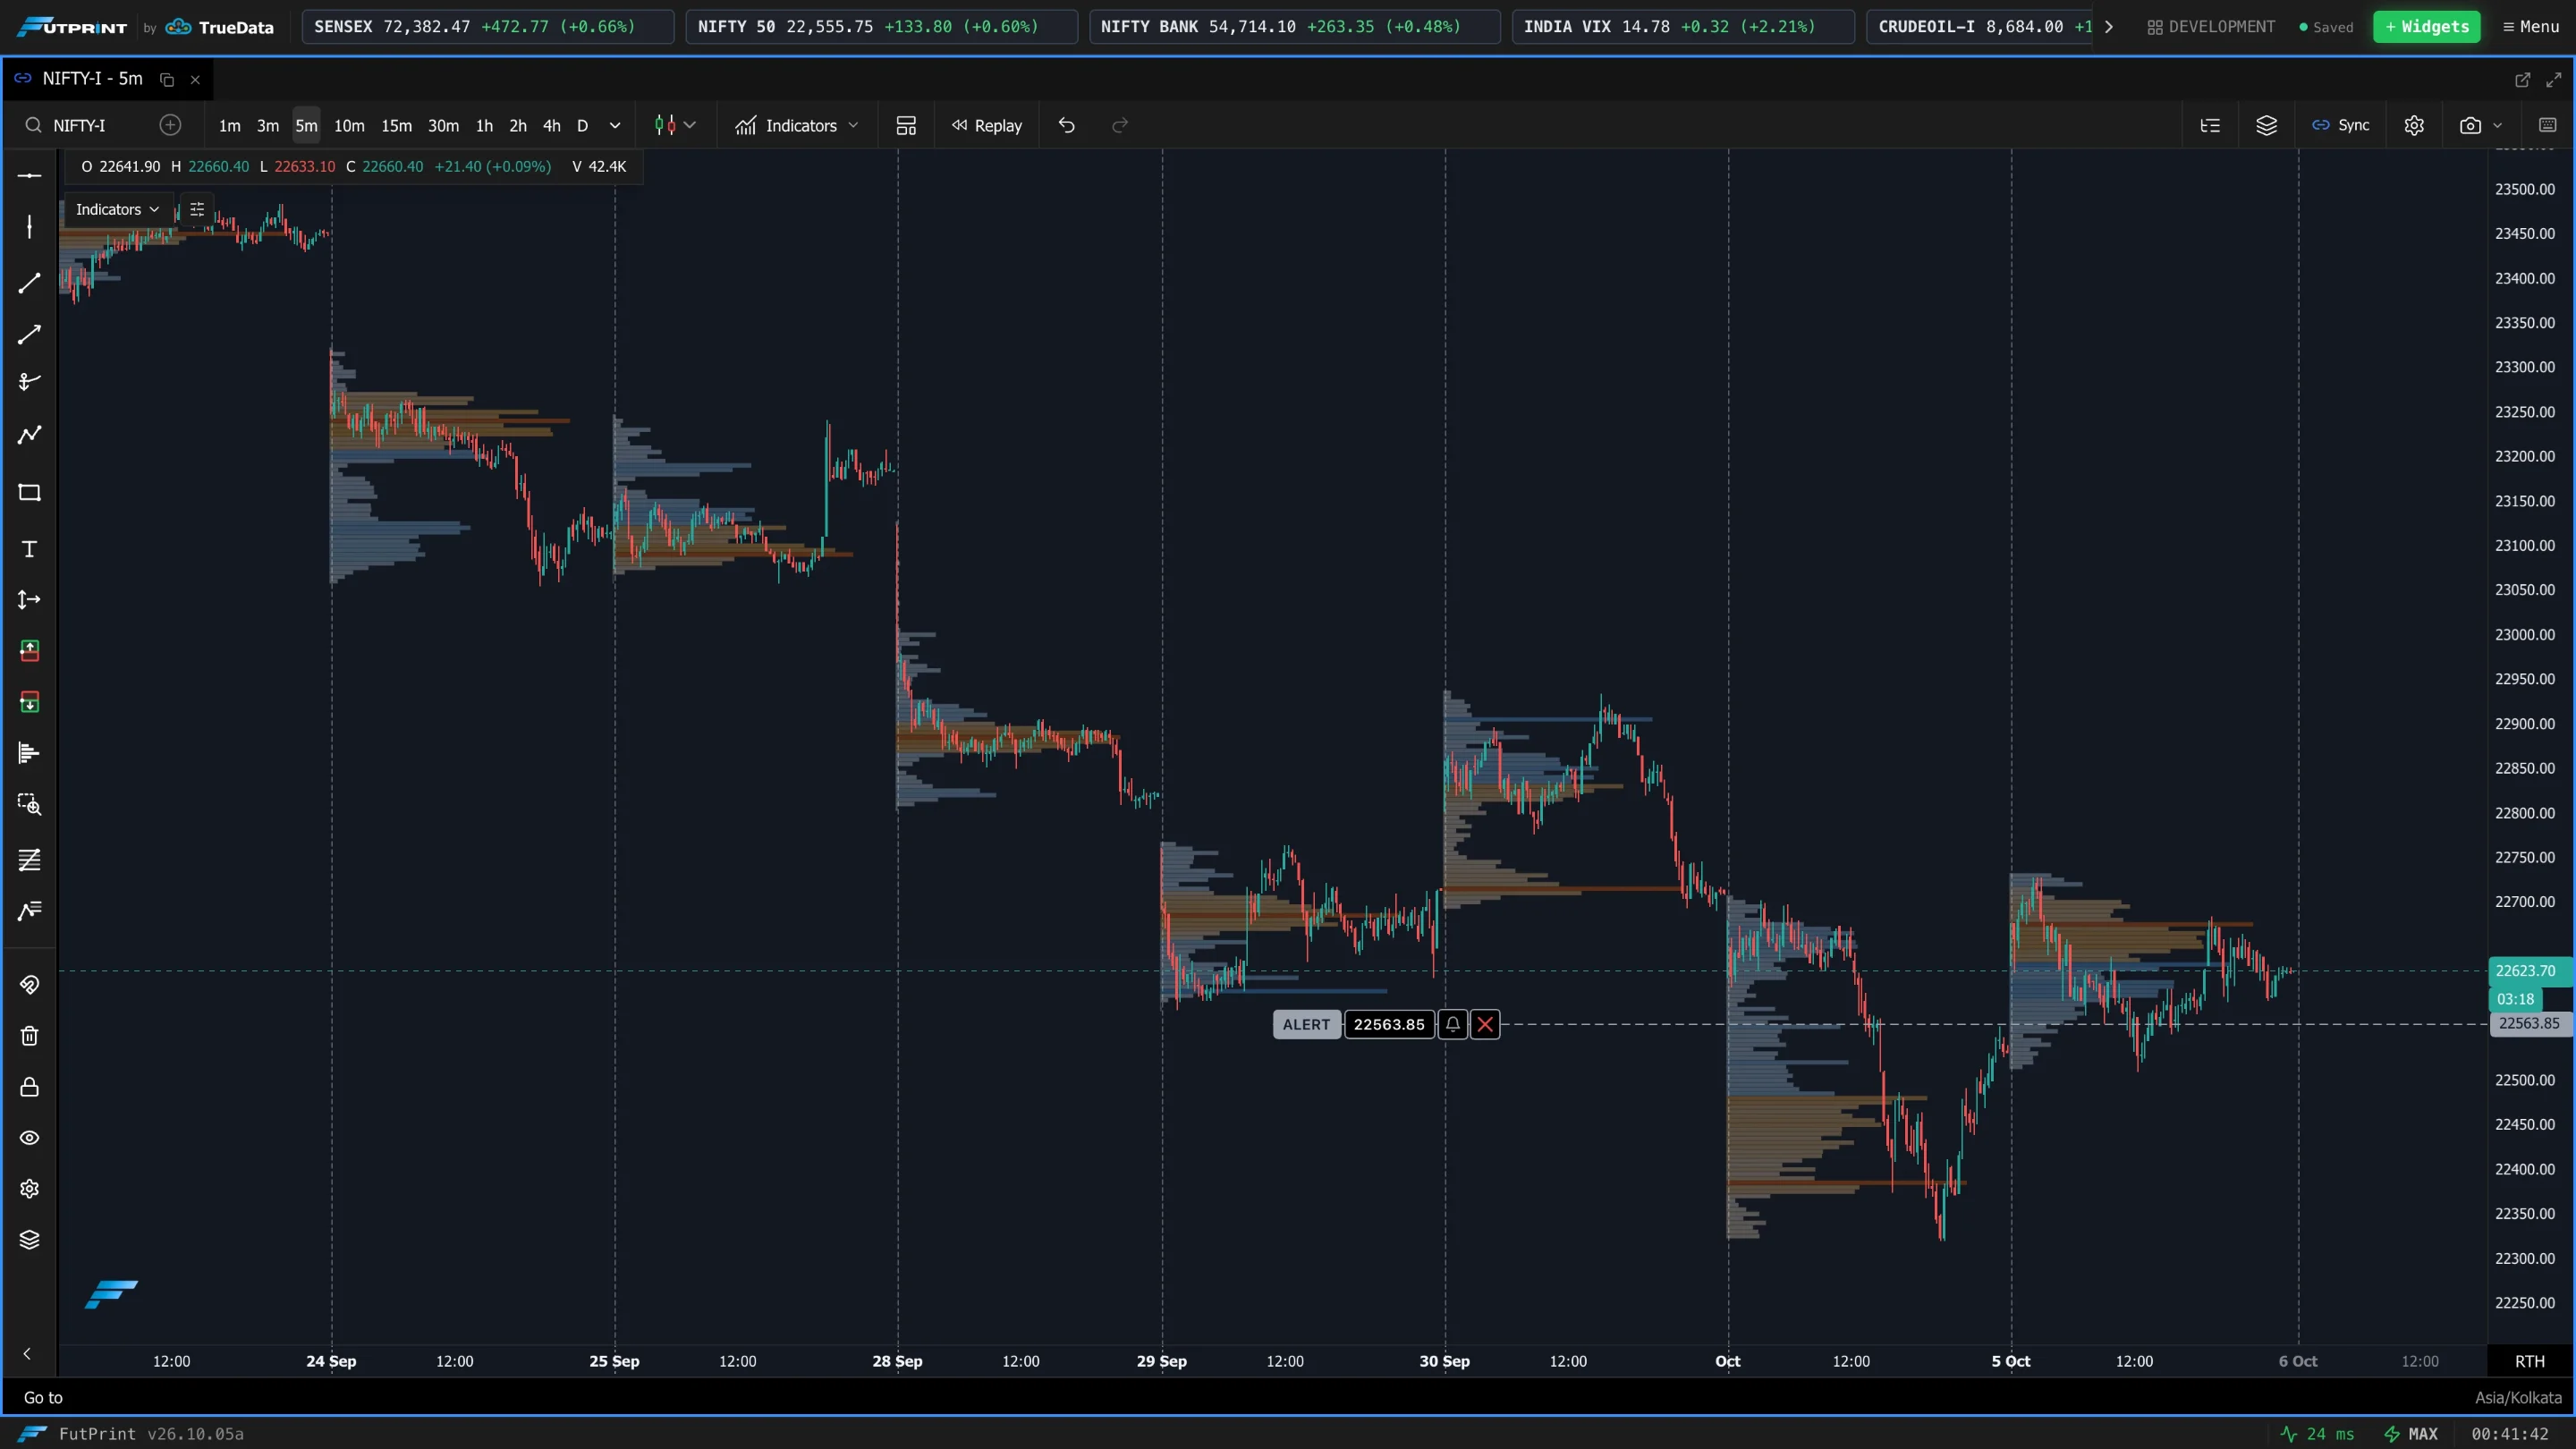
Width
(Single Sided) The maximum width of the histogram, from 50 to 500.
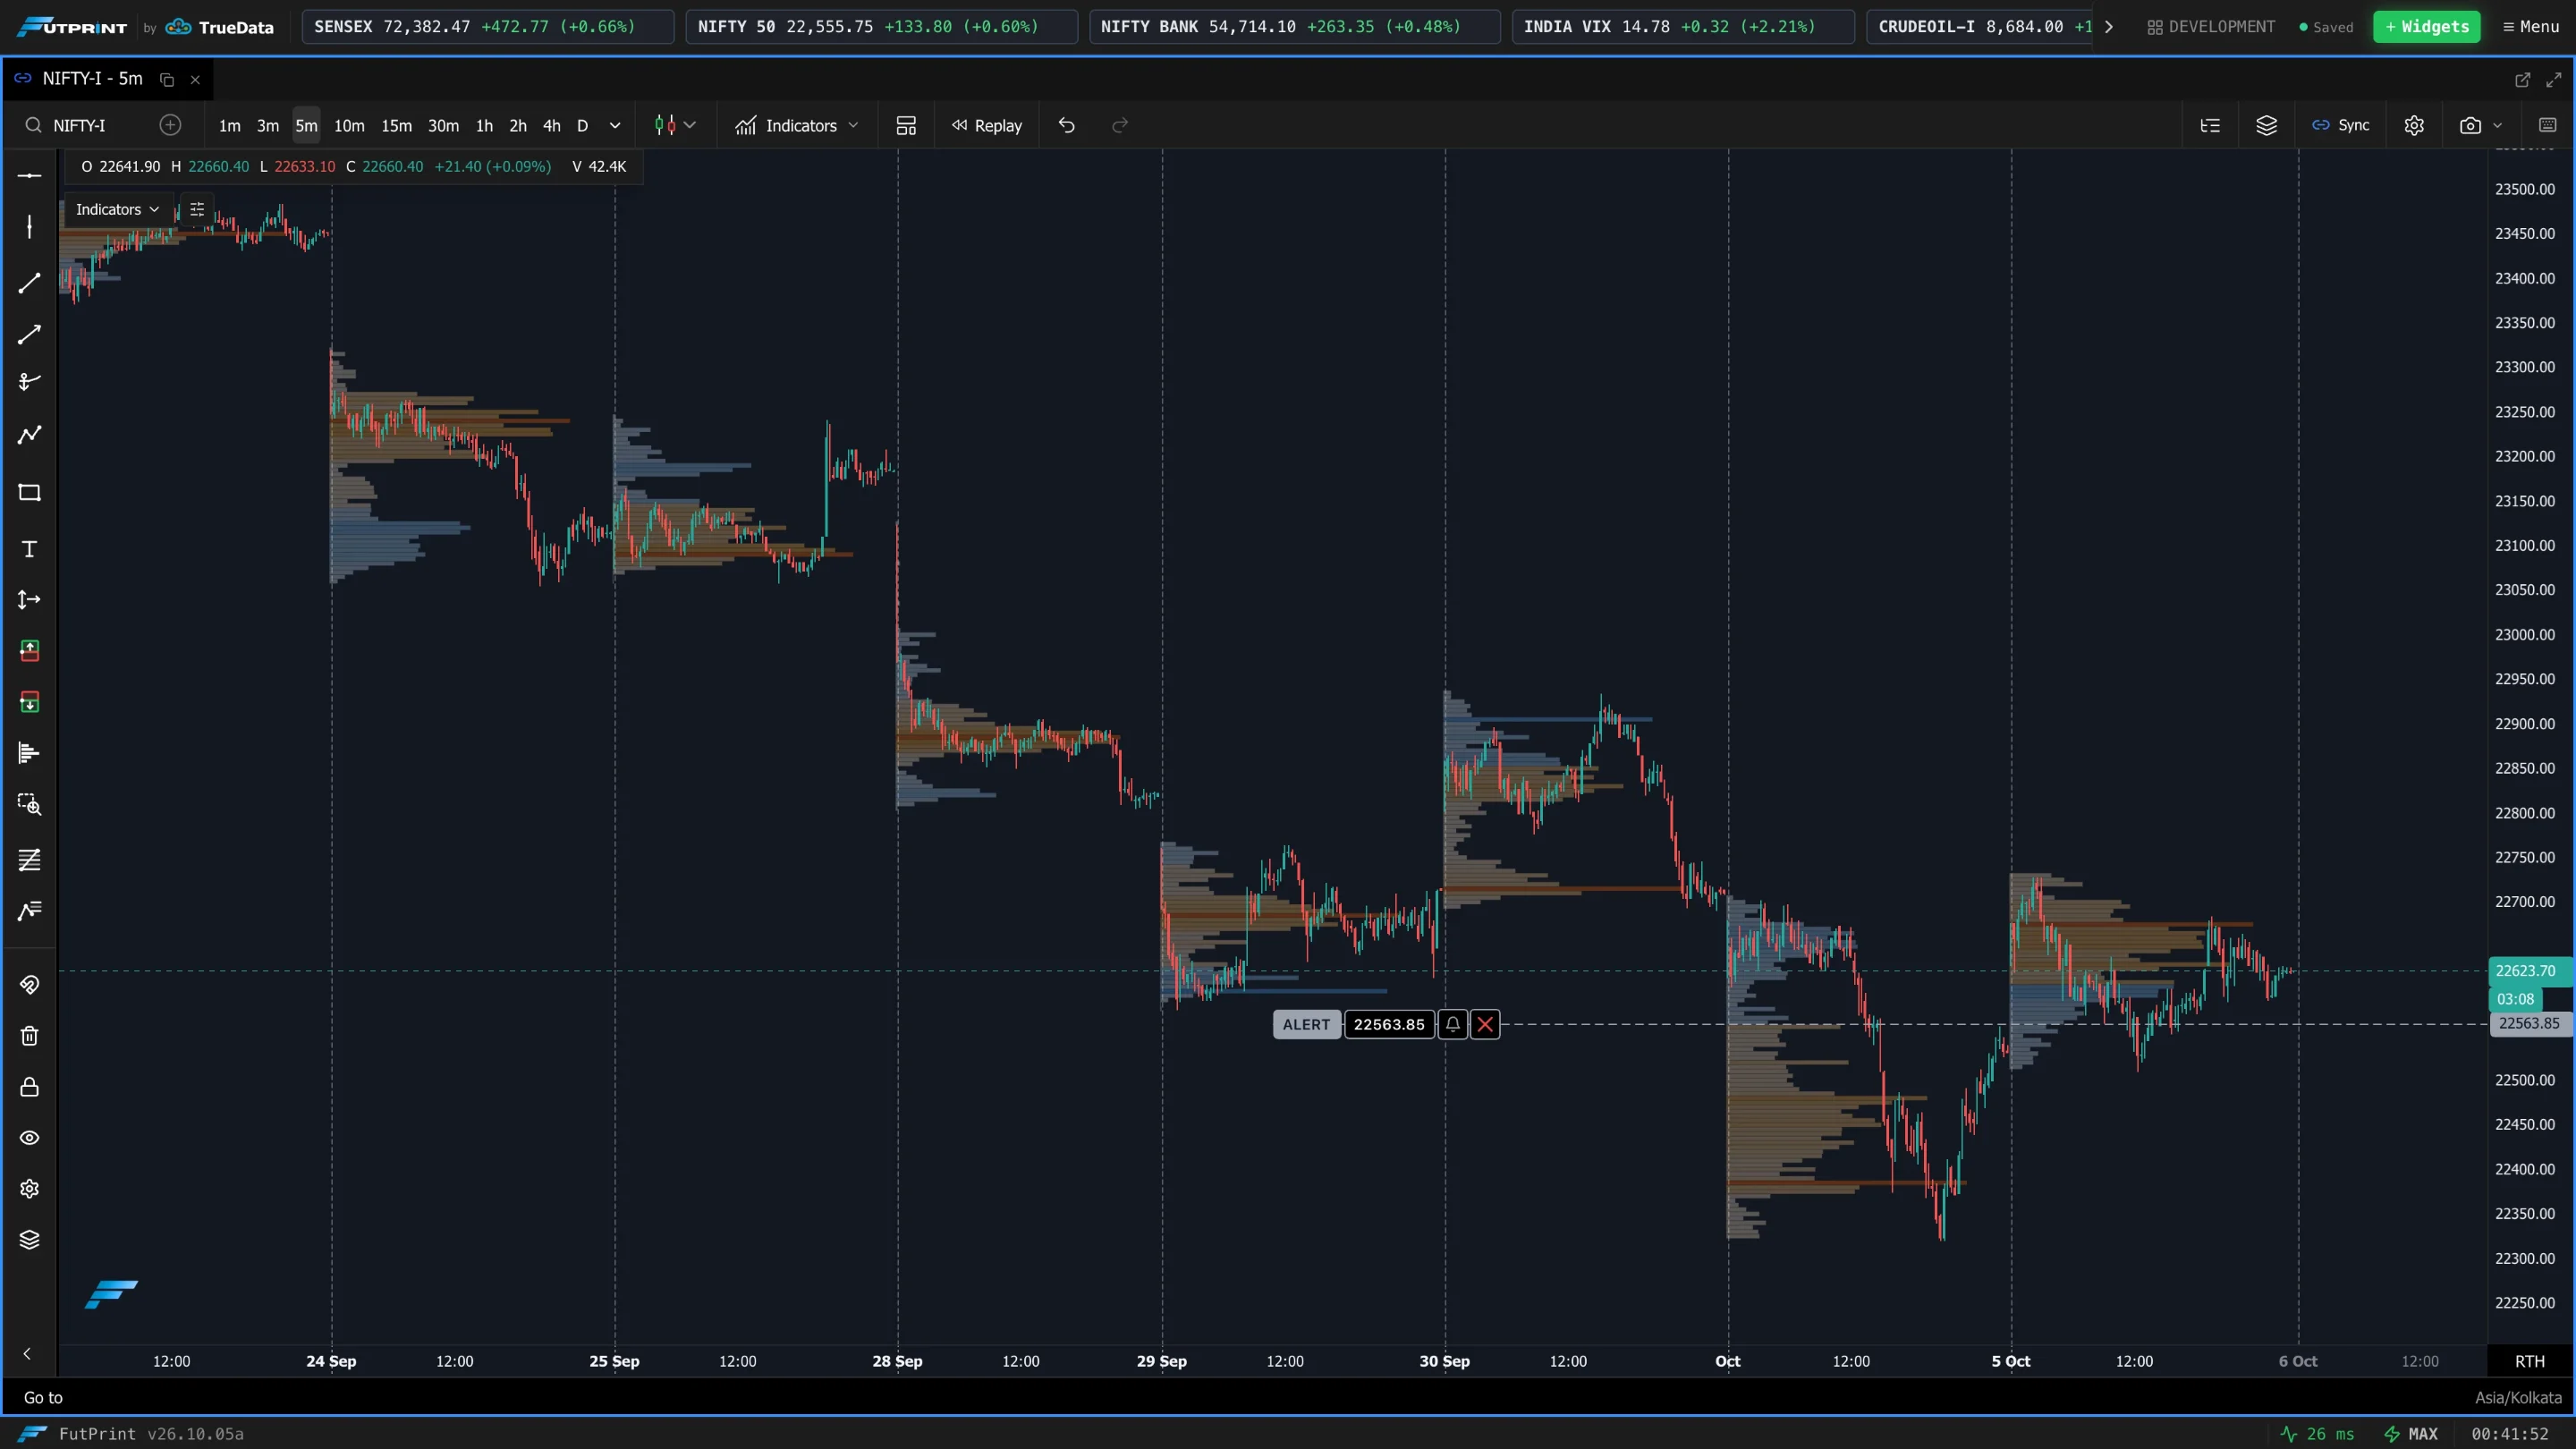
Opacity
How solid the bars are, from 0.1 to 1.
Override Global Bin Size
By default the profile uses the chart's bin size. Turn this on to give the profile its own Bin Size (1 to 1000 ticks): smaller bins give more, finer rows.
Appearance
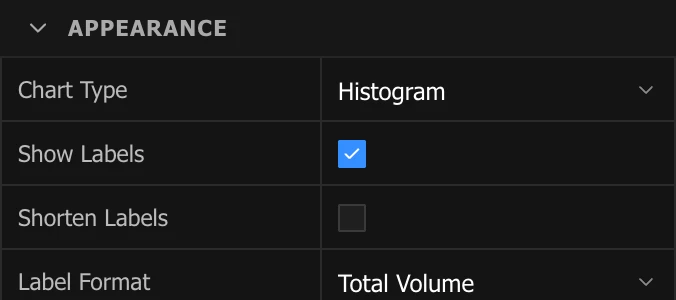
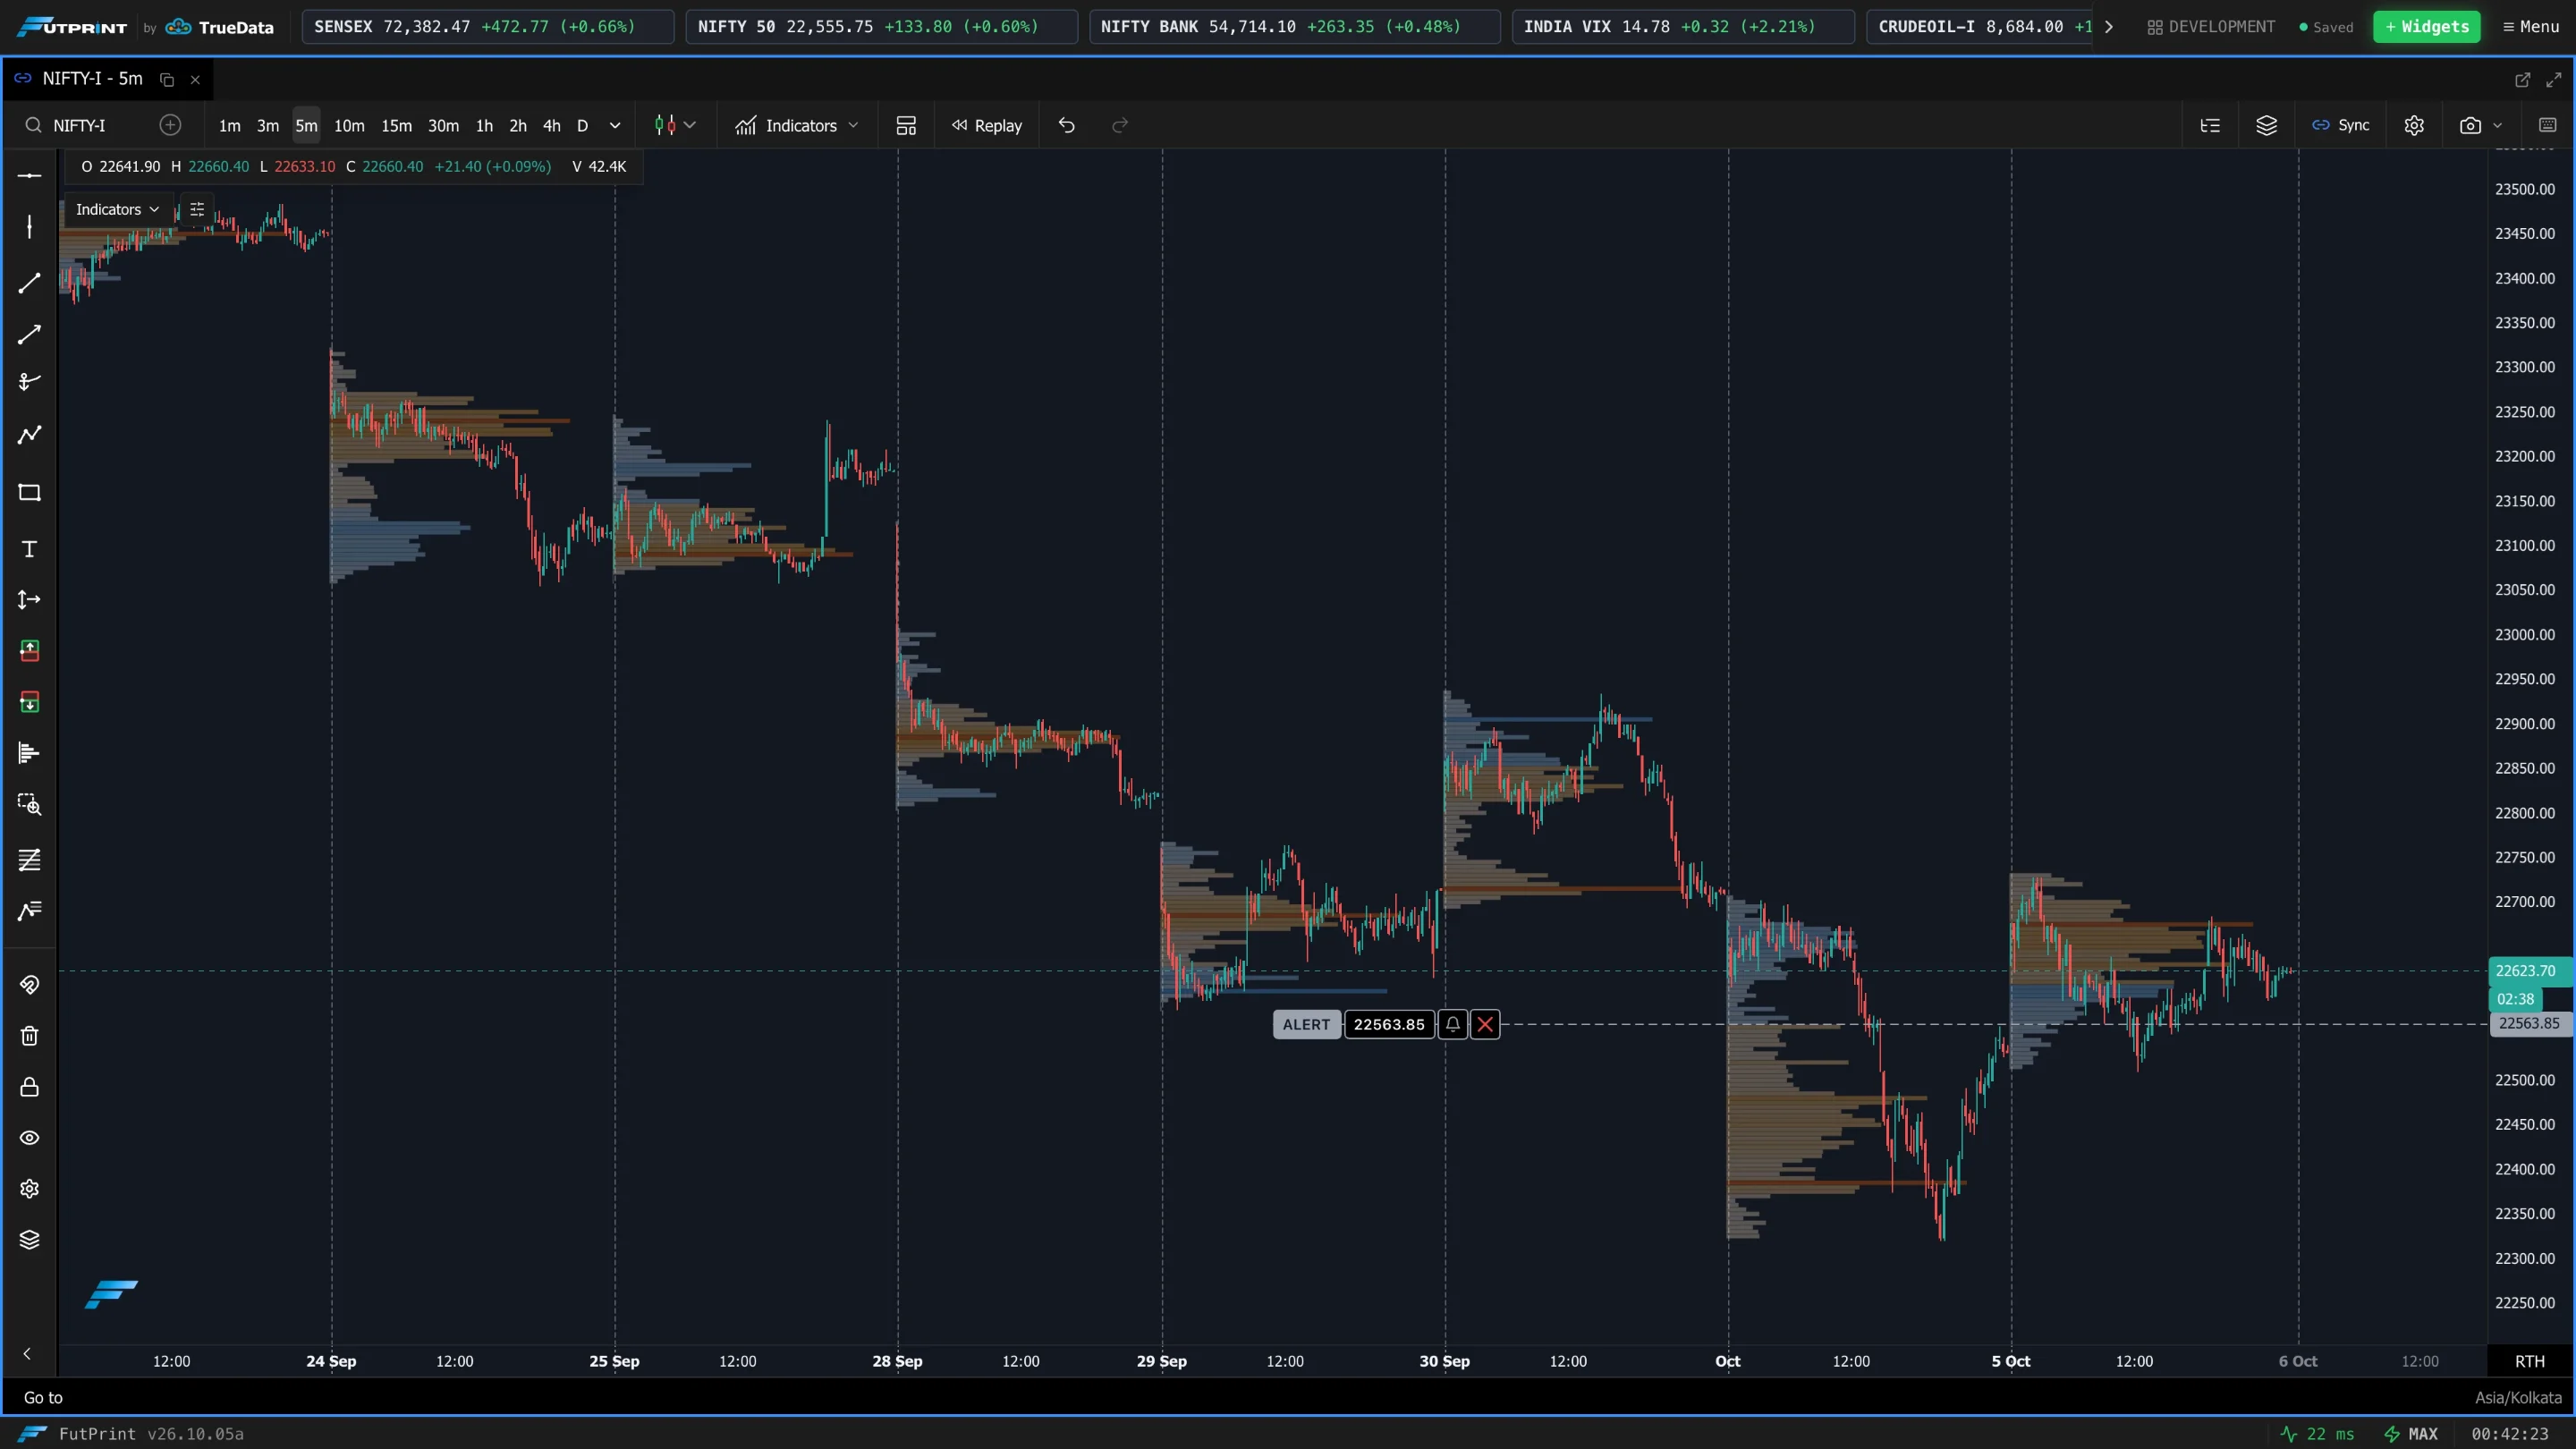
Chart Type
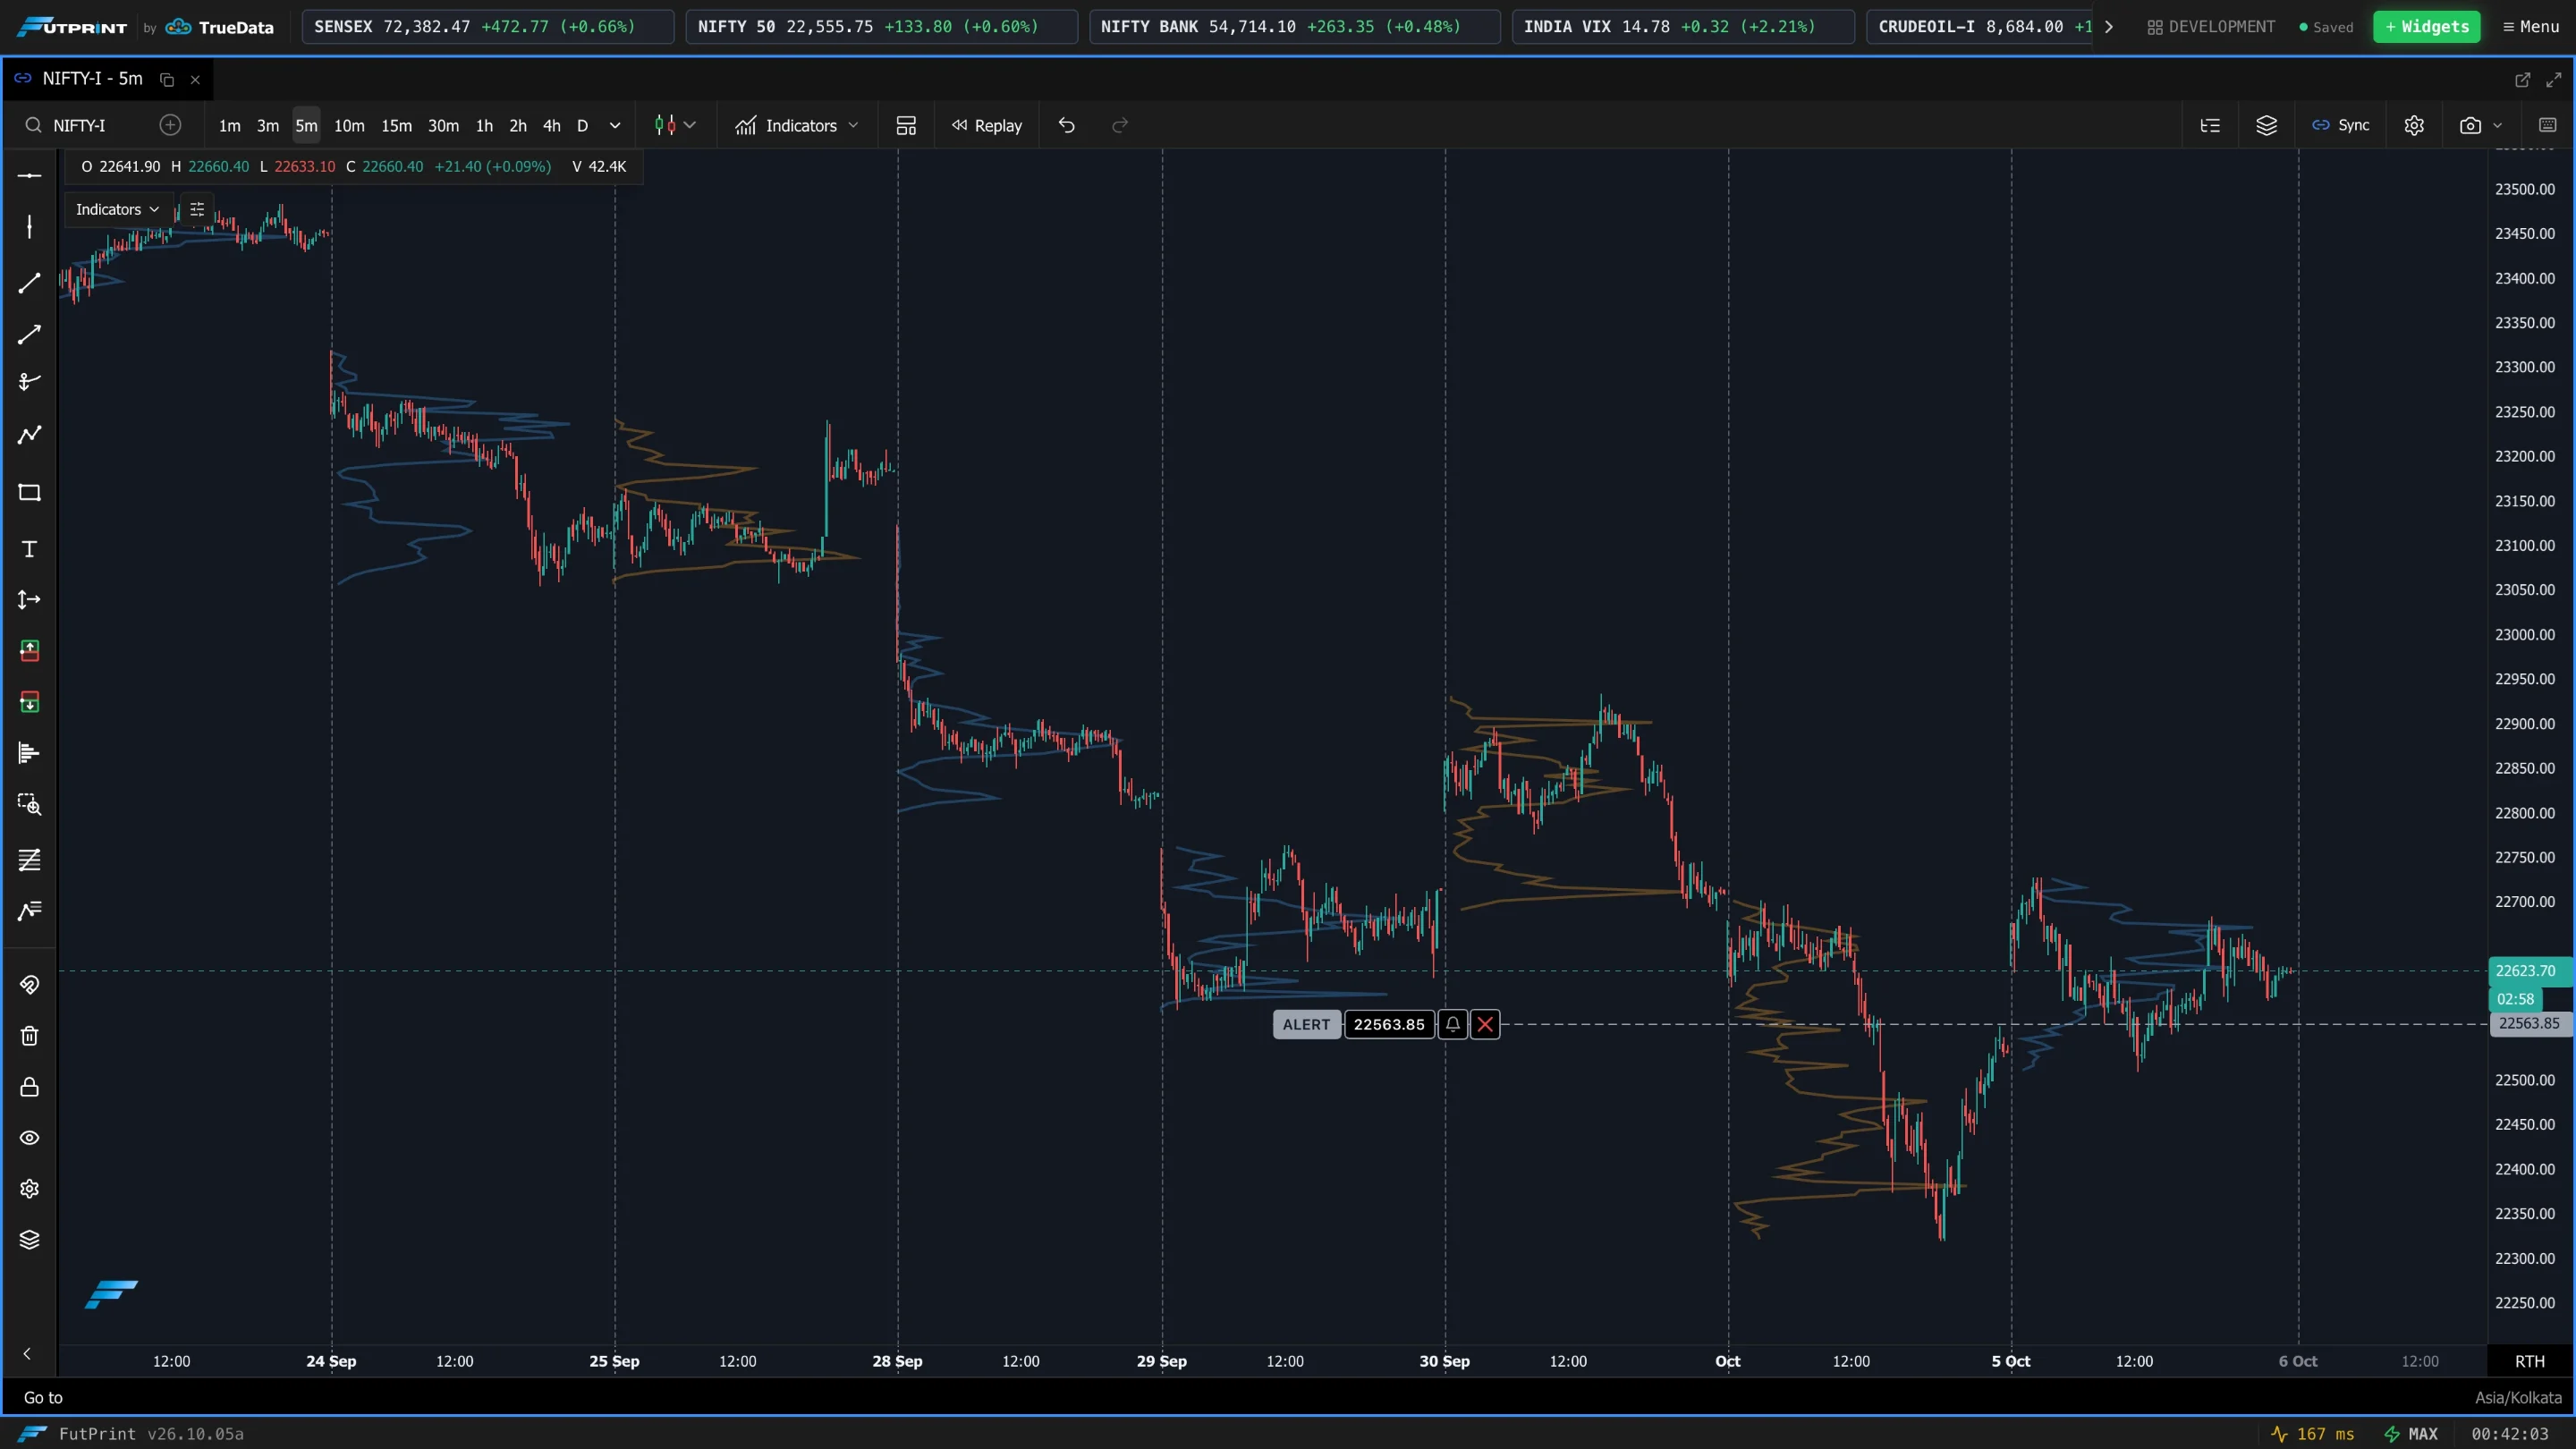
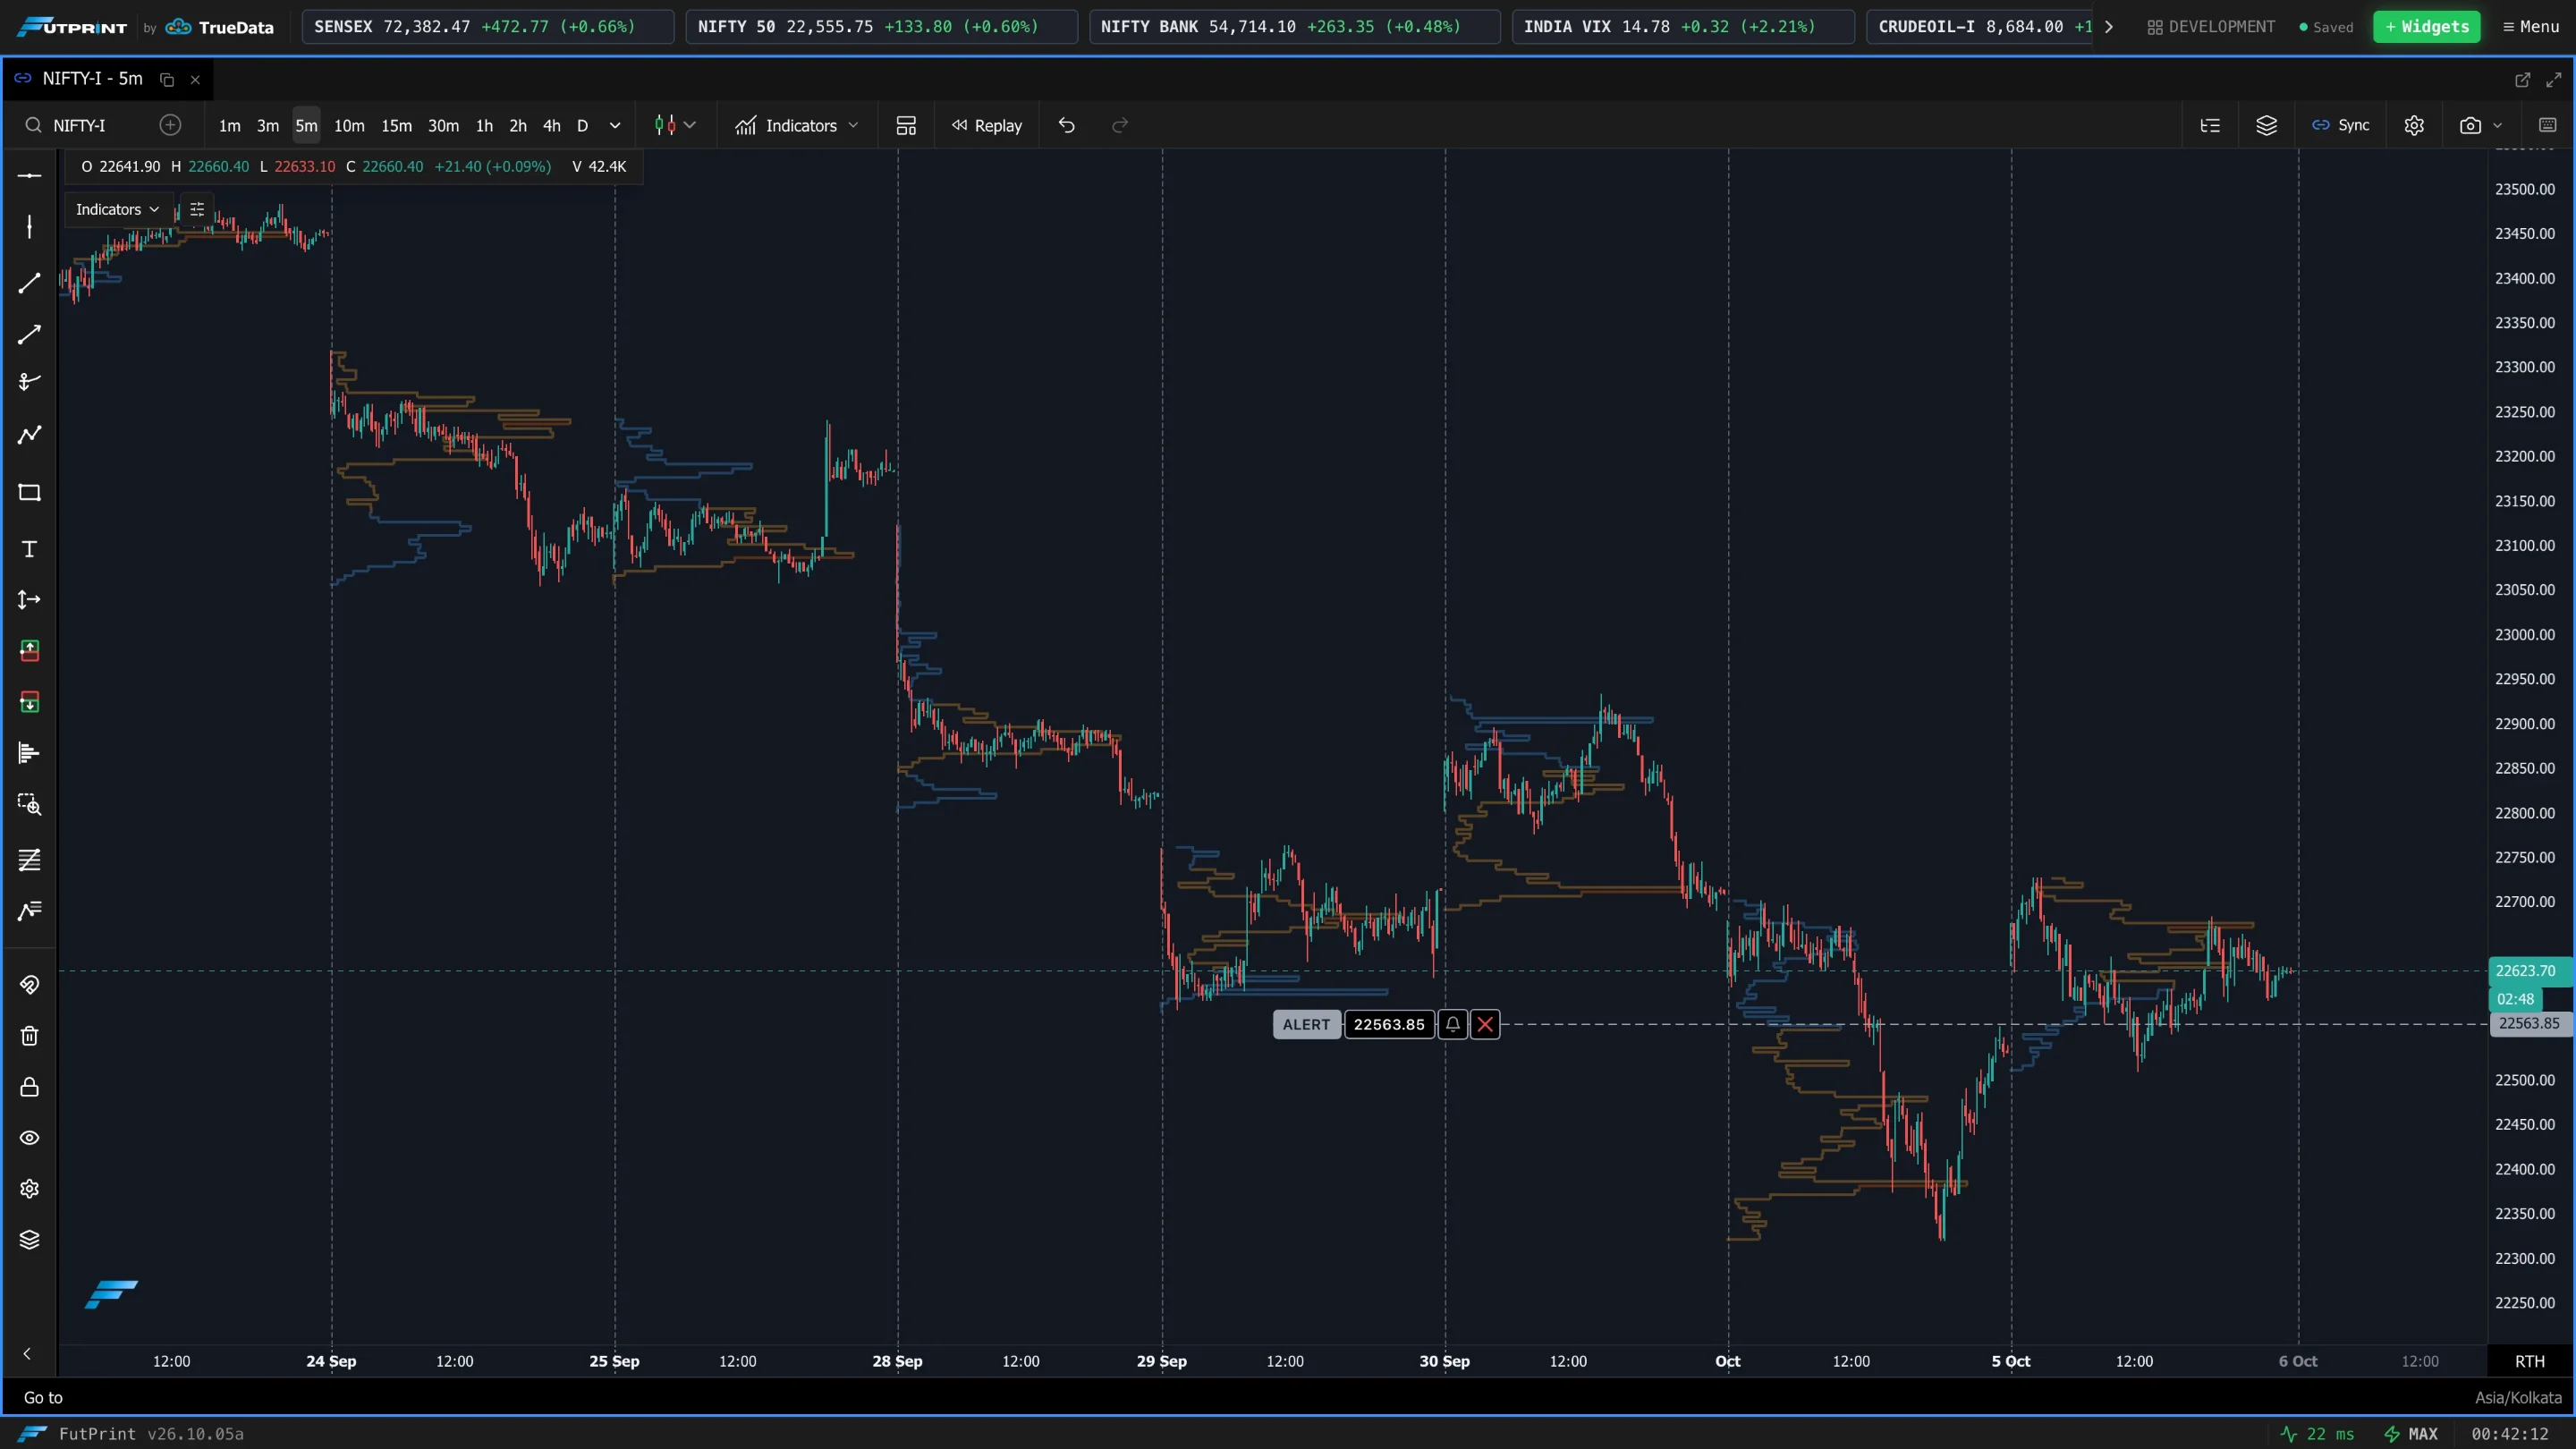
Bid×Ask Display
(Bid X Ask profiles) Stacked (single bar) draws one bar split by the bid:ask ratio; Mirrored (bid/ask split) draws two comparable bars, ask on top and bid below.
Show Labels, Shorten Labels, Label Format
Show Labels prints the value on the bars. Shorten Labels abbreviates them. Label Format (Single Sided) chooses what is printed: Total Volume, Bid X Ask or Delta.
Show Session
Shows the session boundary for each profile.
Colours
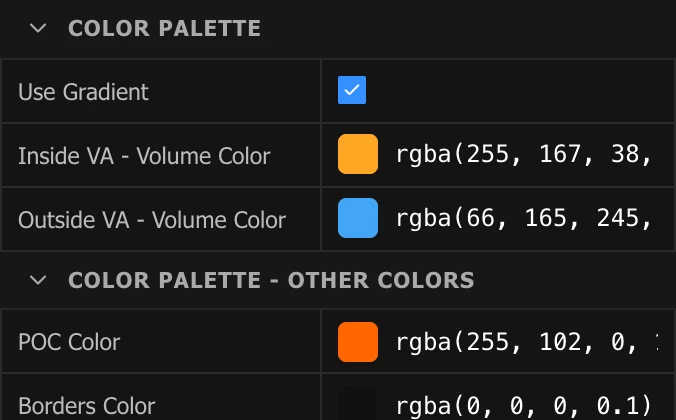
- Use Gradient shades each bar between the selected colour (highest value) and a lighter tint (lowest value), by its relative volume, delta or bid-ask value.
- Inside VA and Outside VA colours set the bars inside and outside the value area. Volume profiles use a single Volume Color for each; Delta and Bid X Ask profiles use an Up Color and a Down Color for each.
- POC Color, Borders Color and Text Color set the POC bar, the bar outlines and the labels.
POC Line
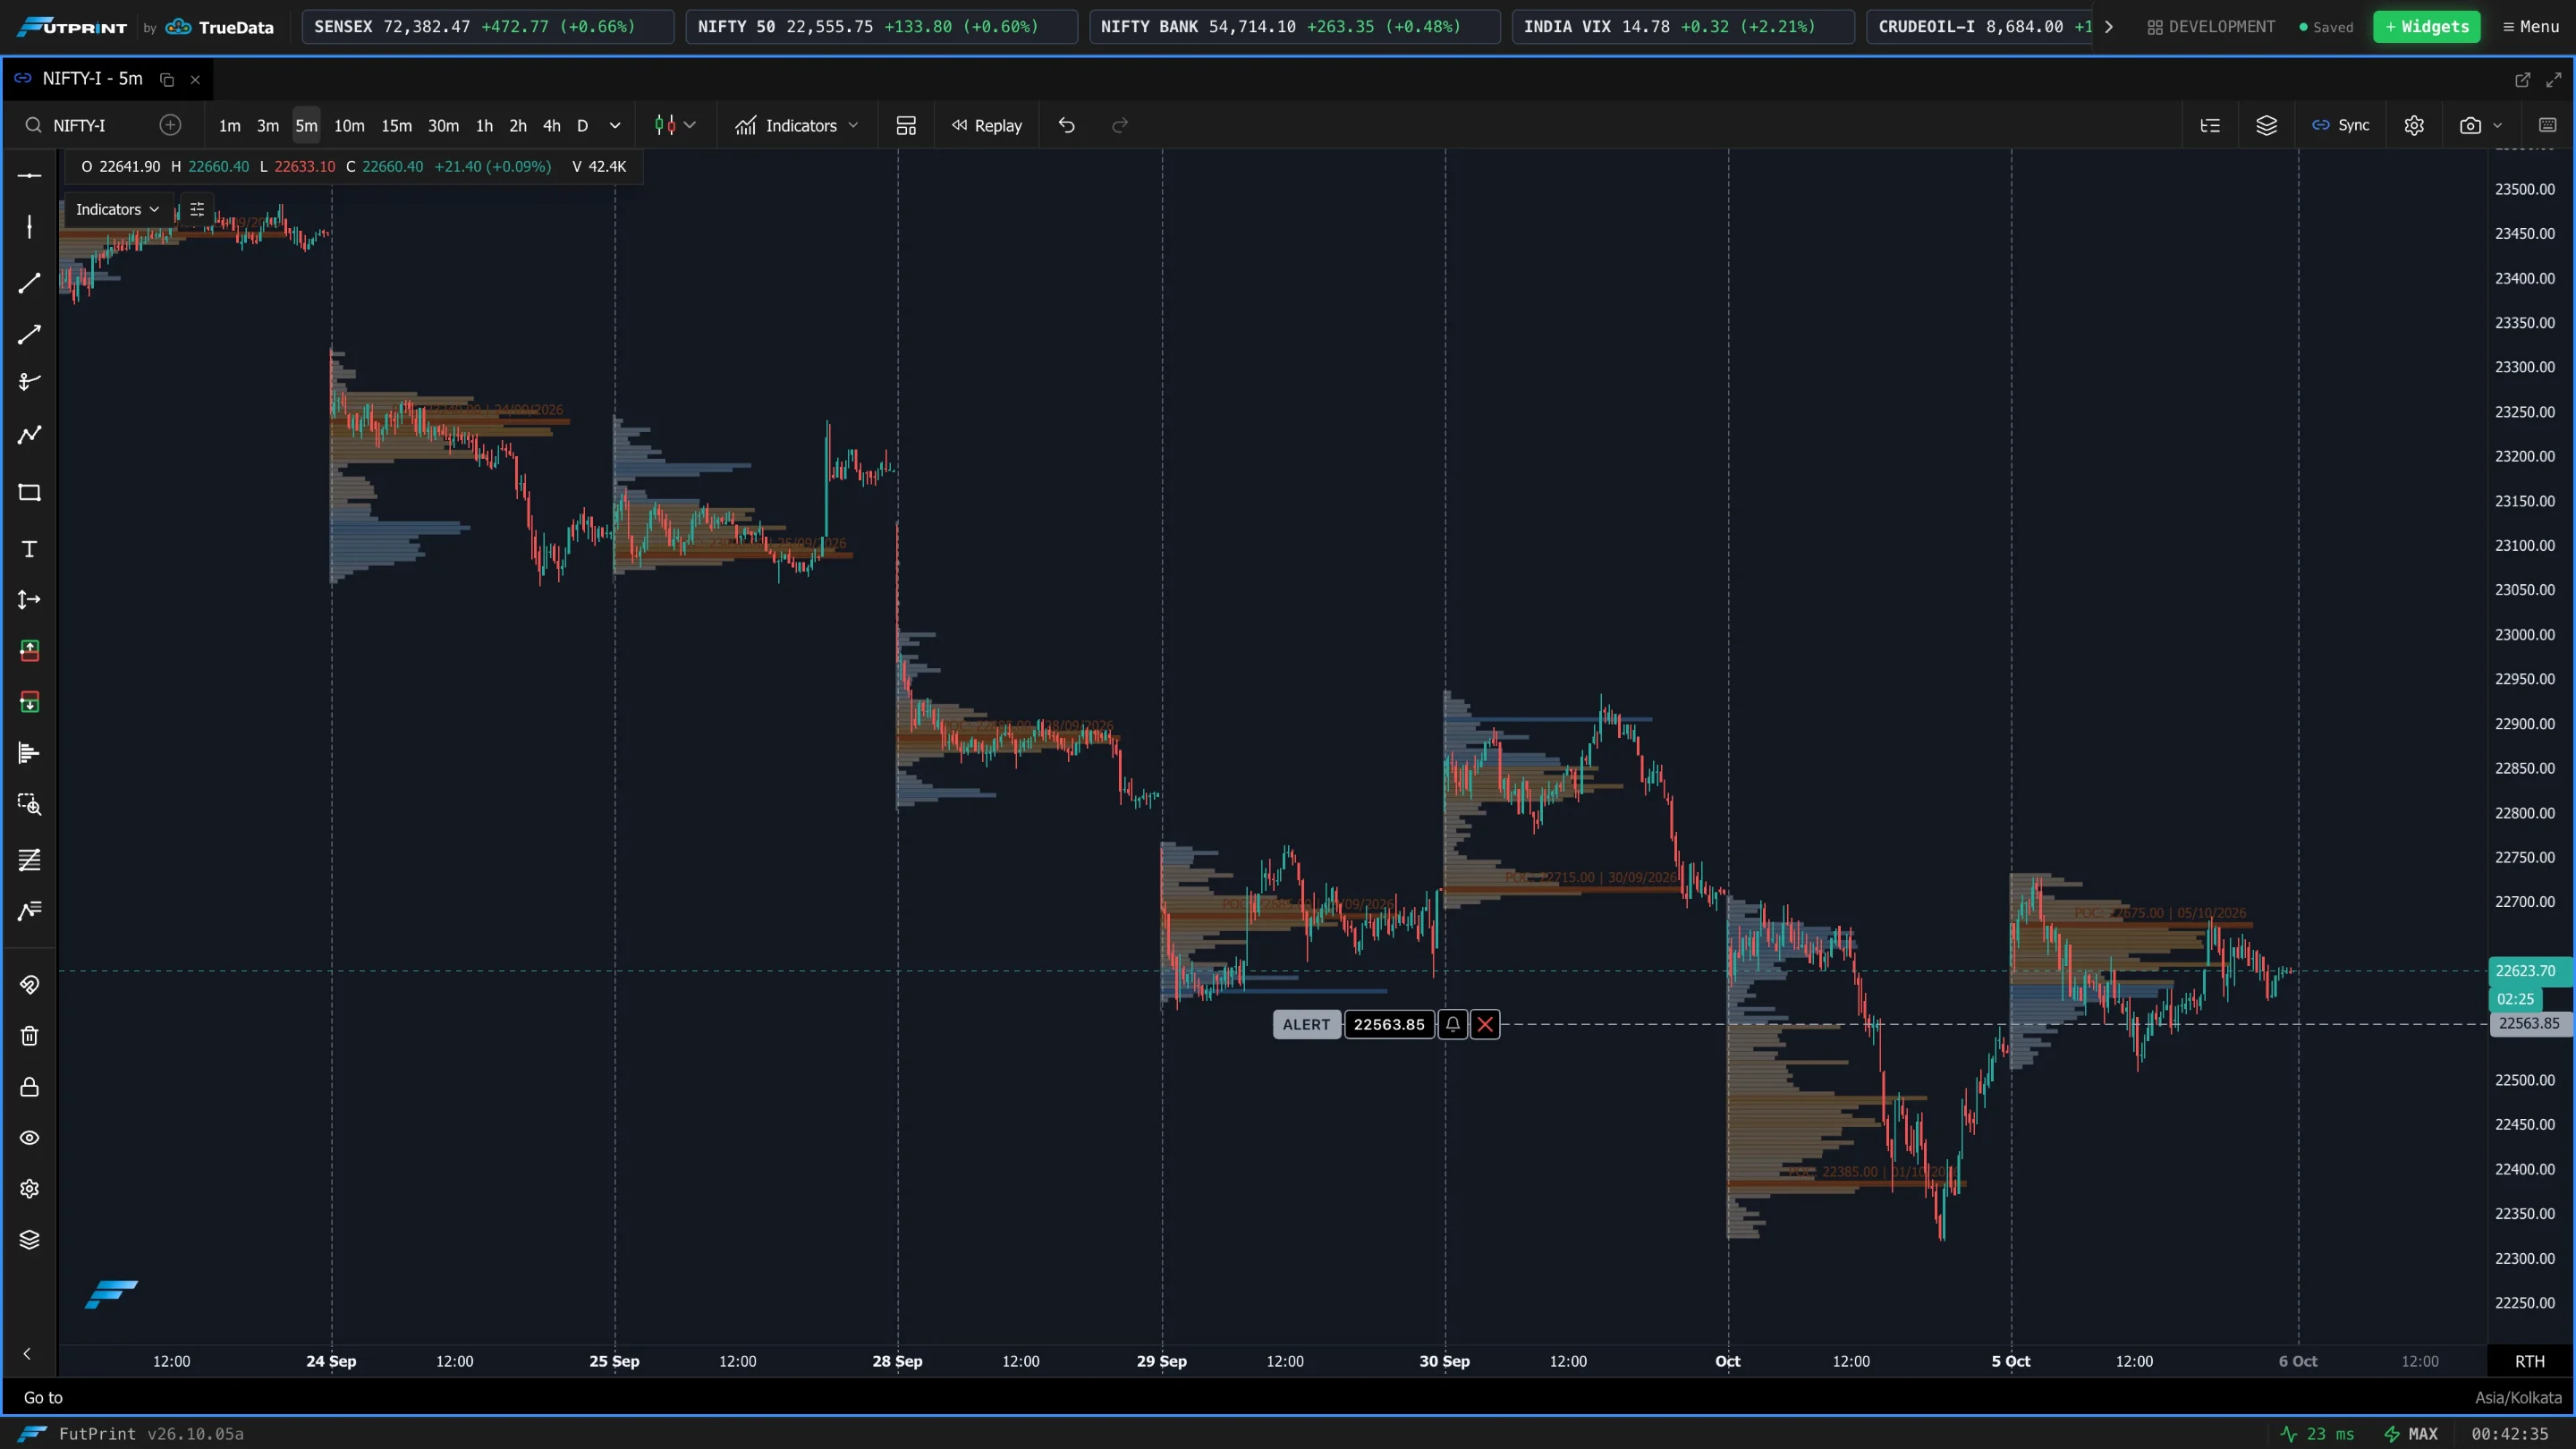
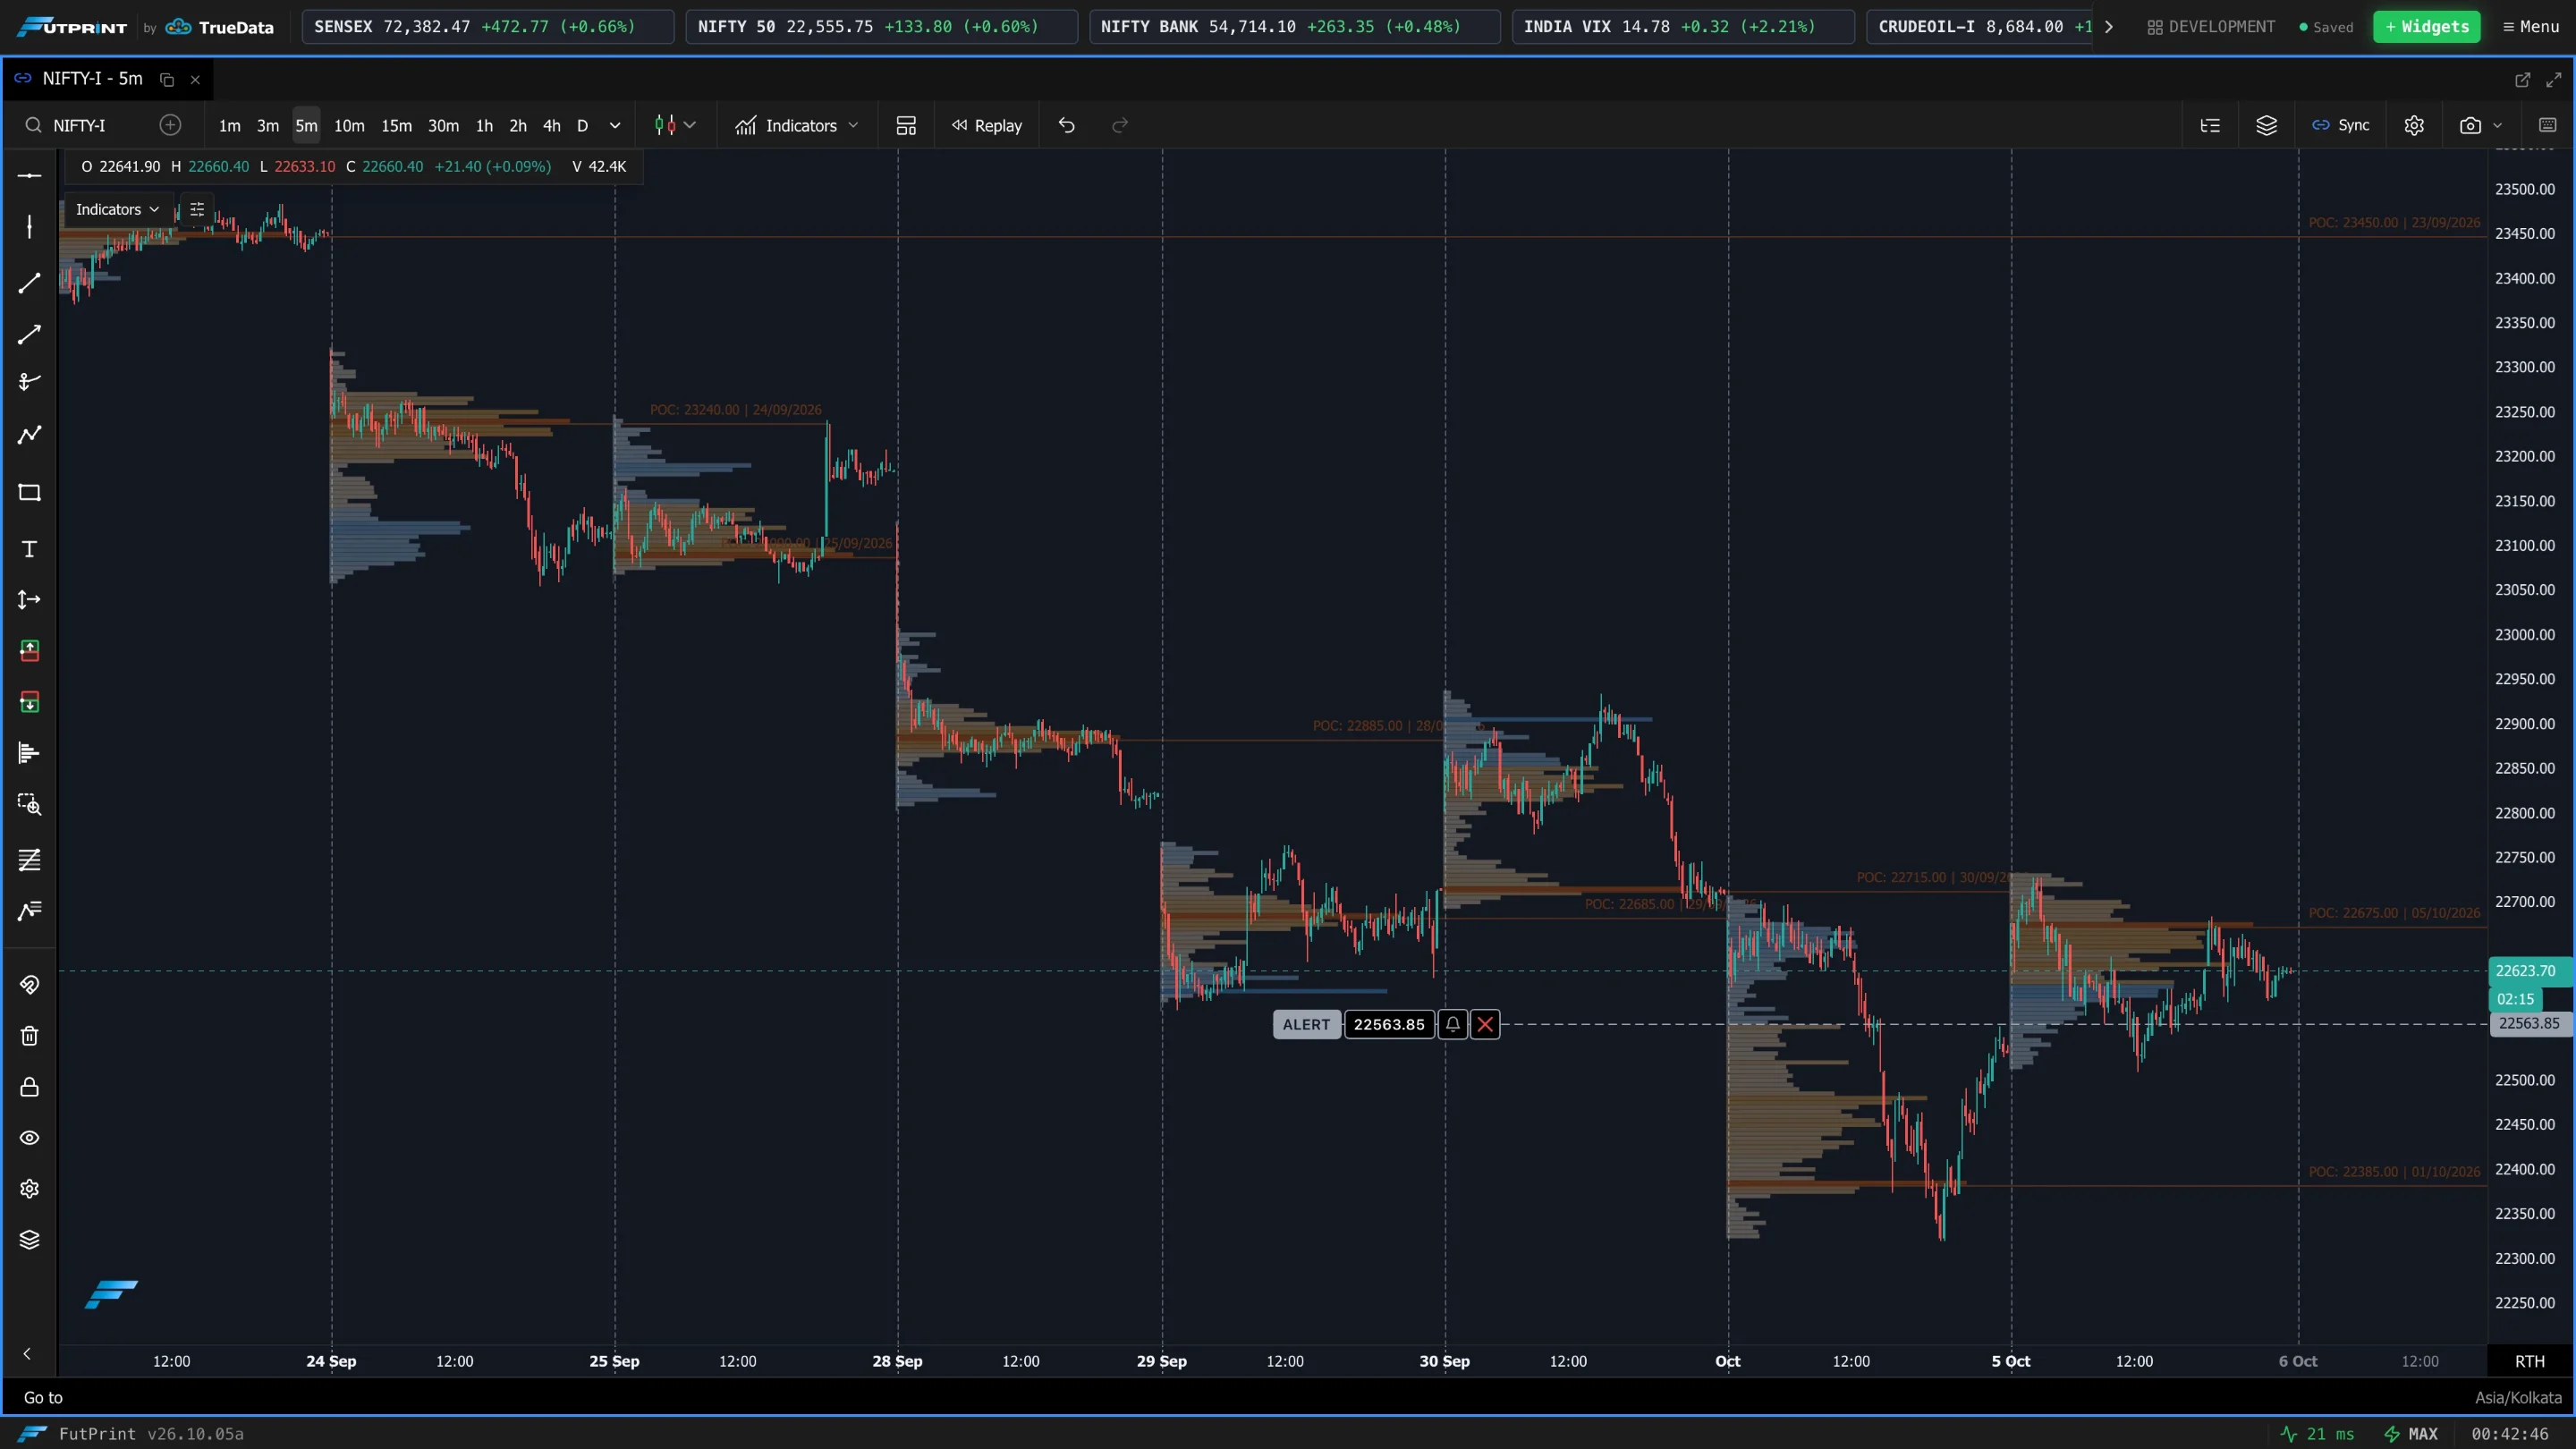
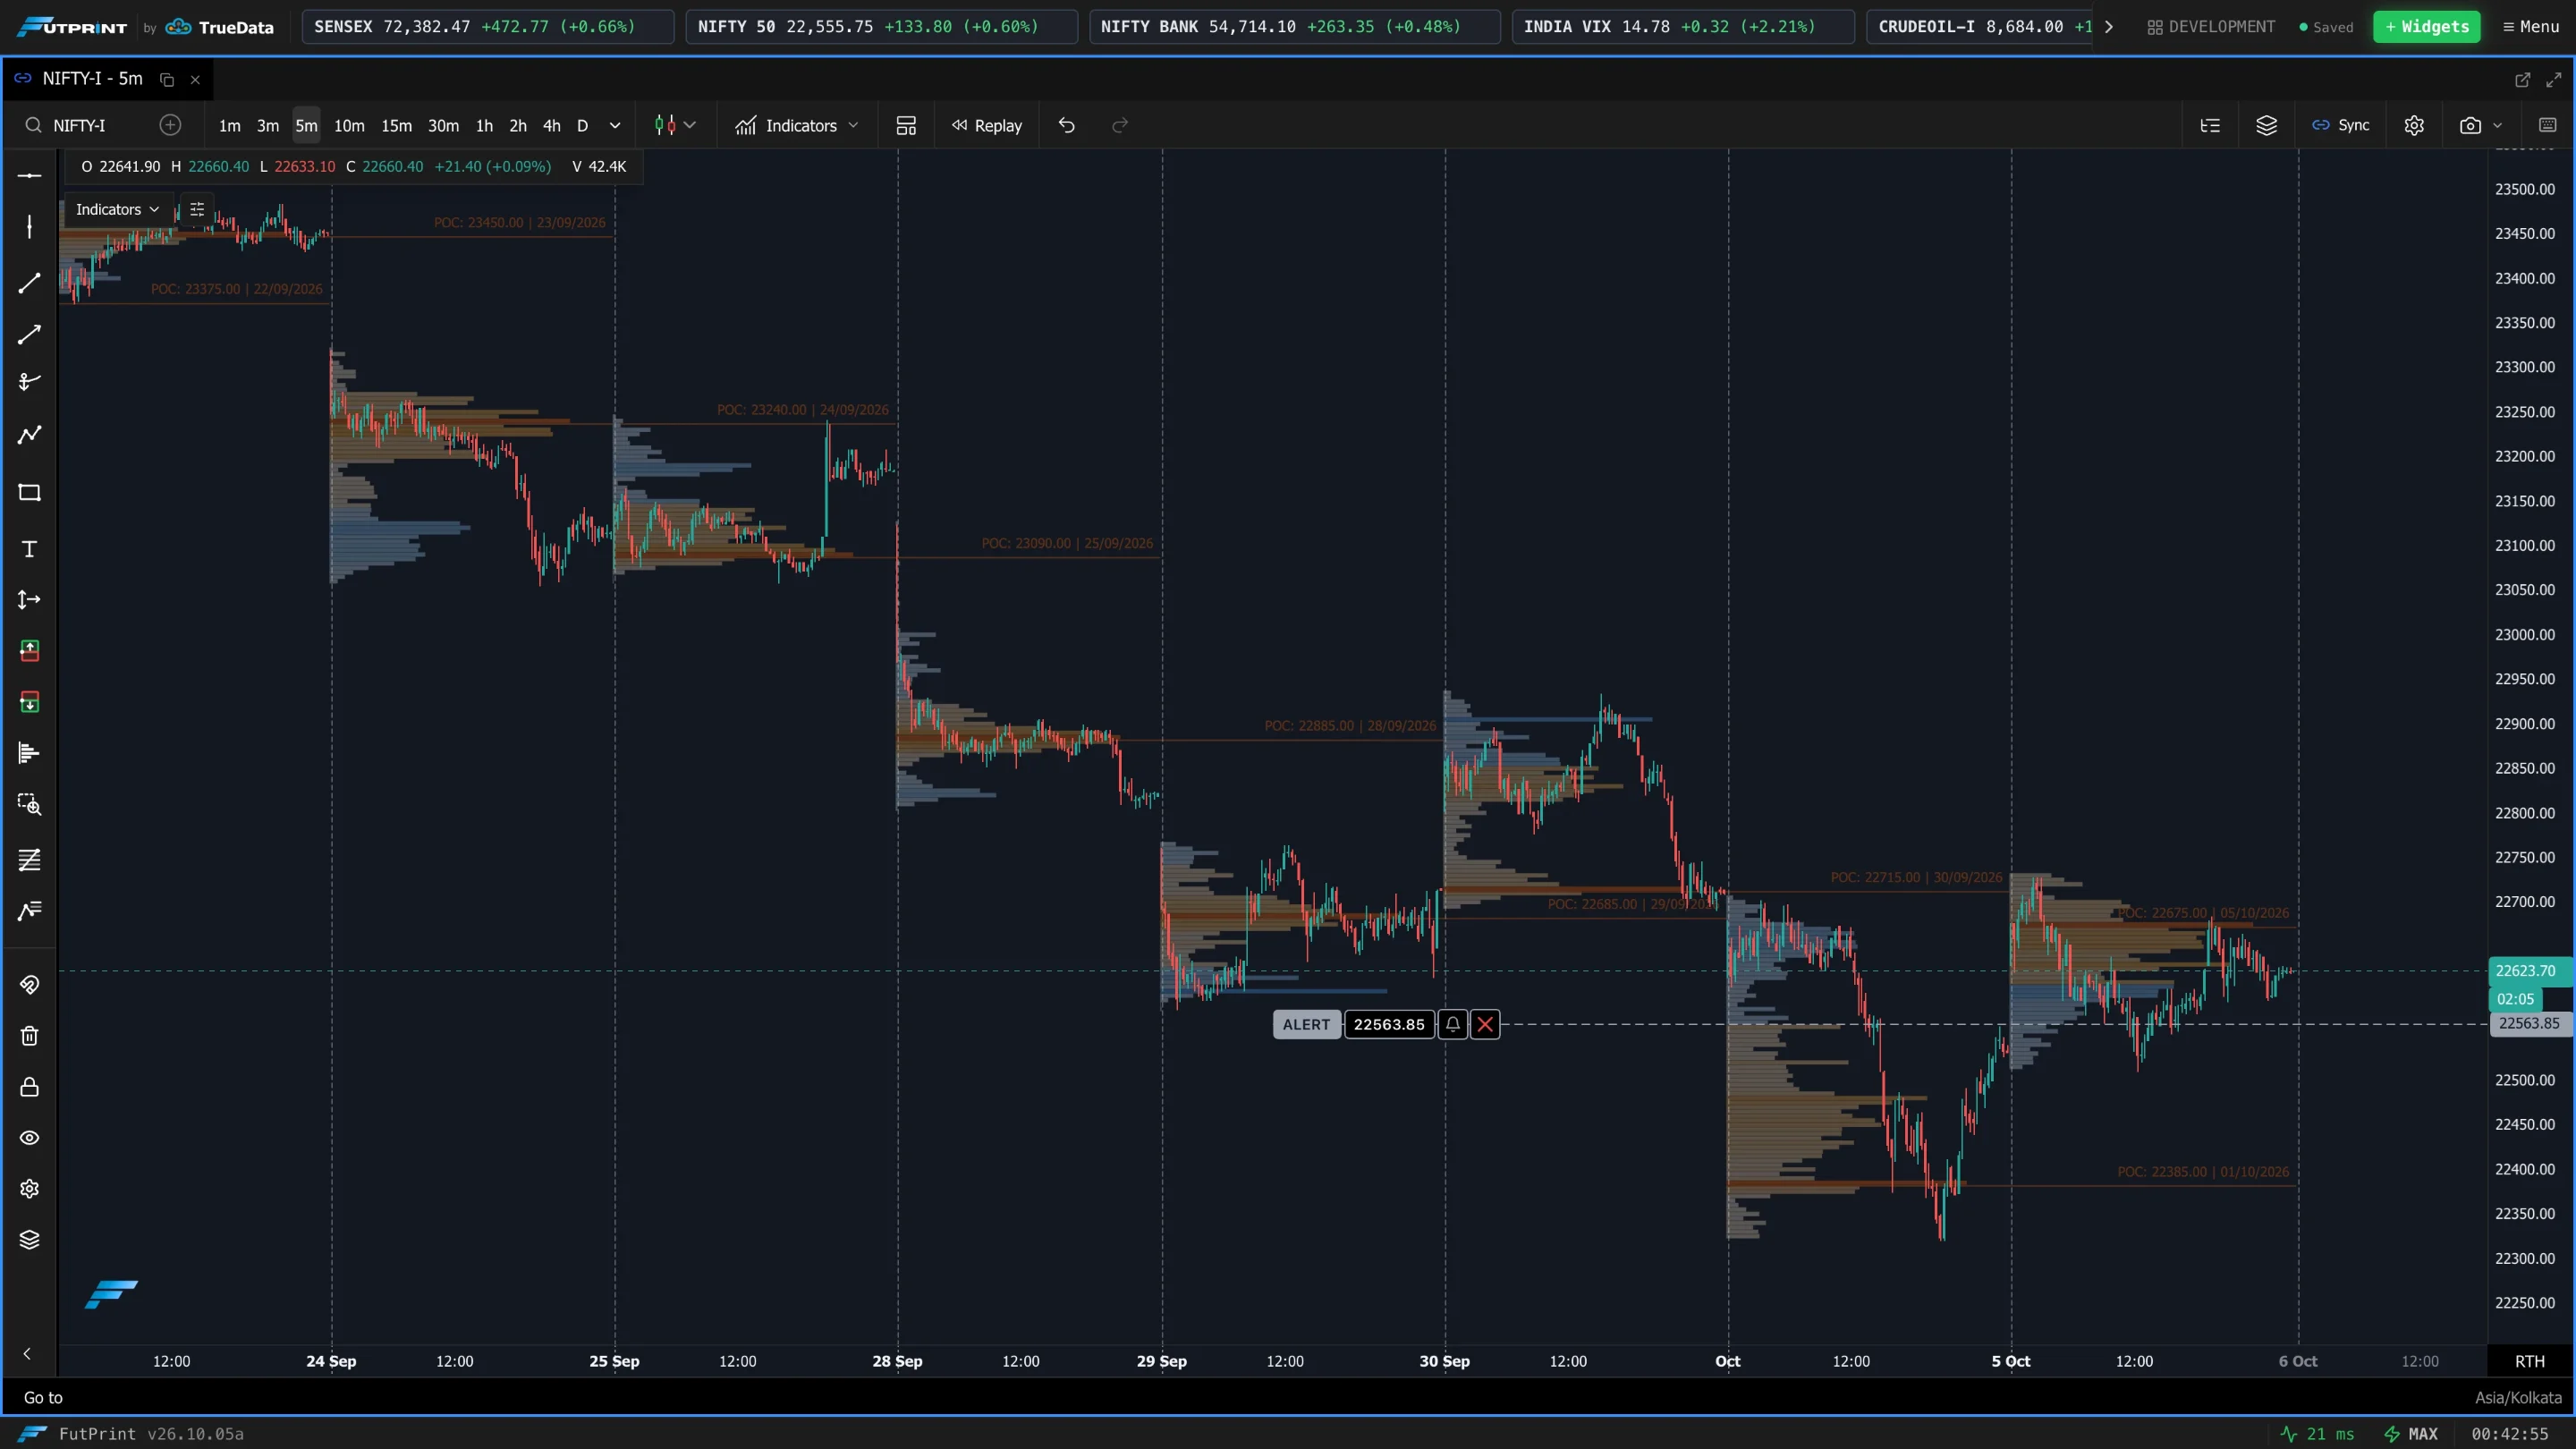
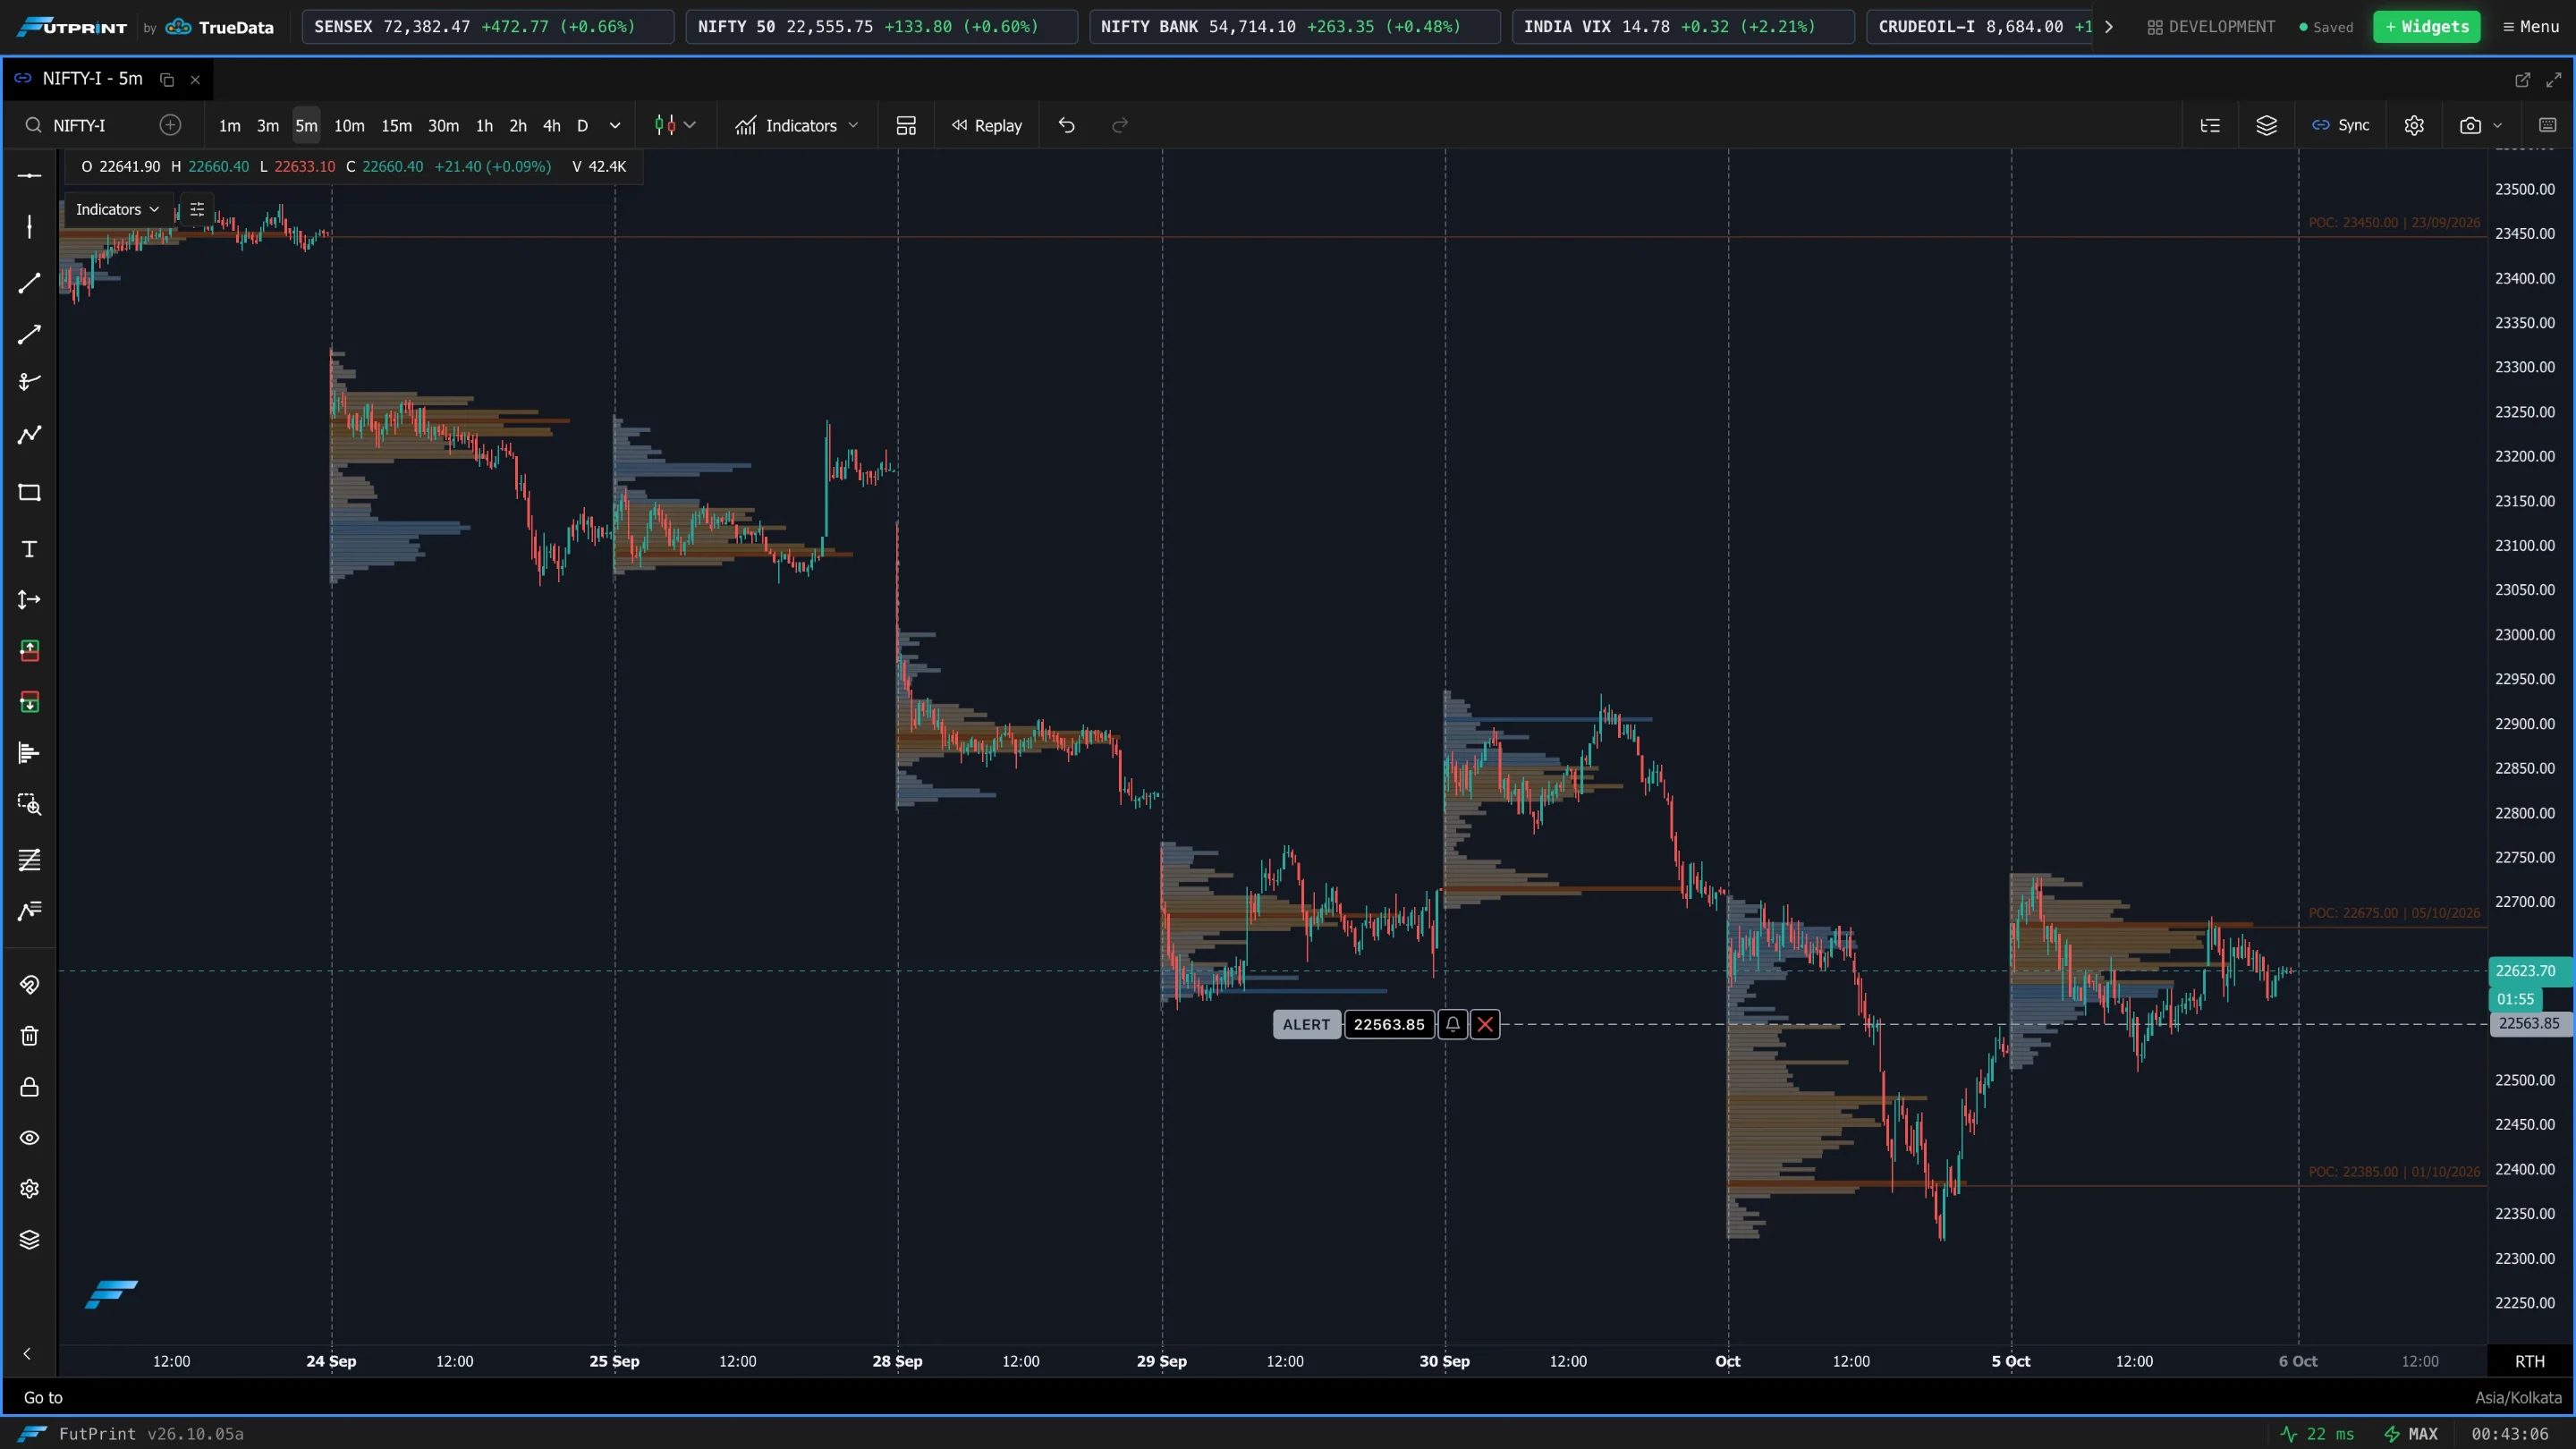
Draws a line at each profile's point of control.
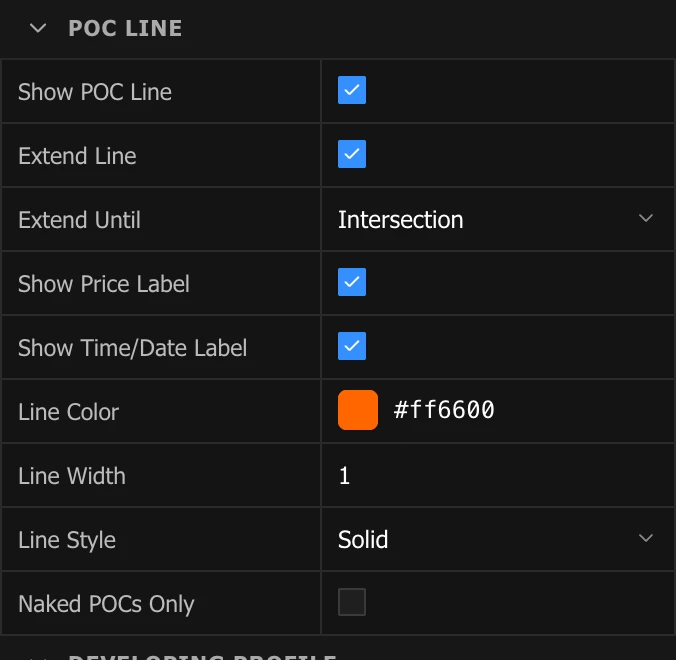
| Setting | What it does |
|---|---|
| Show POC Line | Turn the POC line on. |
| Extend Line | Carry the line forward beyond its own period. |
| Extend Until | Intersection stops the line where price first revisits it. Session End runs it through the end of the trading session after the profile. |
| Show Price Label | Print the POC price on the line. |
| Show Time/Date Label | Add the profile's date to the label. |
| Line Color / Width / Style | Appearance; style is Solid, Dashed or Dotted. |
| Naked POCs Only | Only show extended lines for prior sessions whose POC has never been revisited by price since it formed. |
VA Line
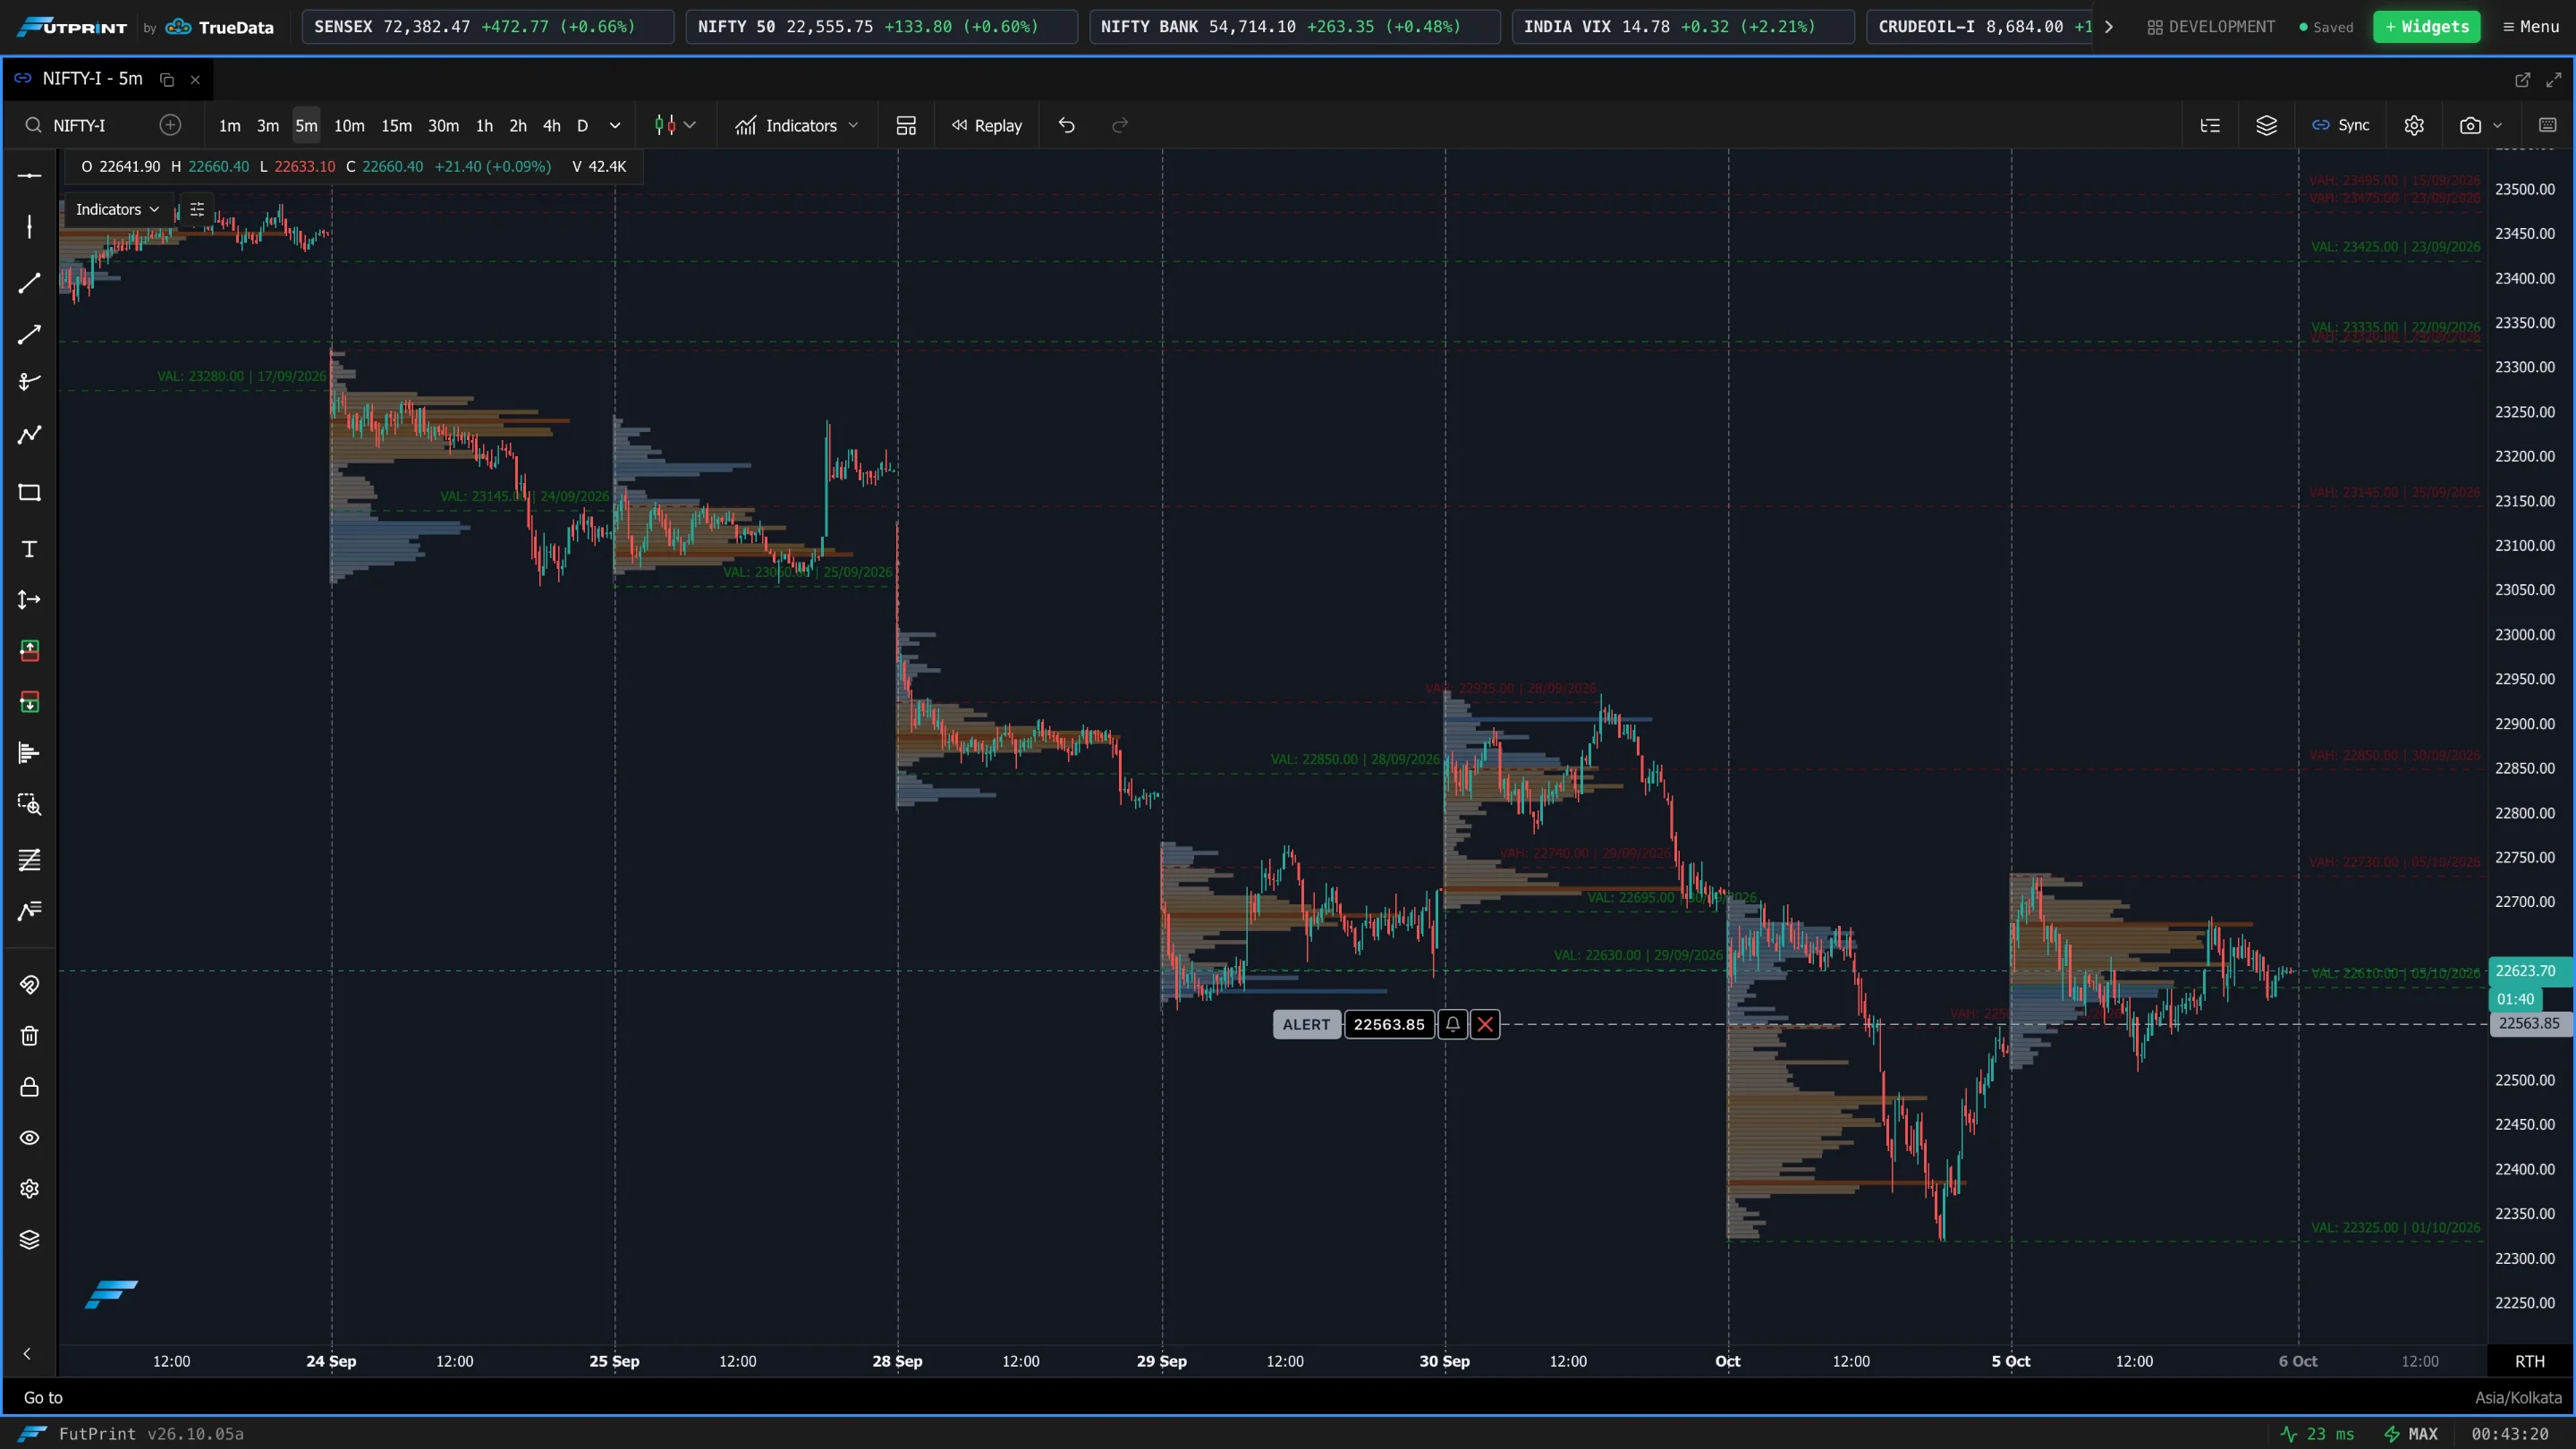
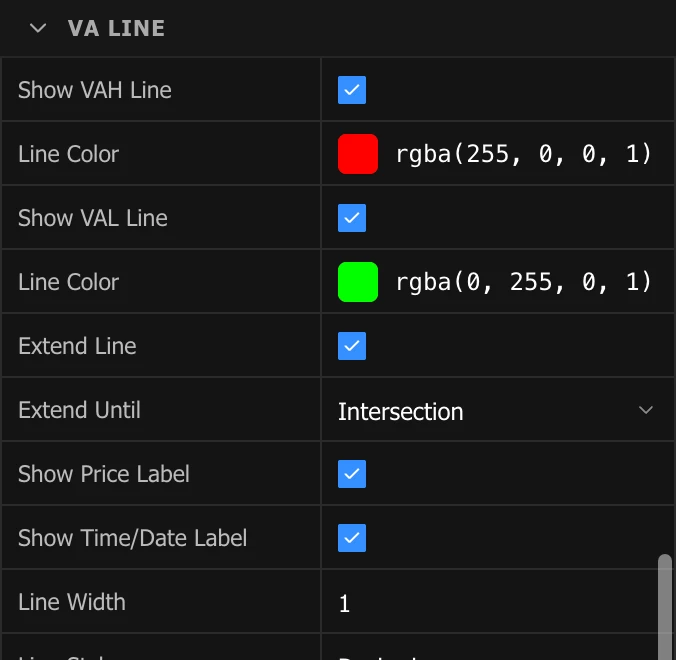
Draws lines at the value-area edges. Show VAH Line and Show VAL Line are switched on separately, each with its own colour. The remaining options — Extend Line, Extend Until, Show Price Label, Show Time/Date Label, Line Width and Line Style — are shared by both and work as they do for the POC line.
Developing Profile
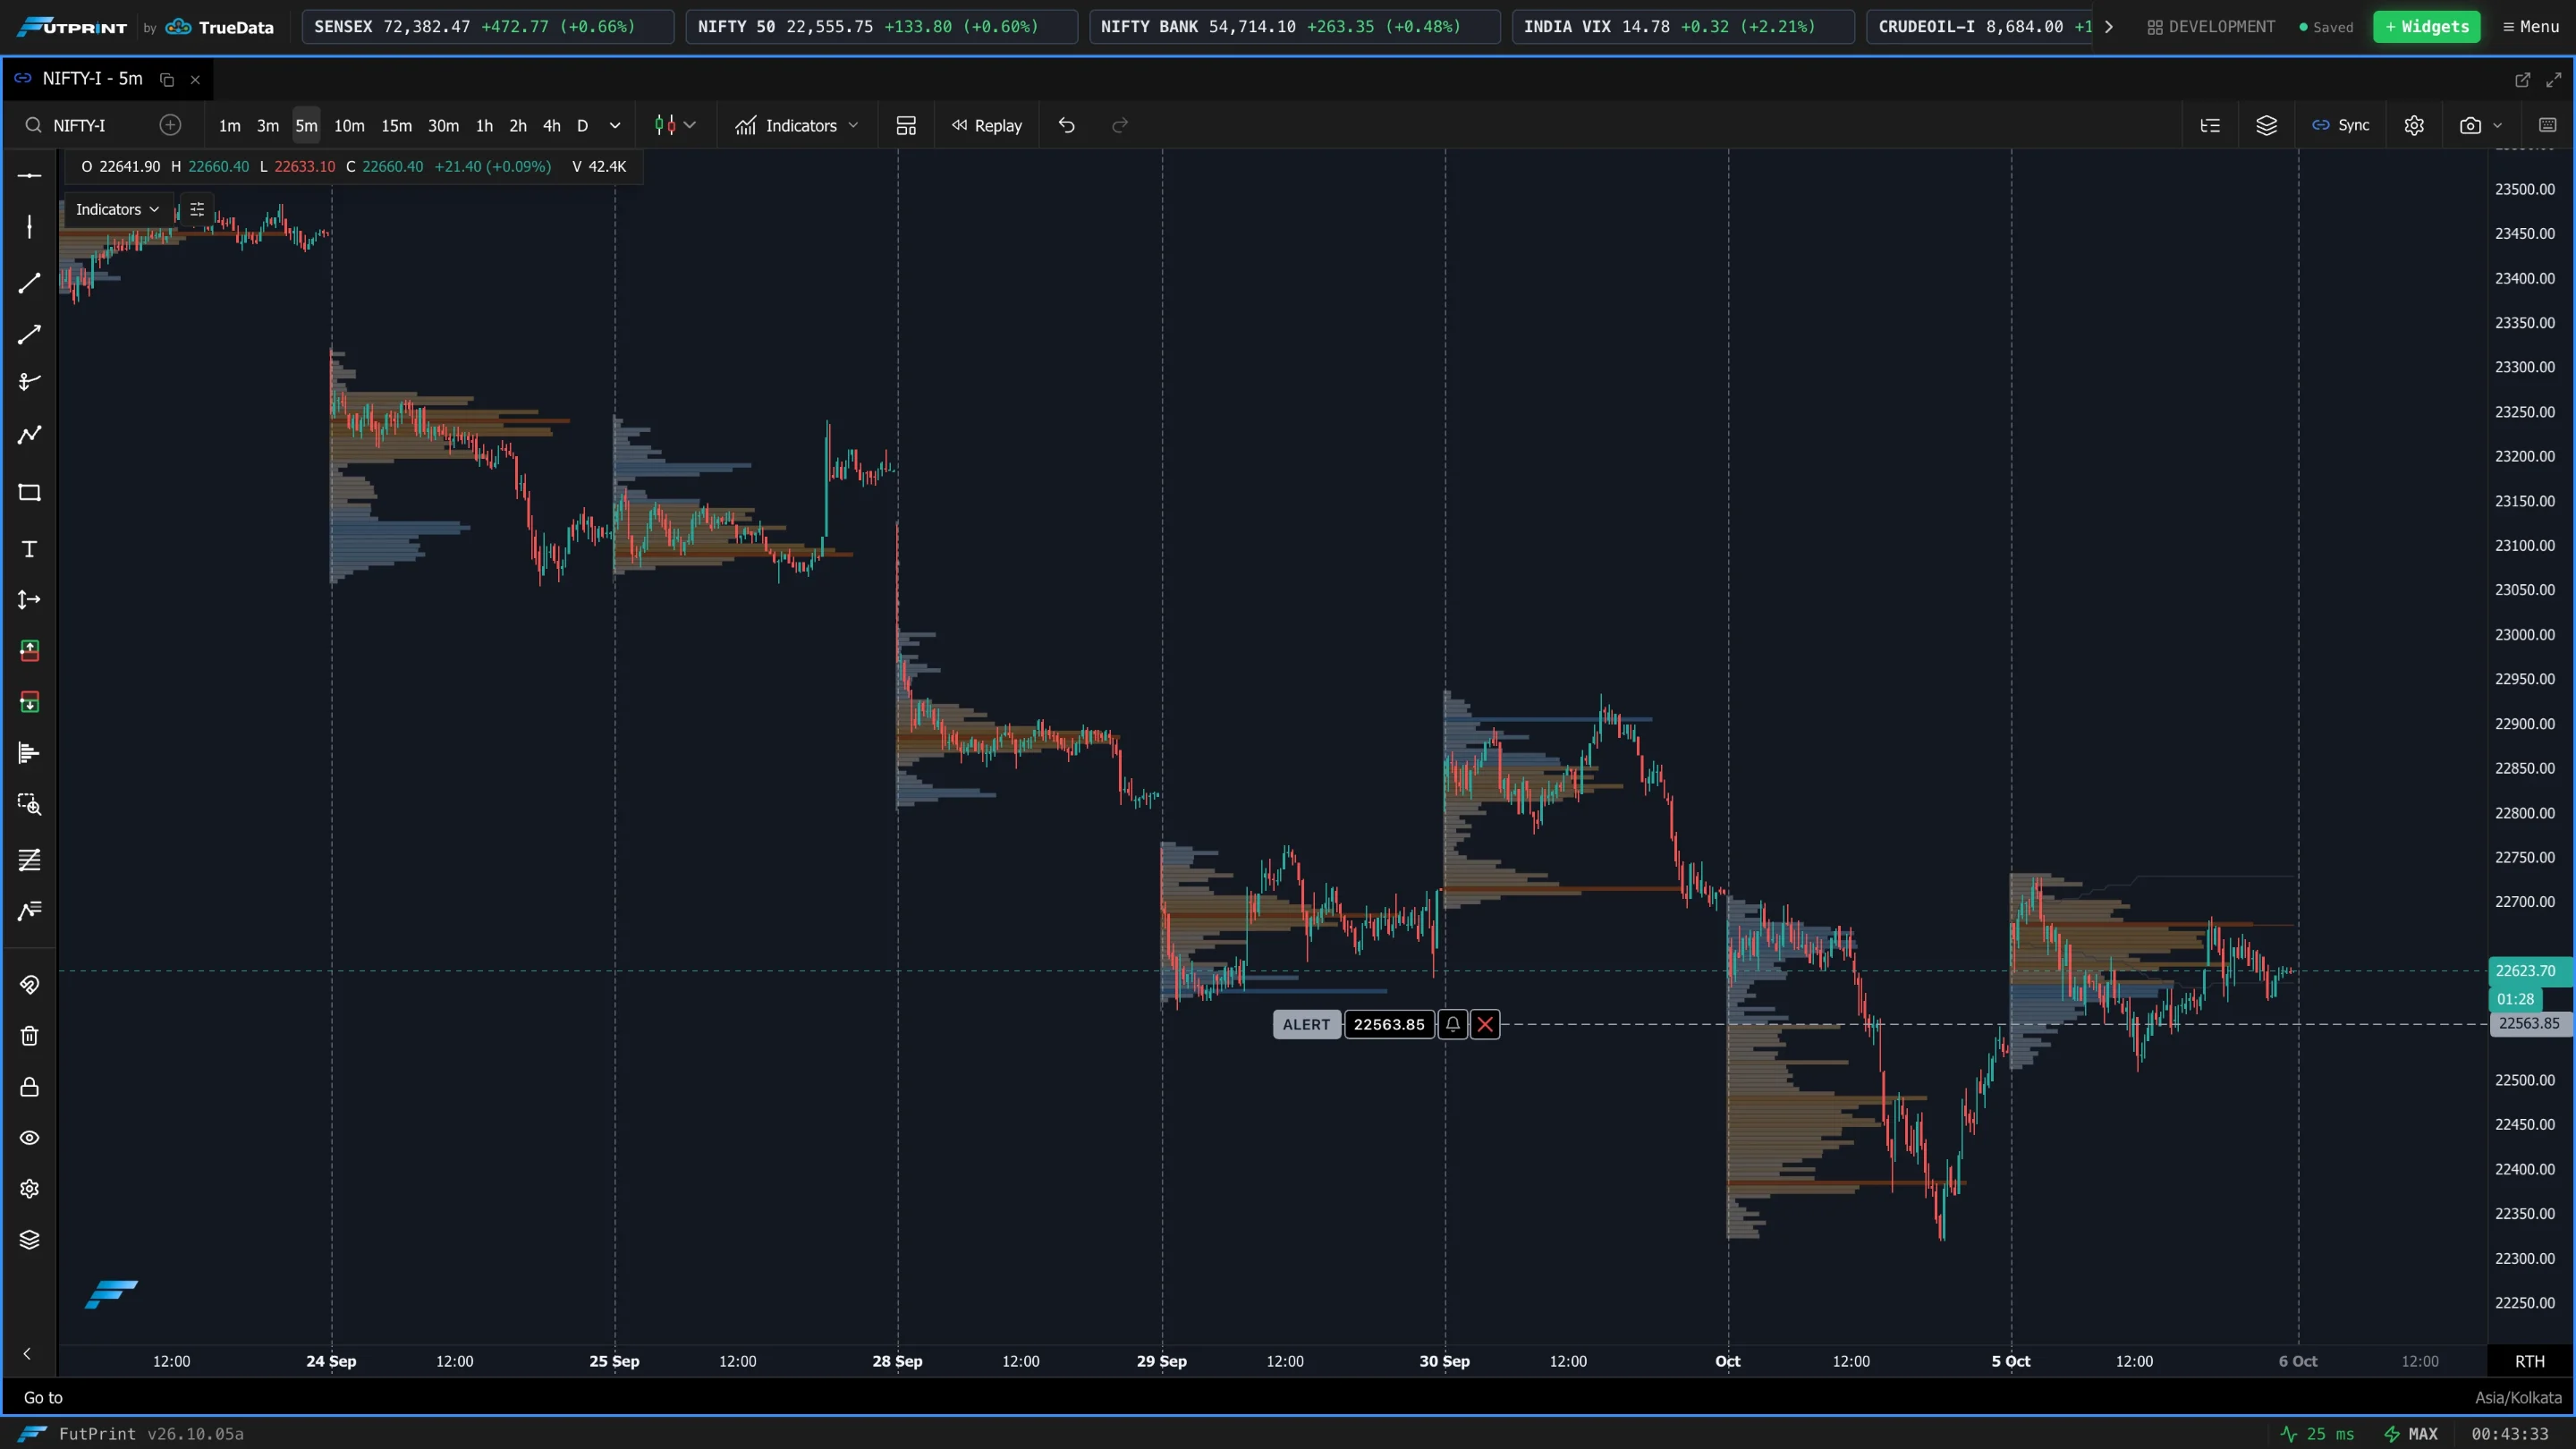
Show Developing POC / VA plots a running POC, VAH and VAL trail across the ongoing session, updated as each candle lands, so you can see how value migrated during the day. POC Trail Color, VA Trail Color and Trail Line Width set its appearance.
Auction
Auction Market Theory overlays.
| Setting | What it does |
|---|---|
| Show Auction Type | Badges each anchored session with its open type (Open Drive / Test / Rejection / Auction) and day type (Trend / Normal / Neutral). |
| Show Initial Balance | Draws the high and low of the opening window as a band across each session. |
| Initial Balance (minutes) | Length of the opening window, 5 to 240 minutes. |
| Initial Balance Color | Colour of the band. |
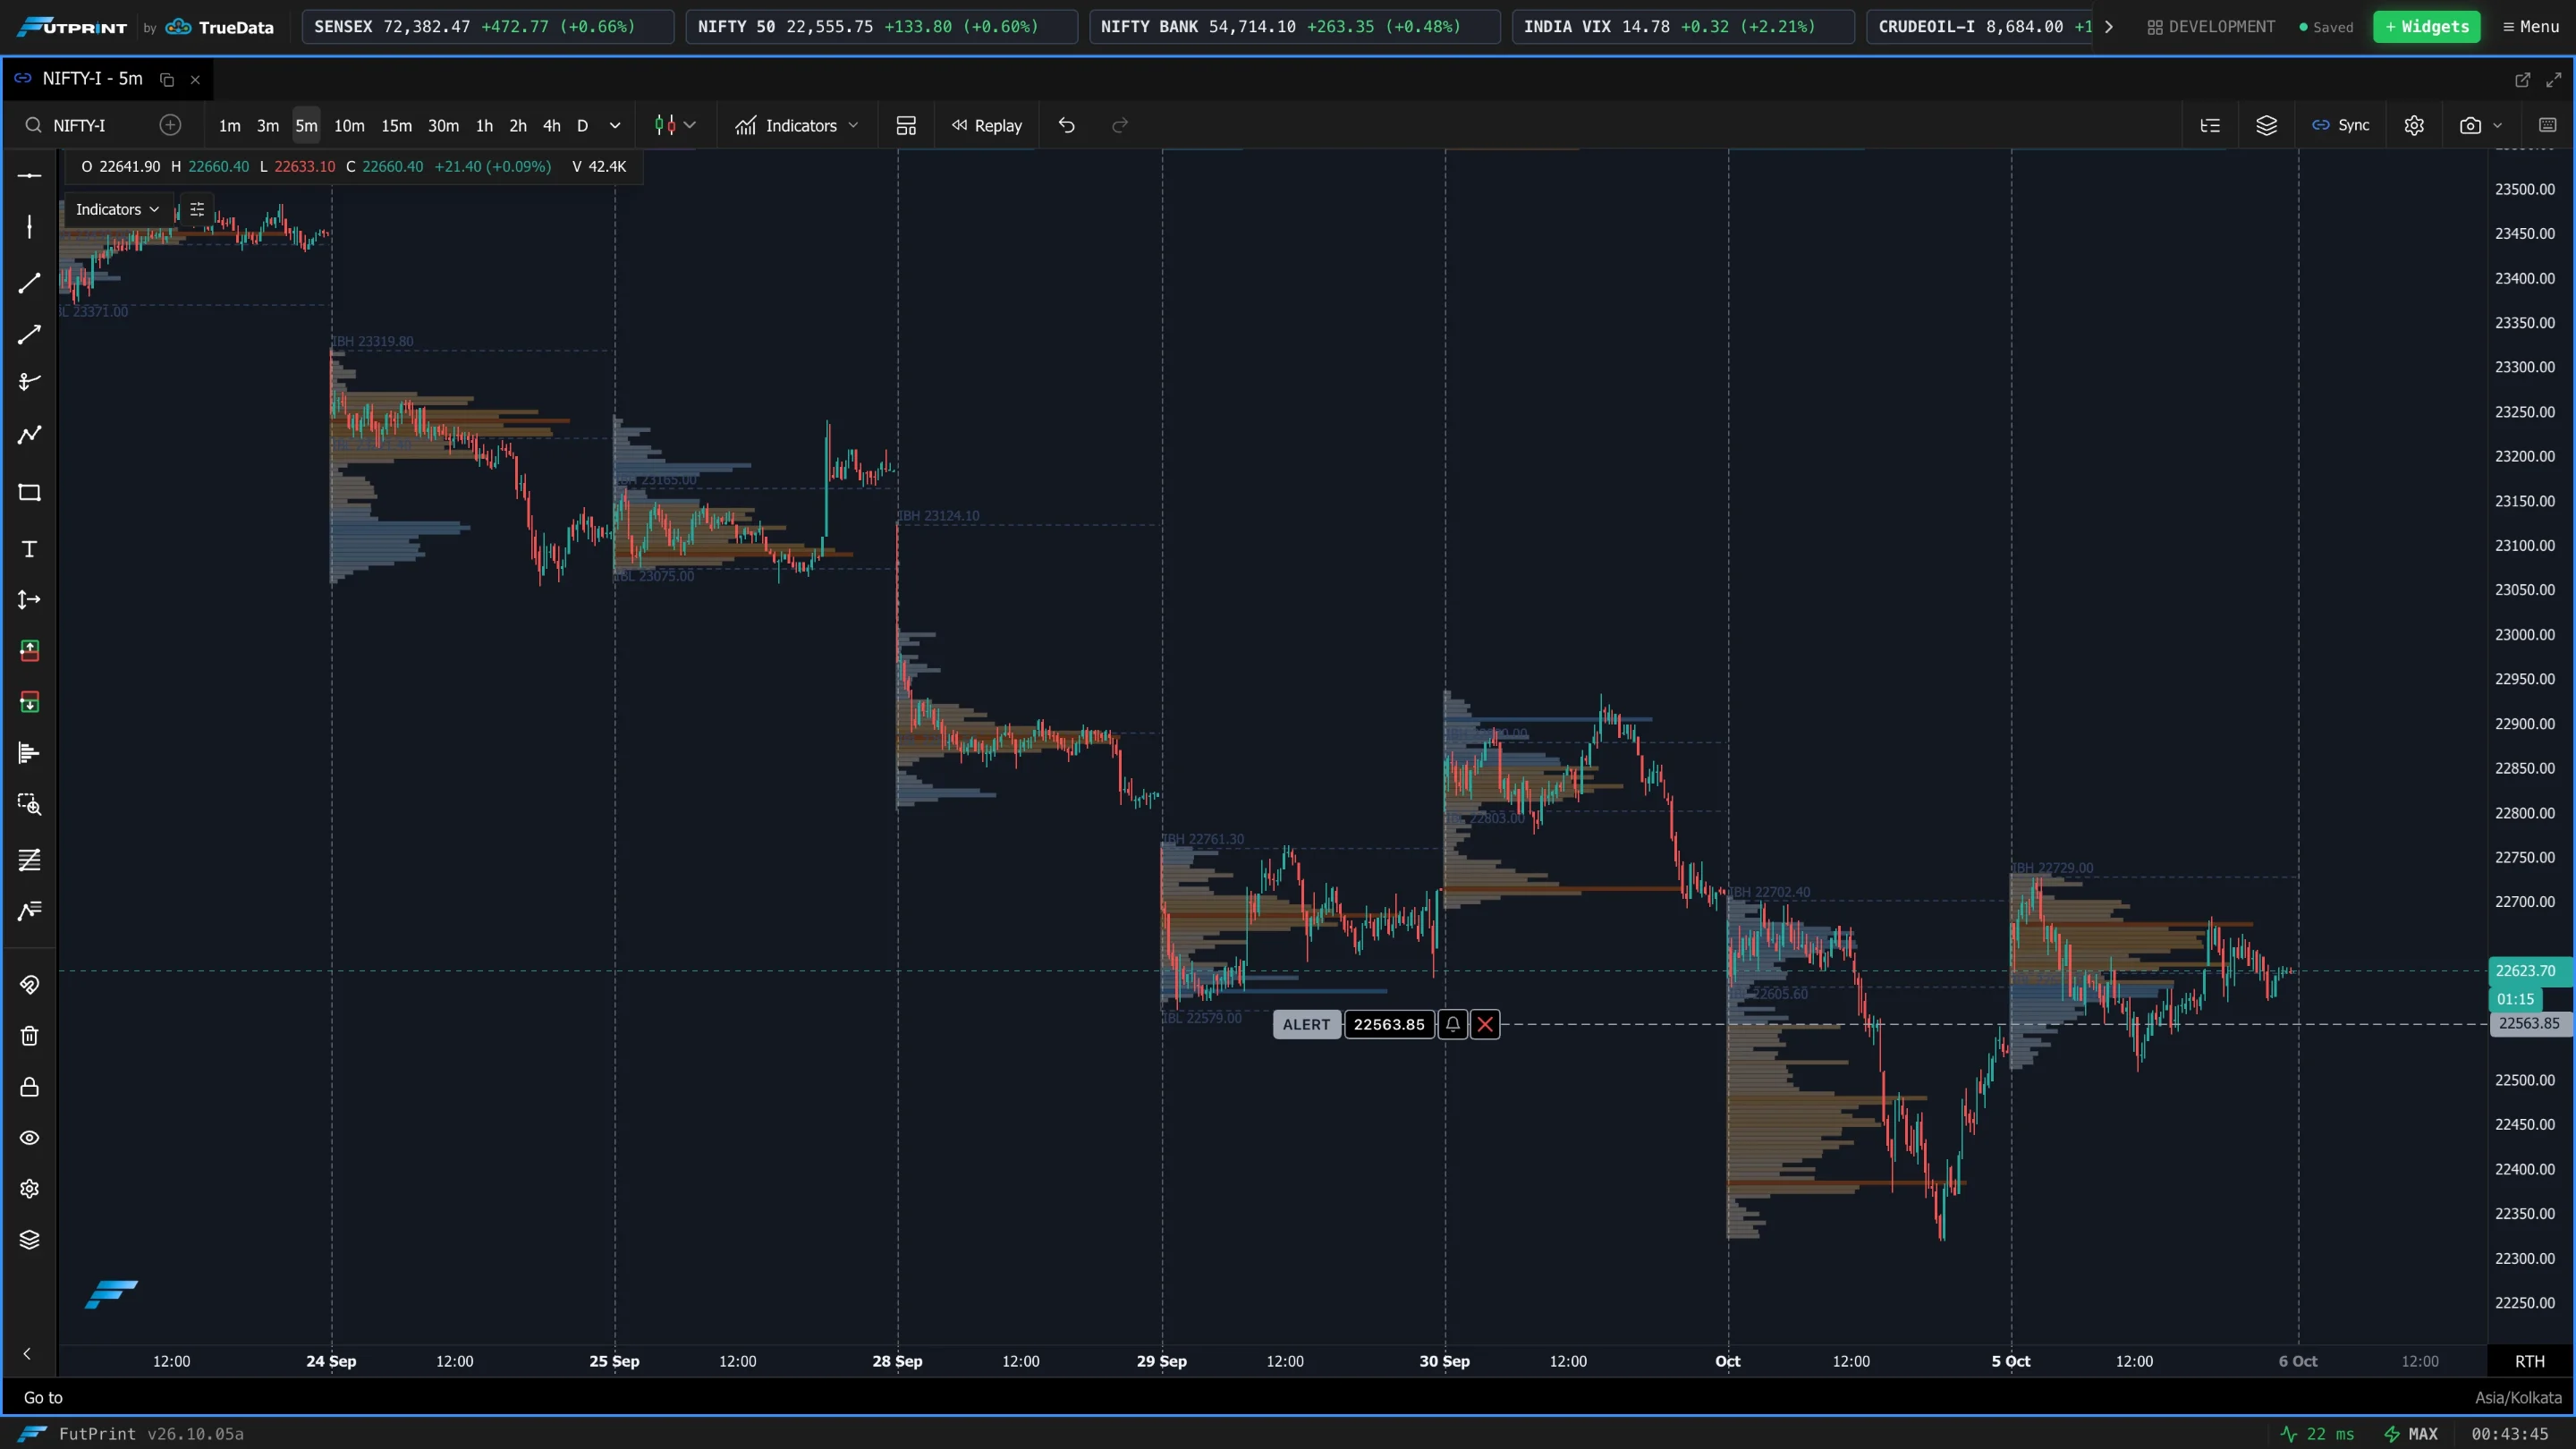
LVN Lines and HVN Lines
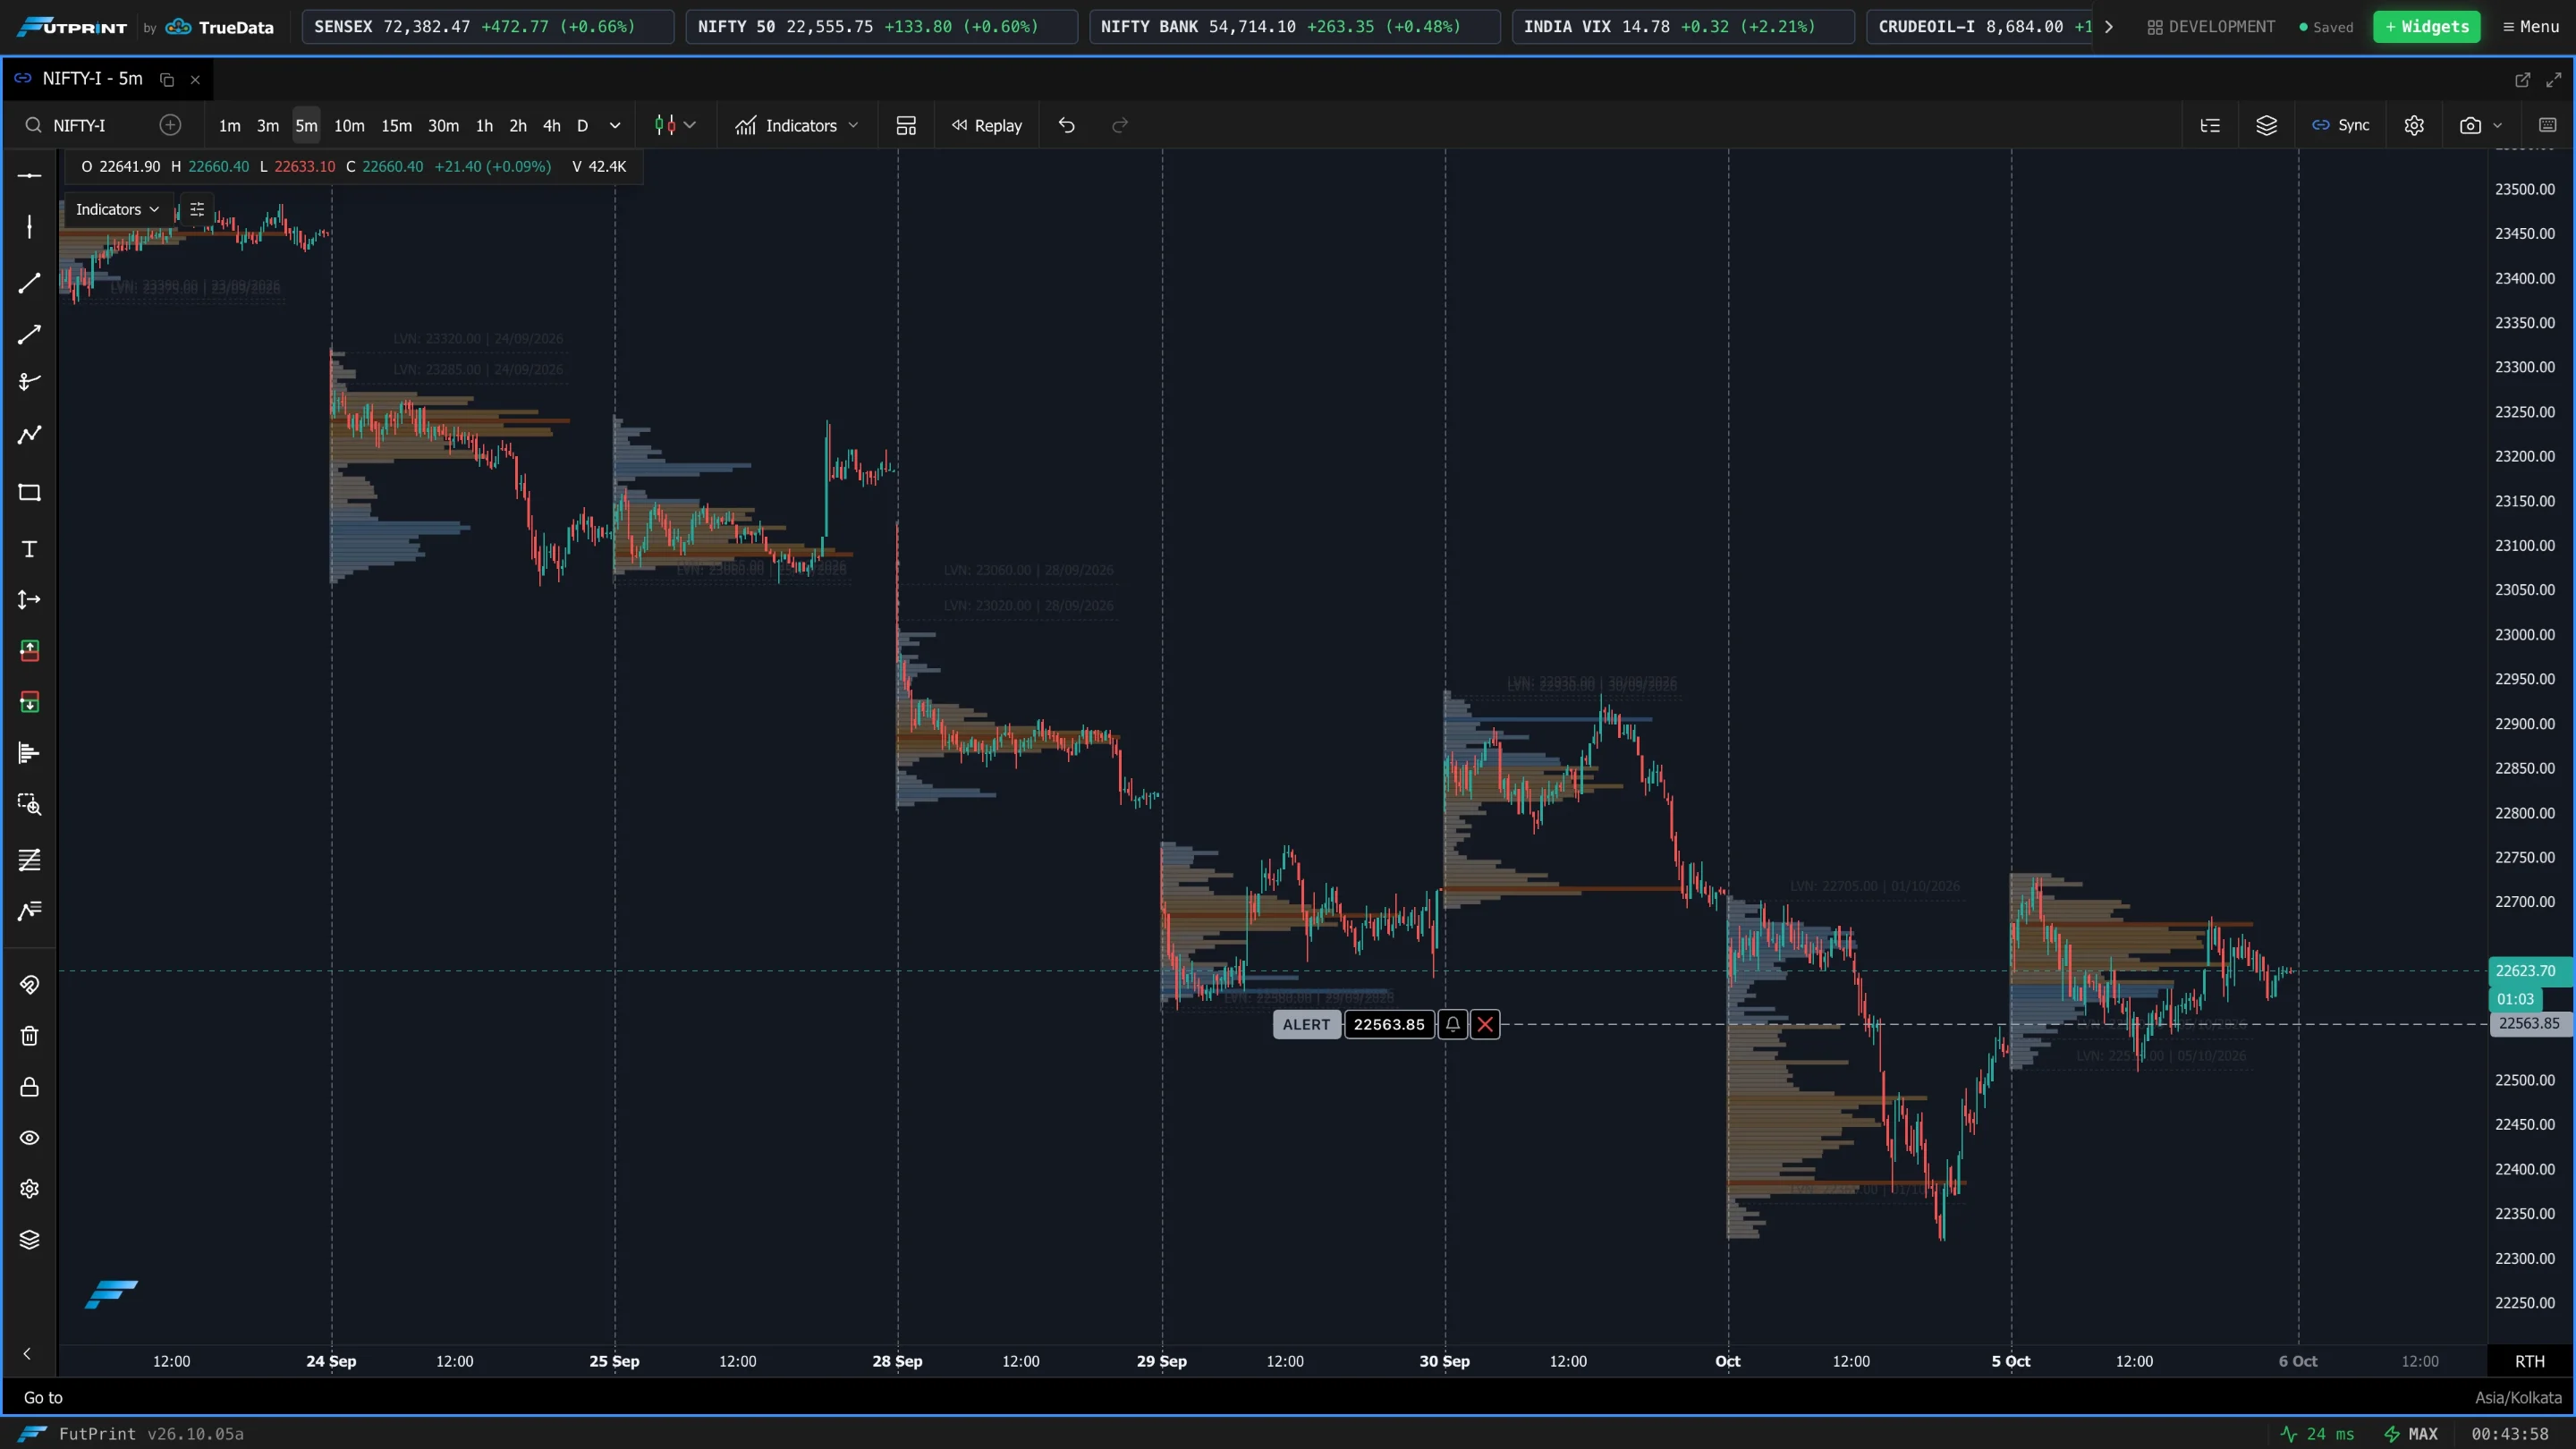
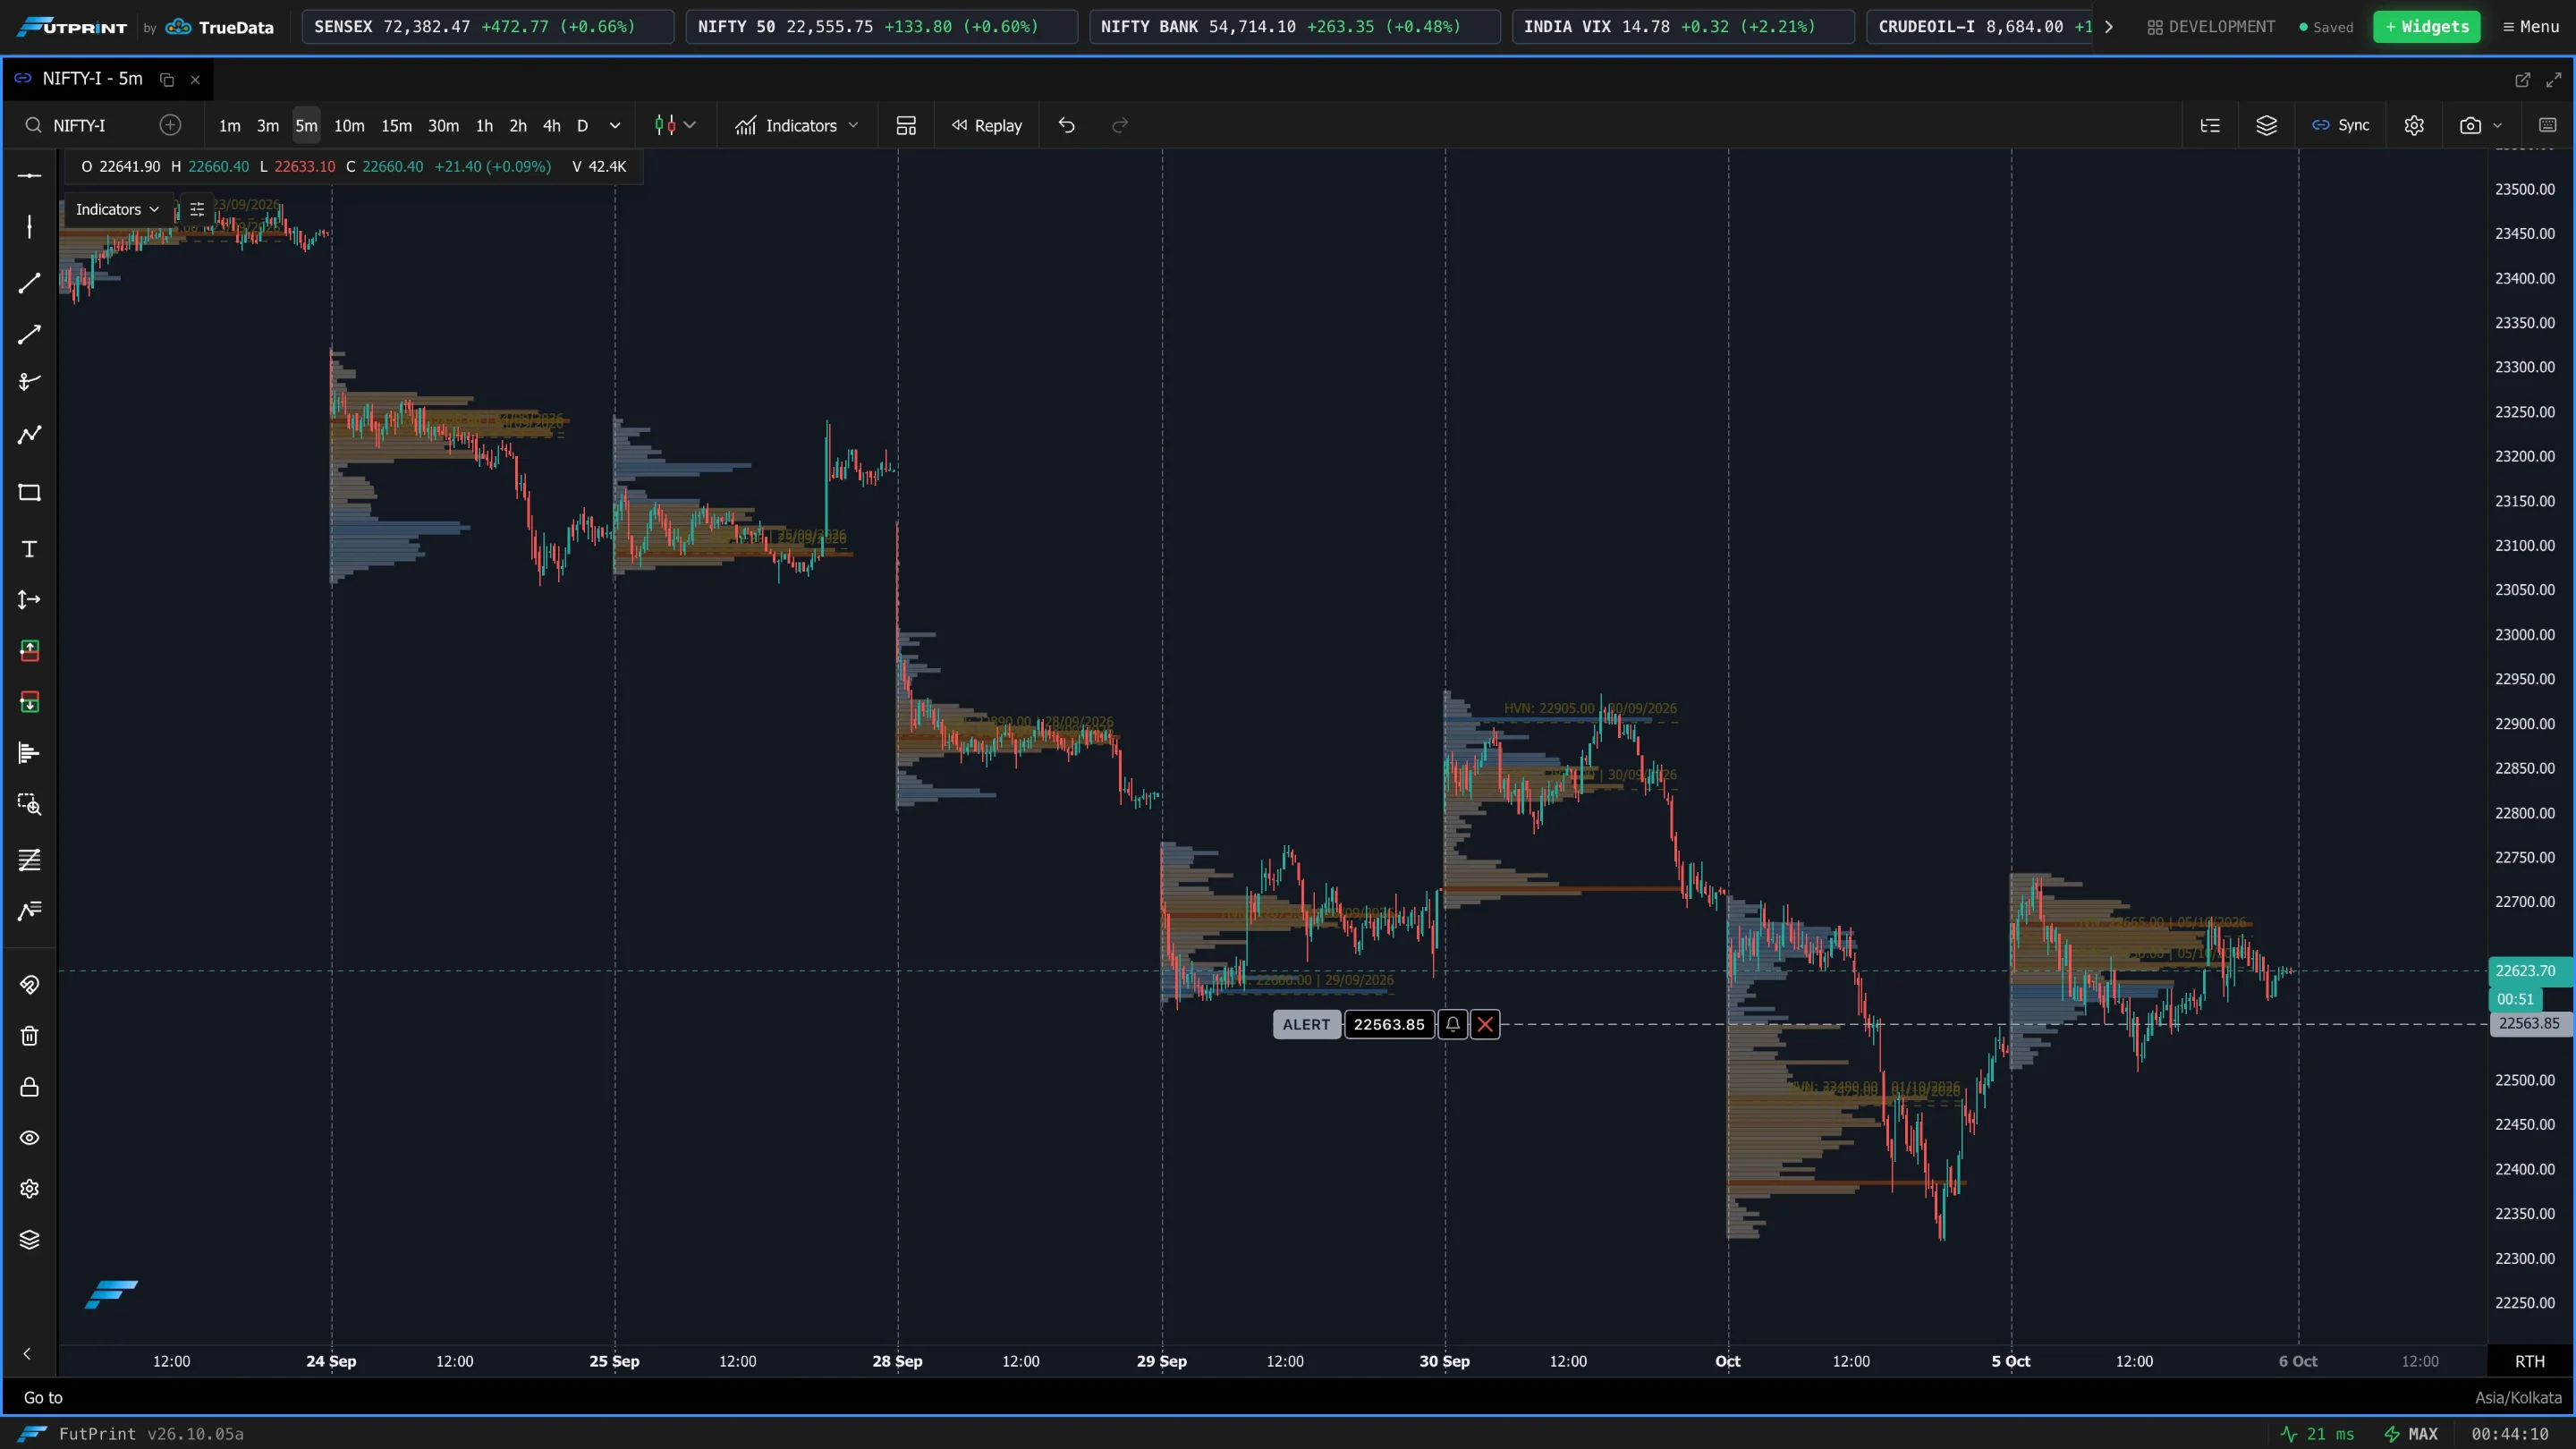
Mark the low-volume and high-volume nodes of each profile.
| Setting | What it does |
|---|---|
| Show LVN Lines / Show HVN Lines | Turn the node lines on. |
| Number of LVN Nodes / Number of HVN Nodes | How many nodes to mark per profile. |
| Extend Line / Extend Until | As for the POC line. |
| Show Price Label / Show Time/Date Label | Labels on the lines. |
| Line Color / Width / Style | Appearance. |
Highlight Conditions
Rules that highlight individual bins of the profile based on their total volume, delta, buy volume or sell volume — for example, to mark every bin above a volume threshold.
Composite Profile
Show Composite Profile adds one extra profile built from a longer range, drawn at the right edge of the chart. Composite Range chooses that range: Visible Range, Previous Day, Current Week, Previous Week, Current Month, Previous Month or Number of Days.
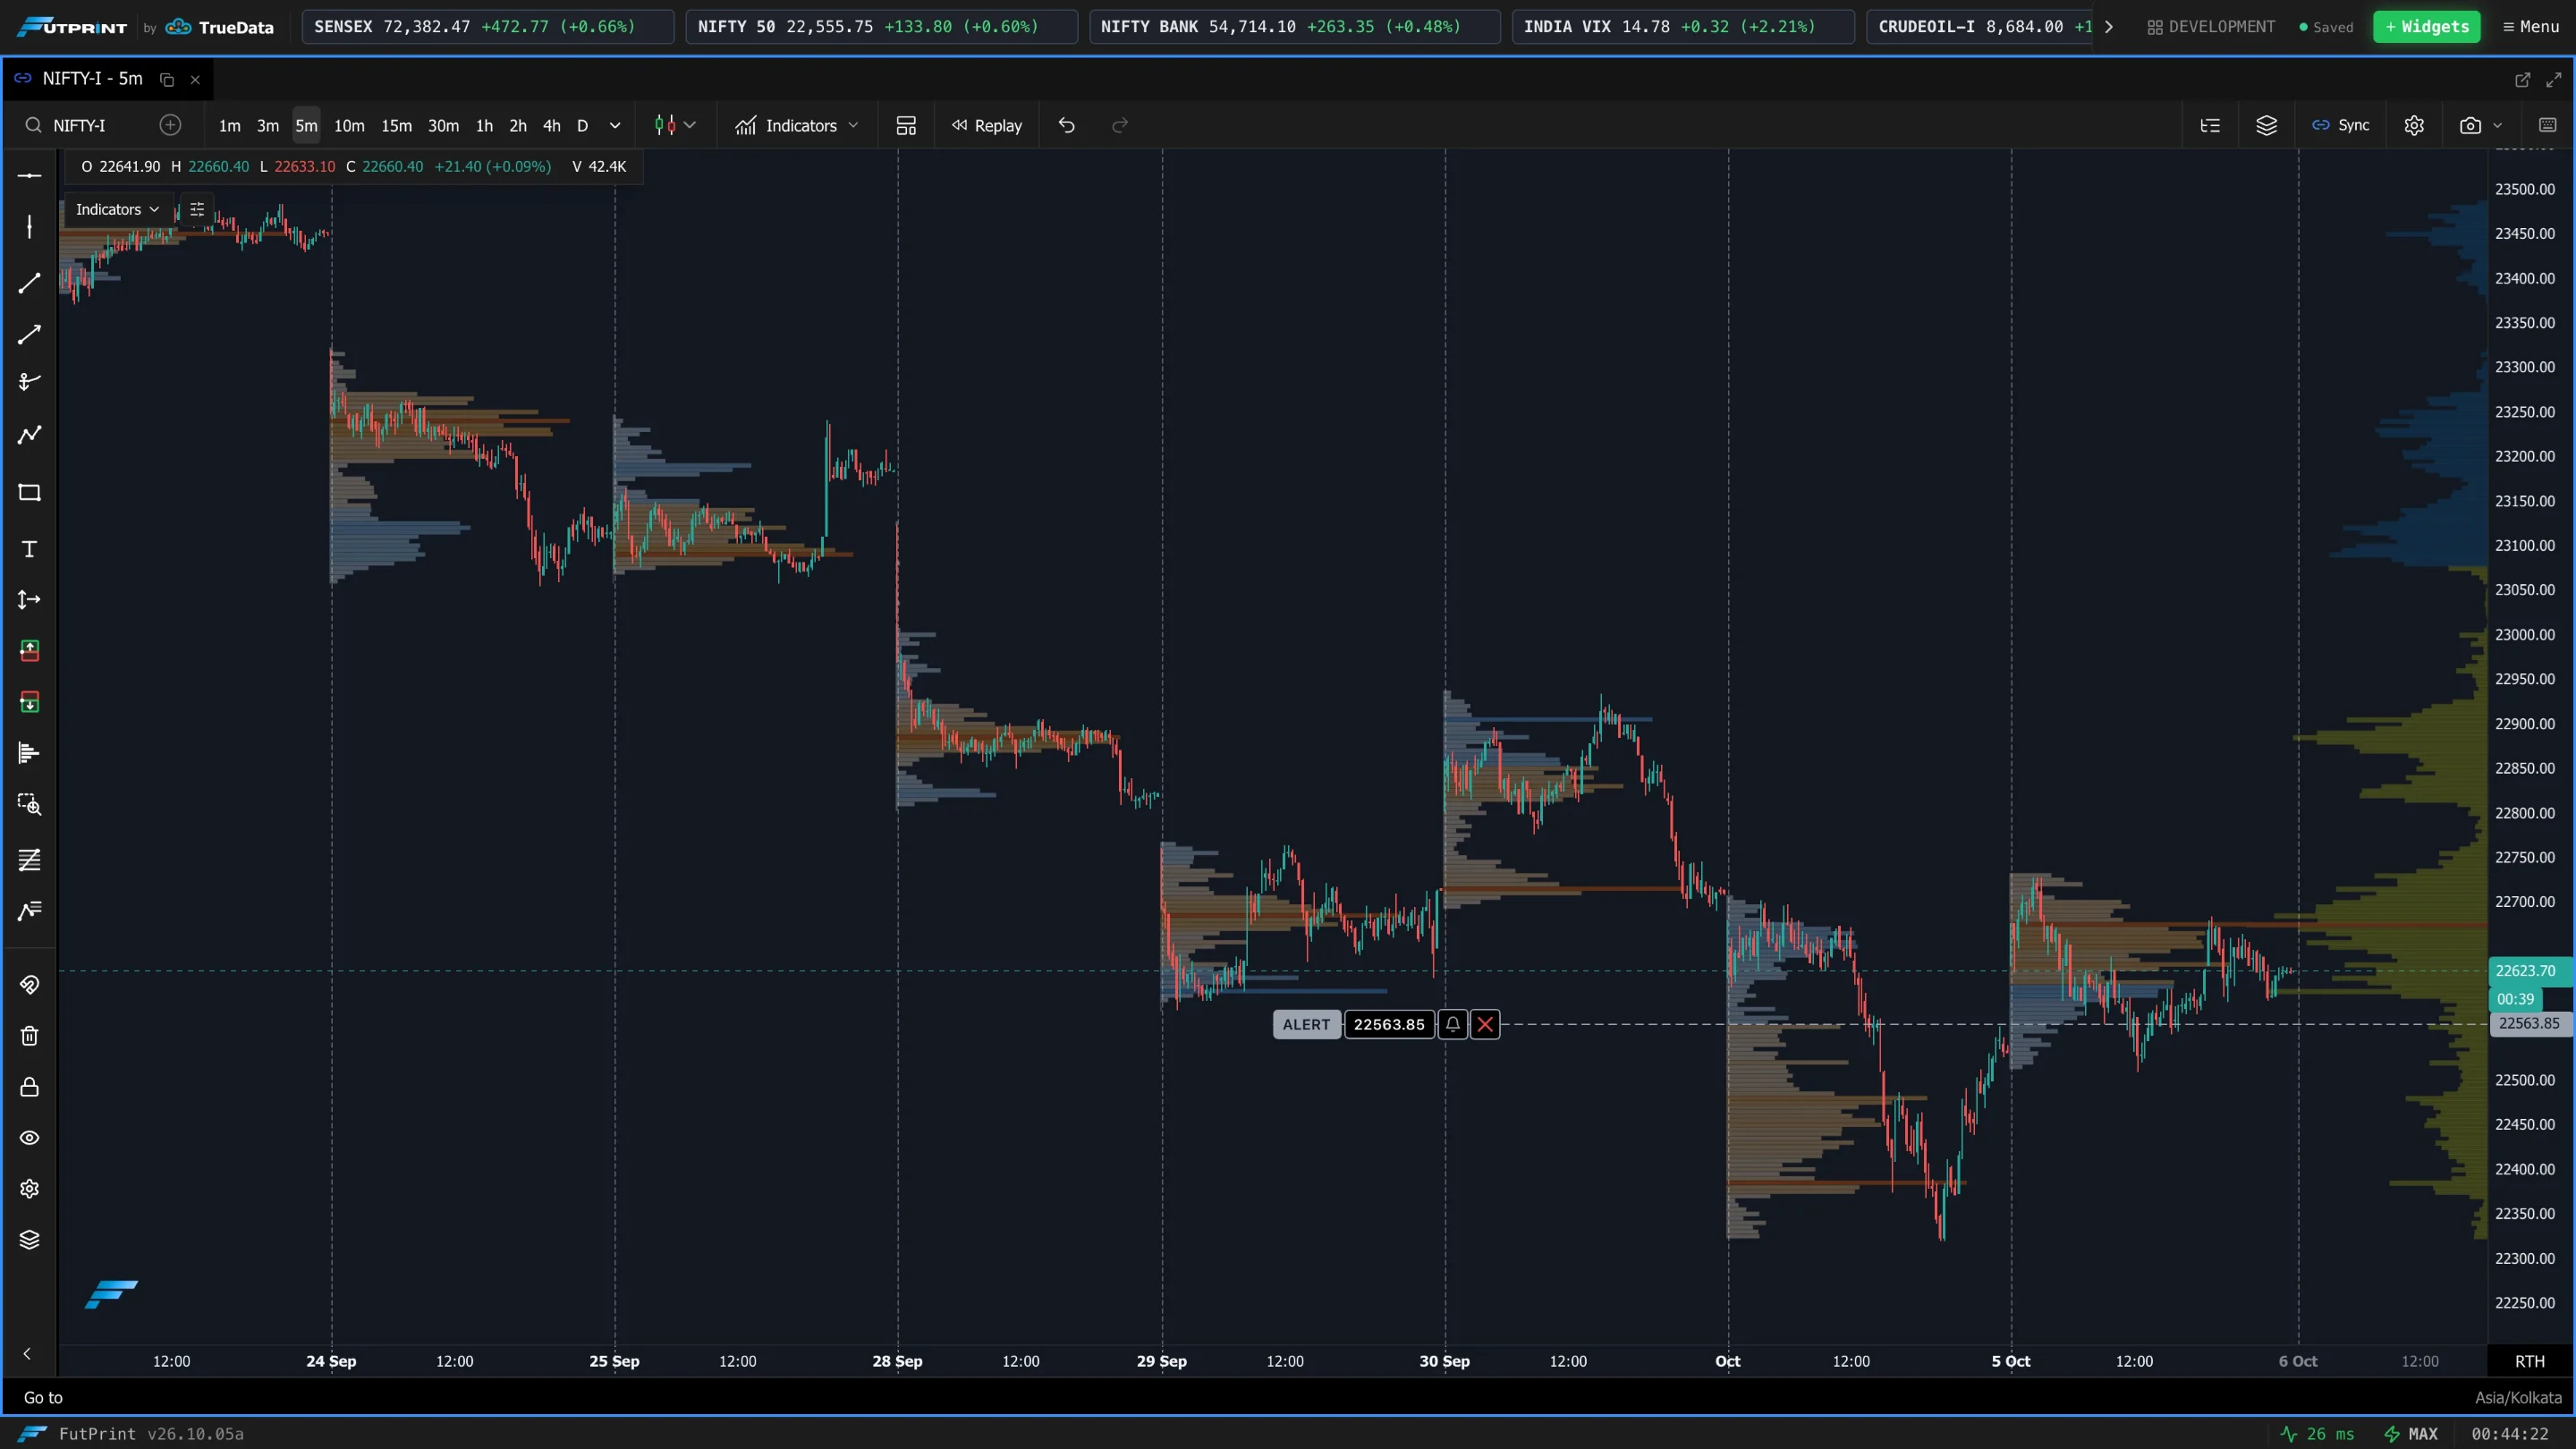
A common setup: daily profiles with Show POC Line extended until intersection and Naked POCs Only on. The chart then carries forward only the untested POCs, which are the levels most often revisited.