Options Print (OptiPrint)
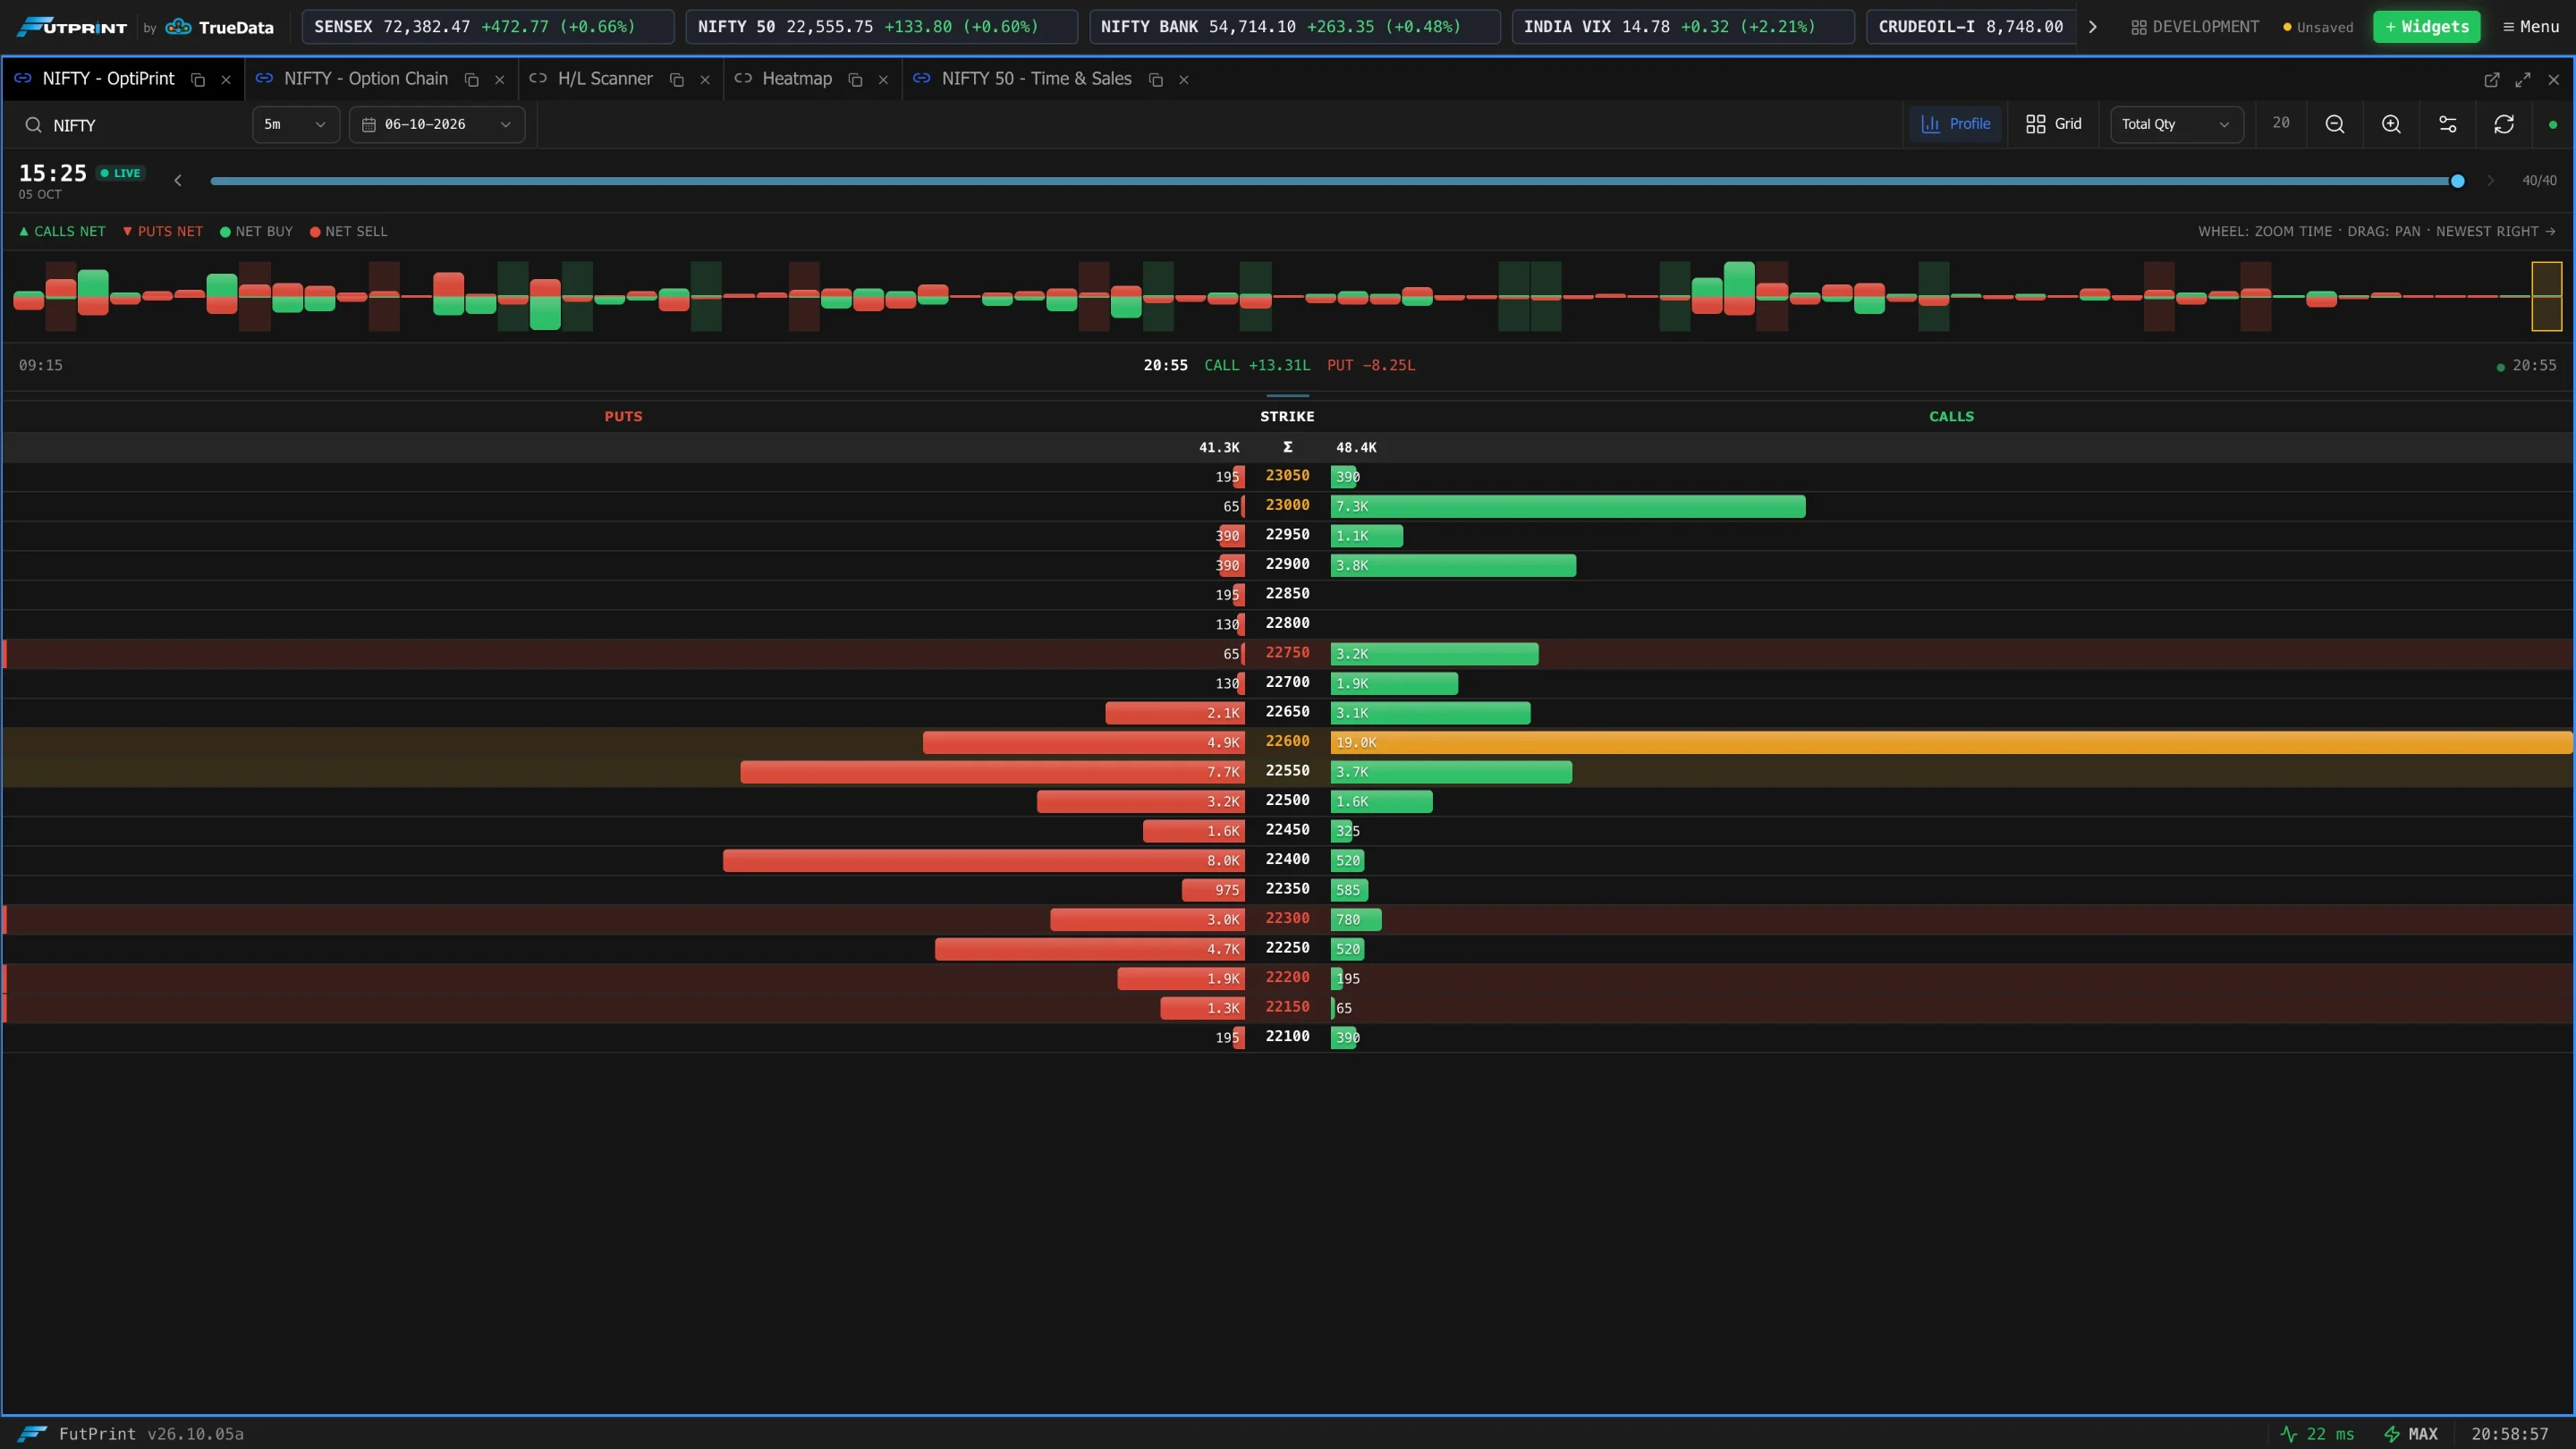
Options Print is a footprint for an entire option chain. For each candle it shows how much was bought and sold at every strike around the money, calls on one side and puts on the other, so you can see where option flow concentrated and step back through the session candle by candle.
Loading a chain
- 1Search an underlying
Type in Search symbol and pick the index or future. Until you do, the panel shows No symbol selected.
- 2Pick the interval and expiry
Footprint interval sets the candle size (for example 5m). Expiry chooses which option expiry is loaded.
At the start of a new session the panel shows Waiting for data until the first option ticks arrive.
The candle strip
The strip under the toolbar is the session, one bar per candle.
| Control | What it does |
|---|---|
| Candle time | The candle currently displayed, with a LIVE badge when it is the latest one. |
| Previous candle / Next candle | Step one candle back or forward. |
| Timeline slider | Drag to any candle in the session. |
| Jump to latest (live) | Return to the live candle after stepping back. |
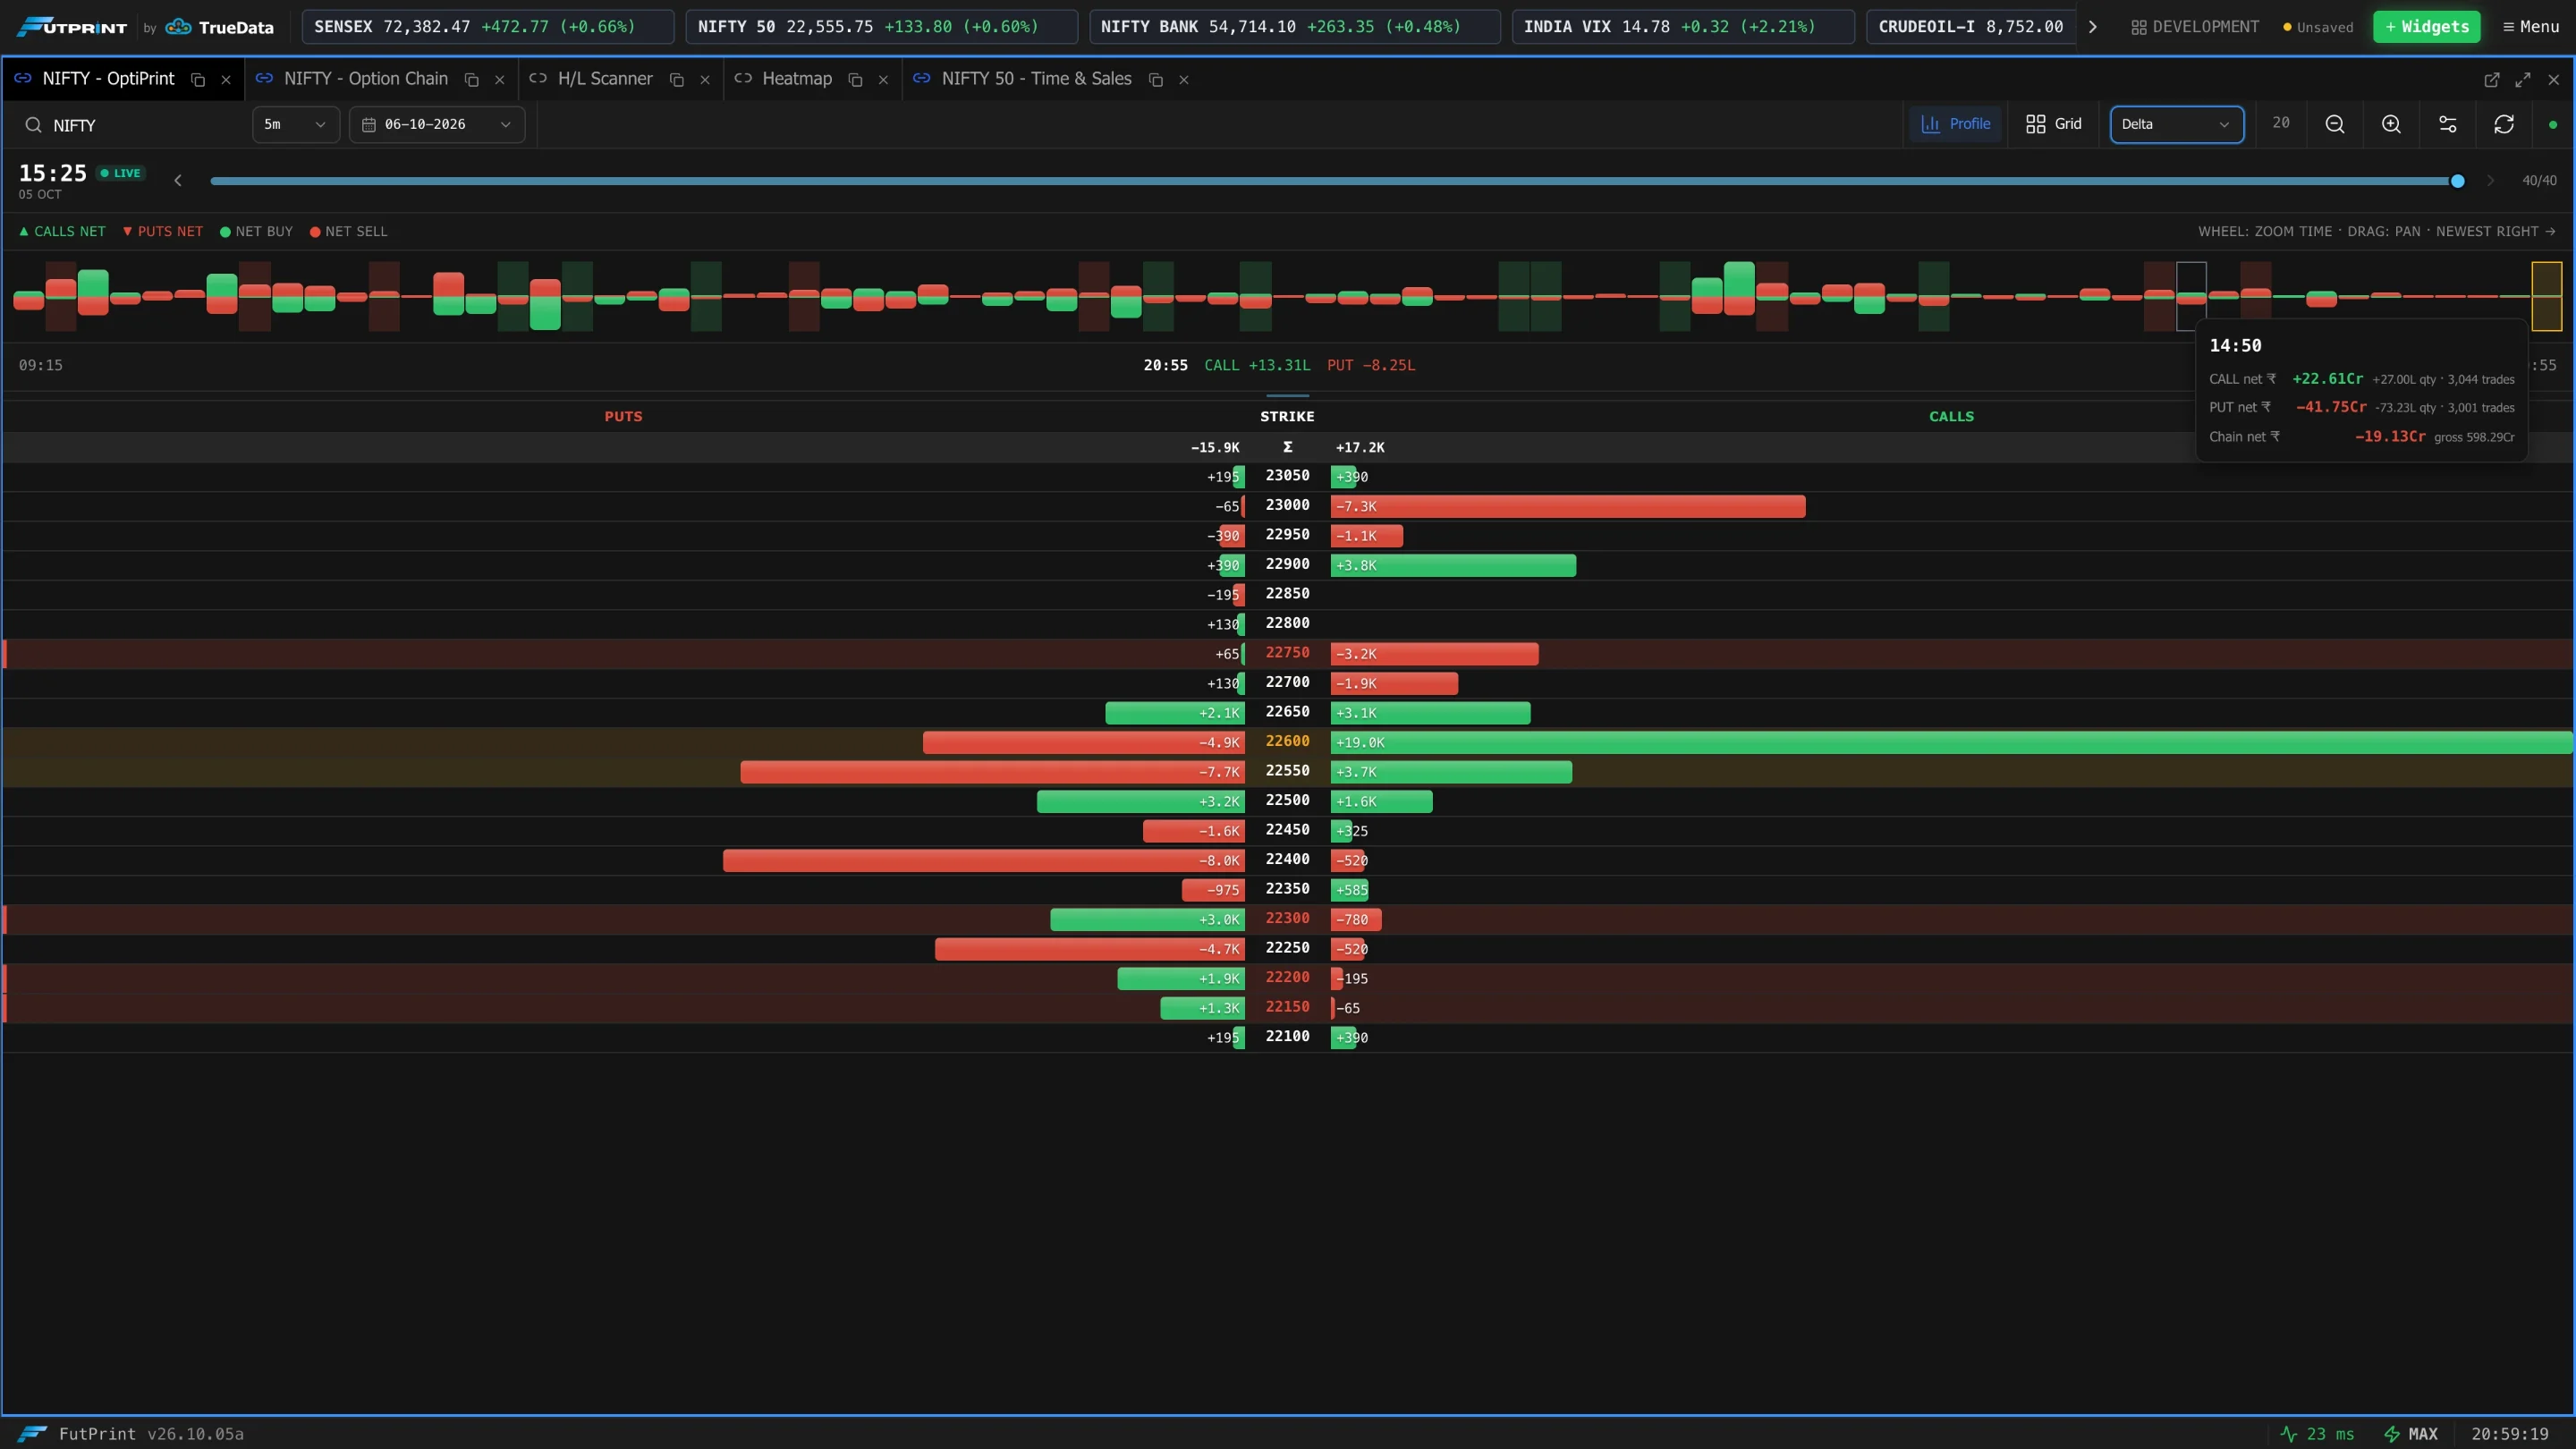
| Candle bars | Scroll to zoom the time axis, drag to pan. The newest candle is on the right. Hover a bar for that candle's call, put and chain net figures. |
The legend marks Calls Net, Puts Net, Net Buy and Net Sell, and the line under the strip shows the selected candle's call and put totals.
Profile and Grid views
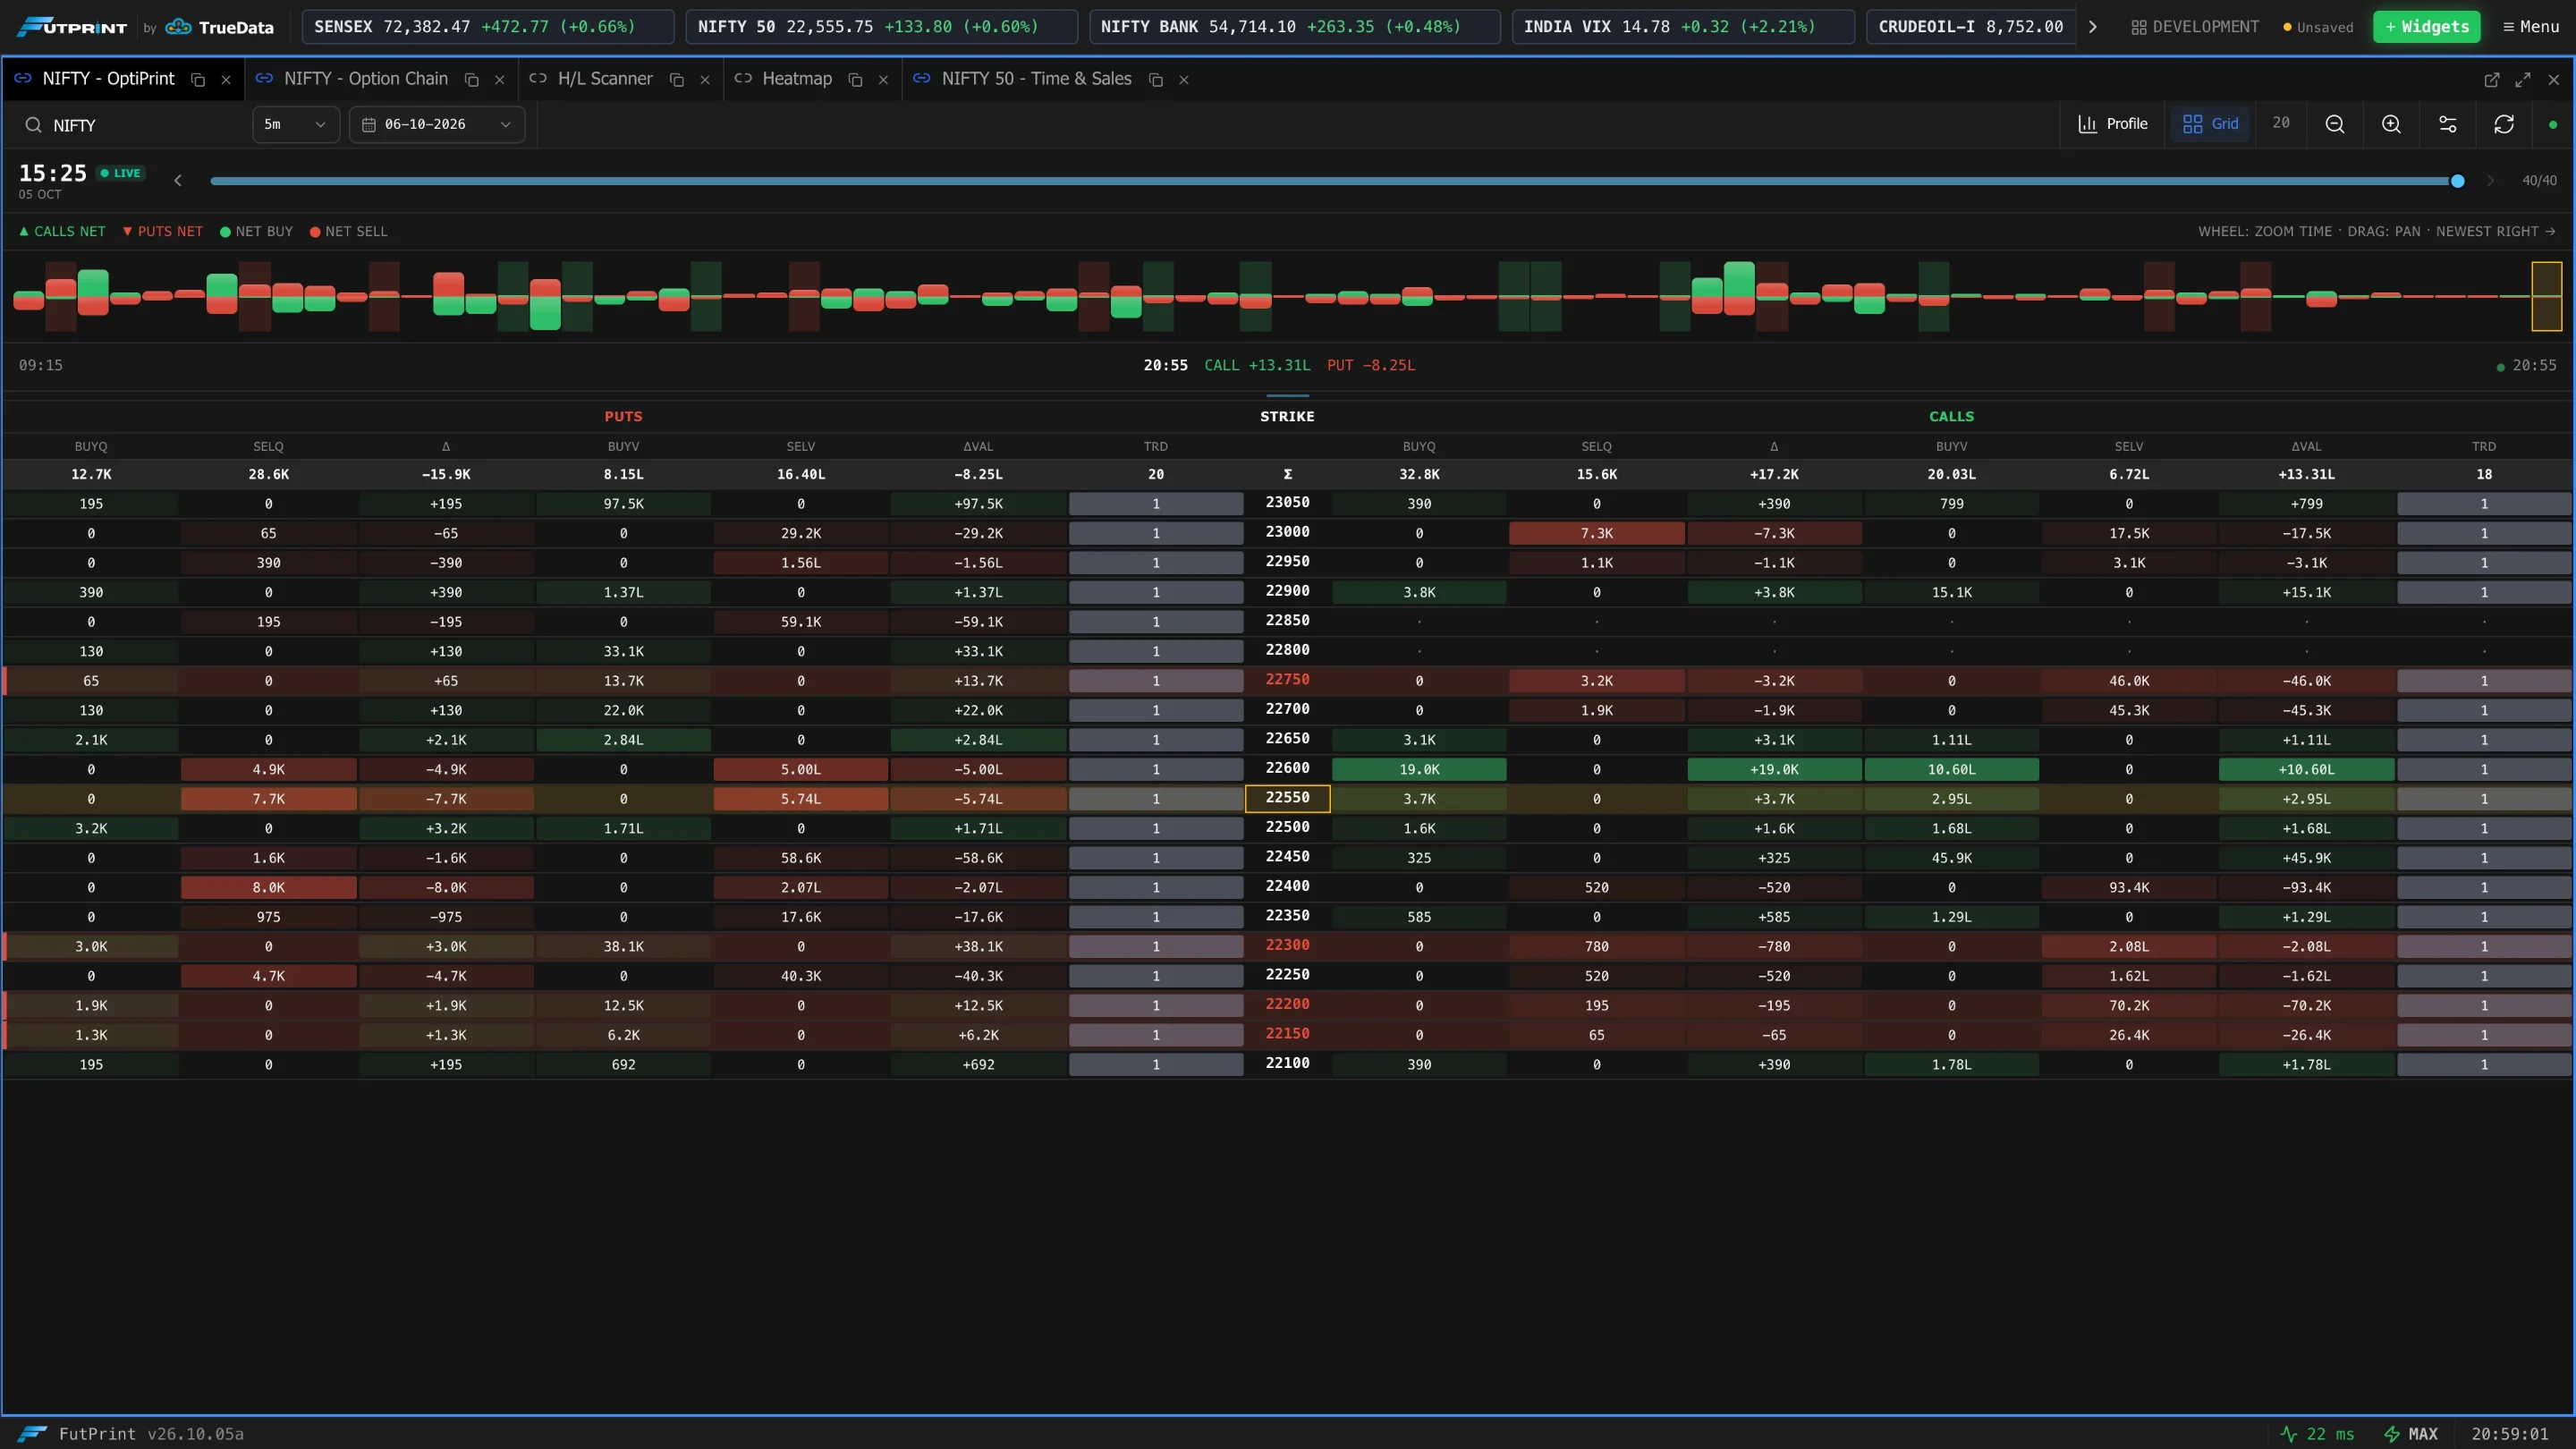
Profile view draws one horizontal bar per strike and side, sized by the selected metric. Grid view shows the same candle as numbers.
Profile metric
(Profile view) Choose what the bars measure:
| Metric | Meaning |
|---|---|
| Total Qty | All quantity traded at the strike in the candle. |
| Buy Qty / Sell Qty | Buy-side or sell-side quantity only. |
| Delta | Buy quantity minus sell quantity. |
| Value | Traded value. |
| Net Value | Buy value minus sell value. |
| Trades | Number of trades. |
Zoom
Zoom out and Zoom in change how many strikes are shown around the money (the number between them is the current count). You can also hold Ctrl/⌘ and scroll.
Settings
The Settings button opens the panel options, grouped as Display, Data, Signals and Columns:
| Setting | What it does |
|---|---|
| Highlight ATM | Marks the at-the-money strike row. |
| Show Totals | Shows the totals row for each side. |
| Show Values On Bars | Prints the value on each profile bar. |
| Strike Count / Strike Range (0=all) | How many strikes are loaded and shown around the money. |
| Days To Load | How many sessions of history are loaded. |
| Realtime (WebSocket) | Live updates on or off. |
| Imbalance Ratio (×) | The buy:sell ratio used to flag a strike as imbalanced. |
| Enable LONG/SHORT | Turns the long/short signal labels on. |
| Columns | Which Grid-view columns are shown (Buy/Sell Qty, Delta, Buy/Sell Value, Net Value, Trades). |
Refresh today reloads the current session's data.