Chart — Technical Indicators
Indicators are studies layered onto the chart — either on the price (overlays like moving averages) or in their own sub-pane below it (oscillators like RSI). FutPrint ships a broad library covering classic technicals as well as order-flow, profile and options-specific studies.
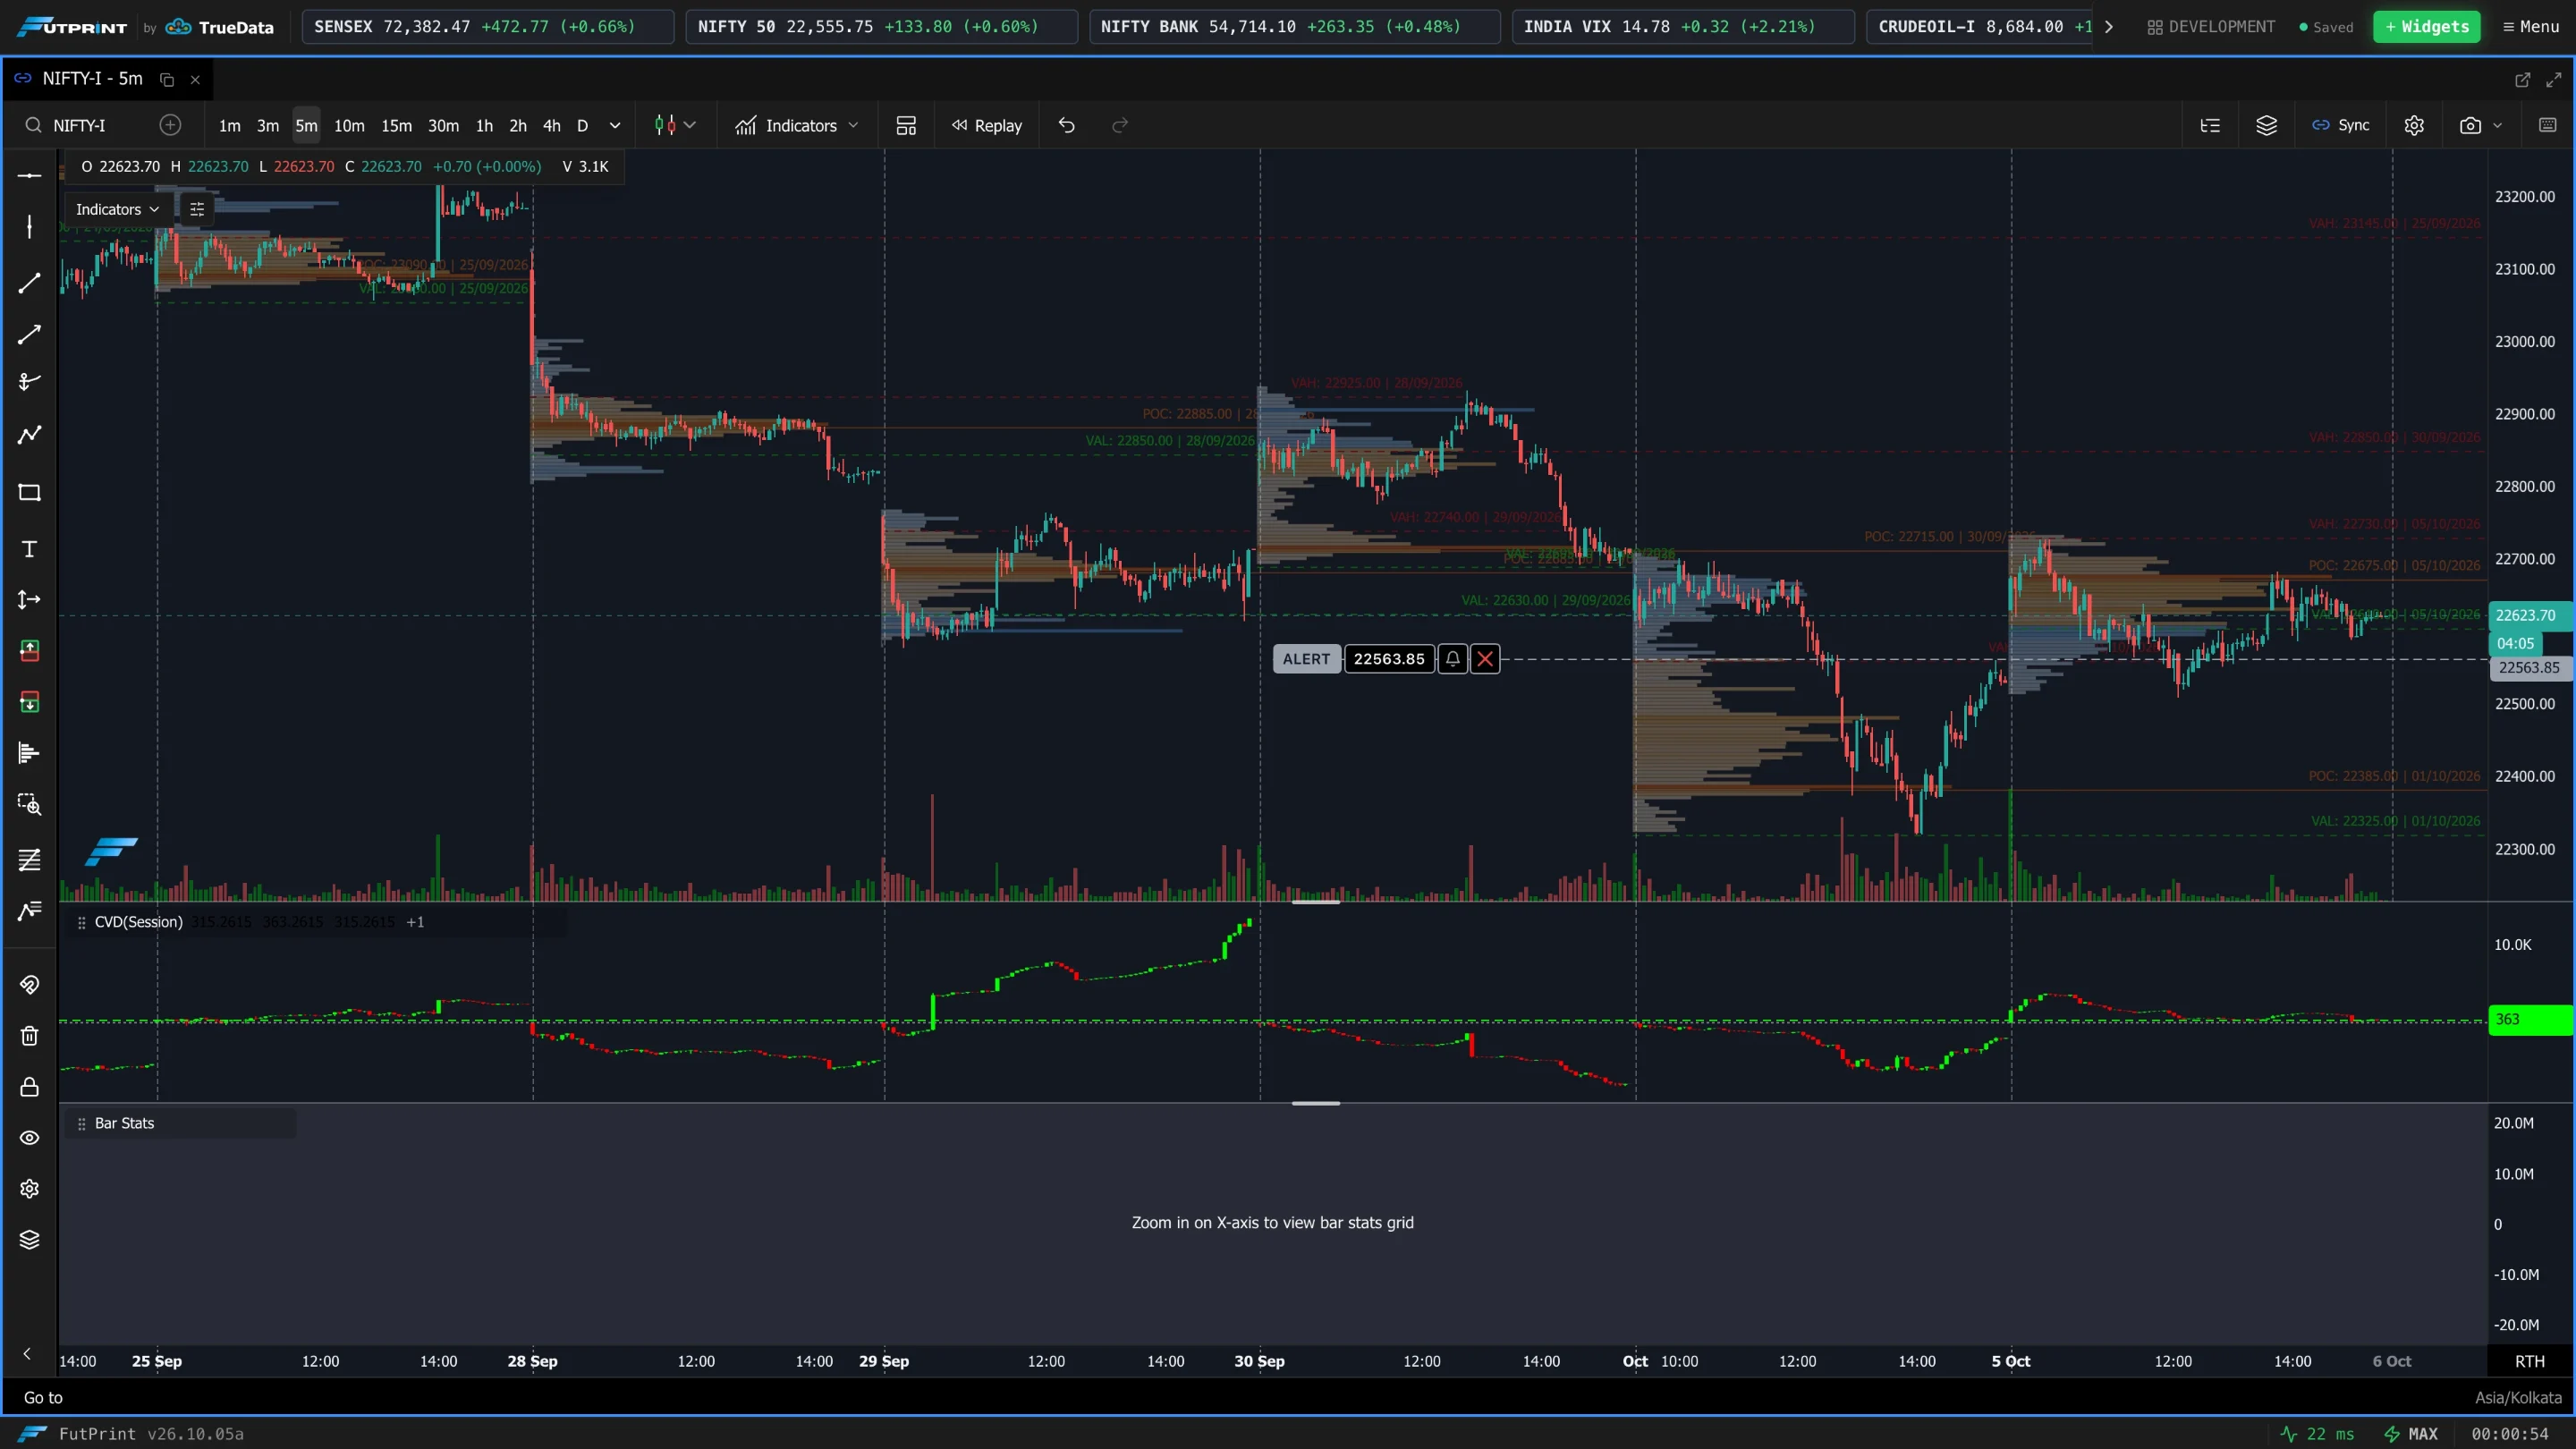
Adding an indicator
- 1Open the indicator browser
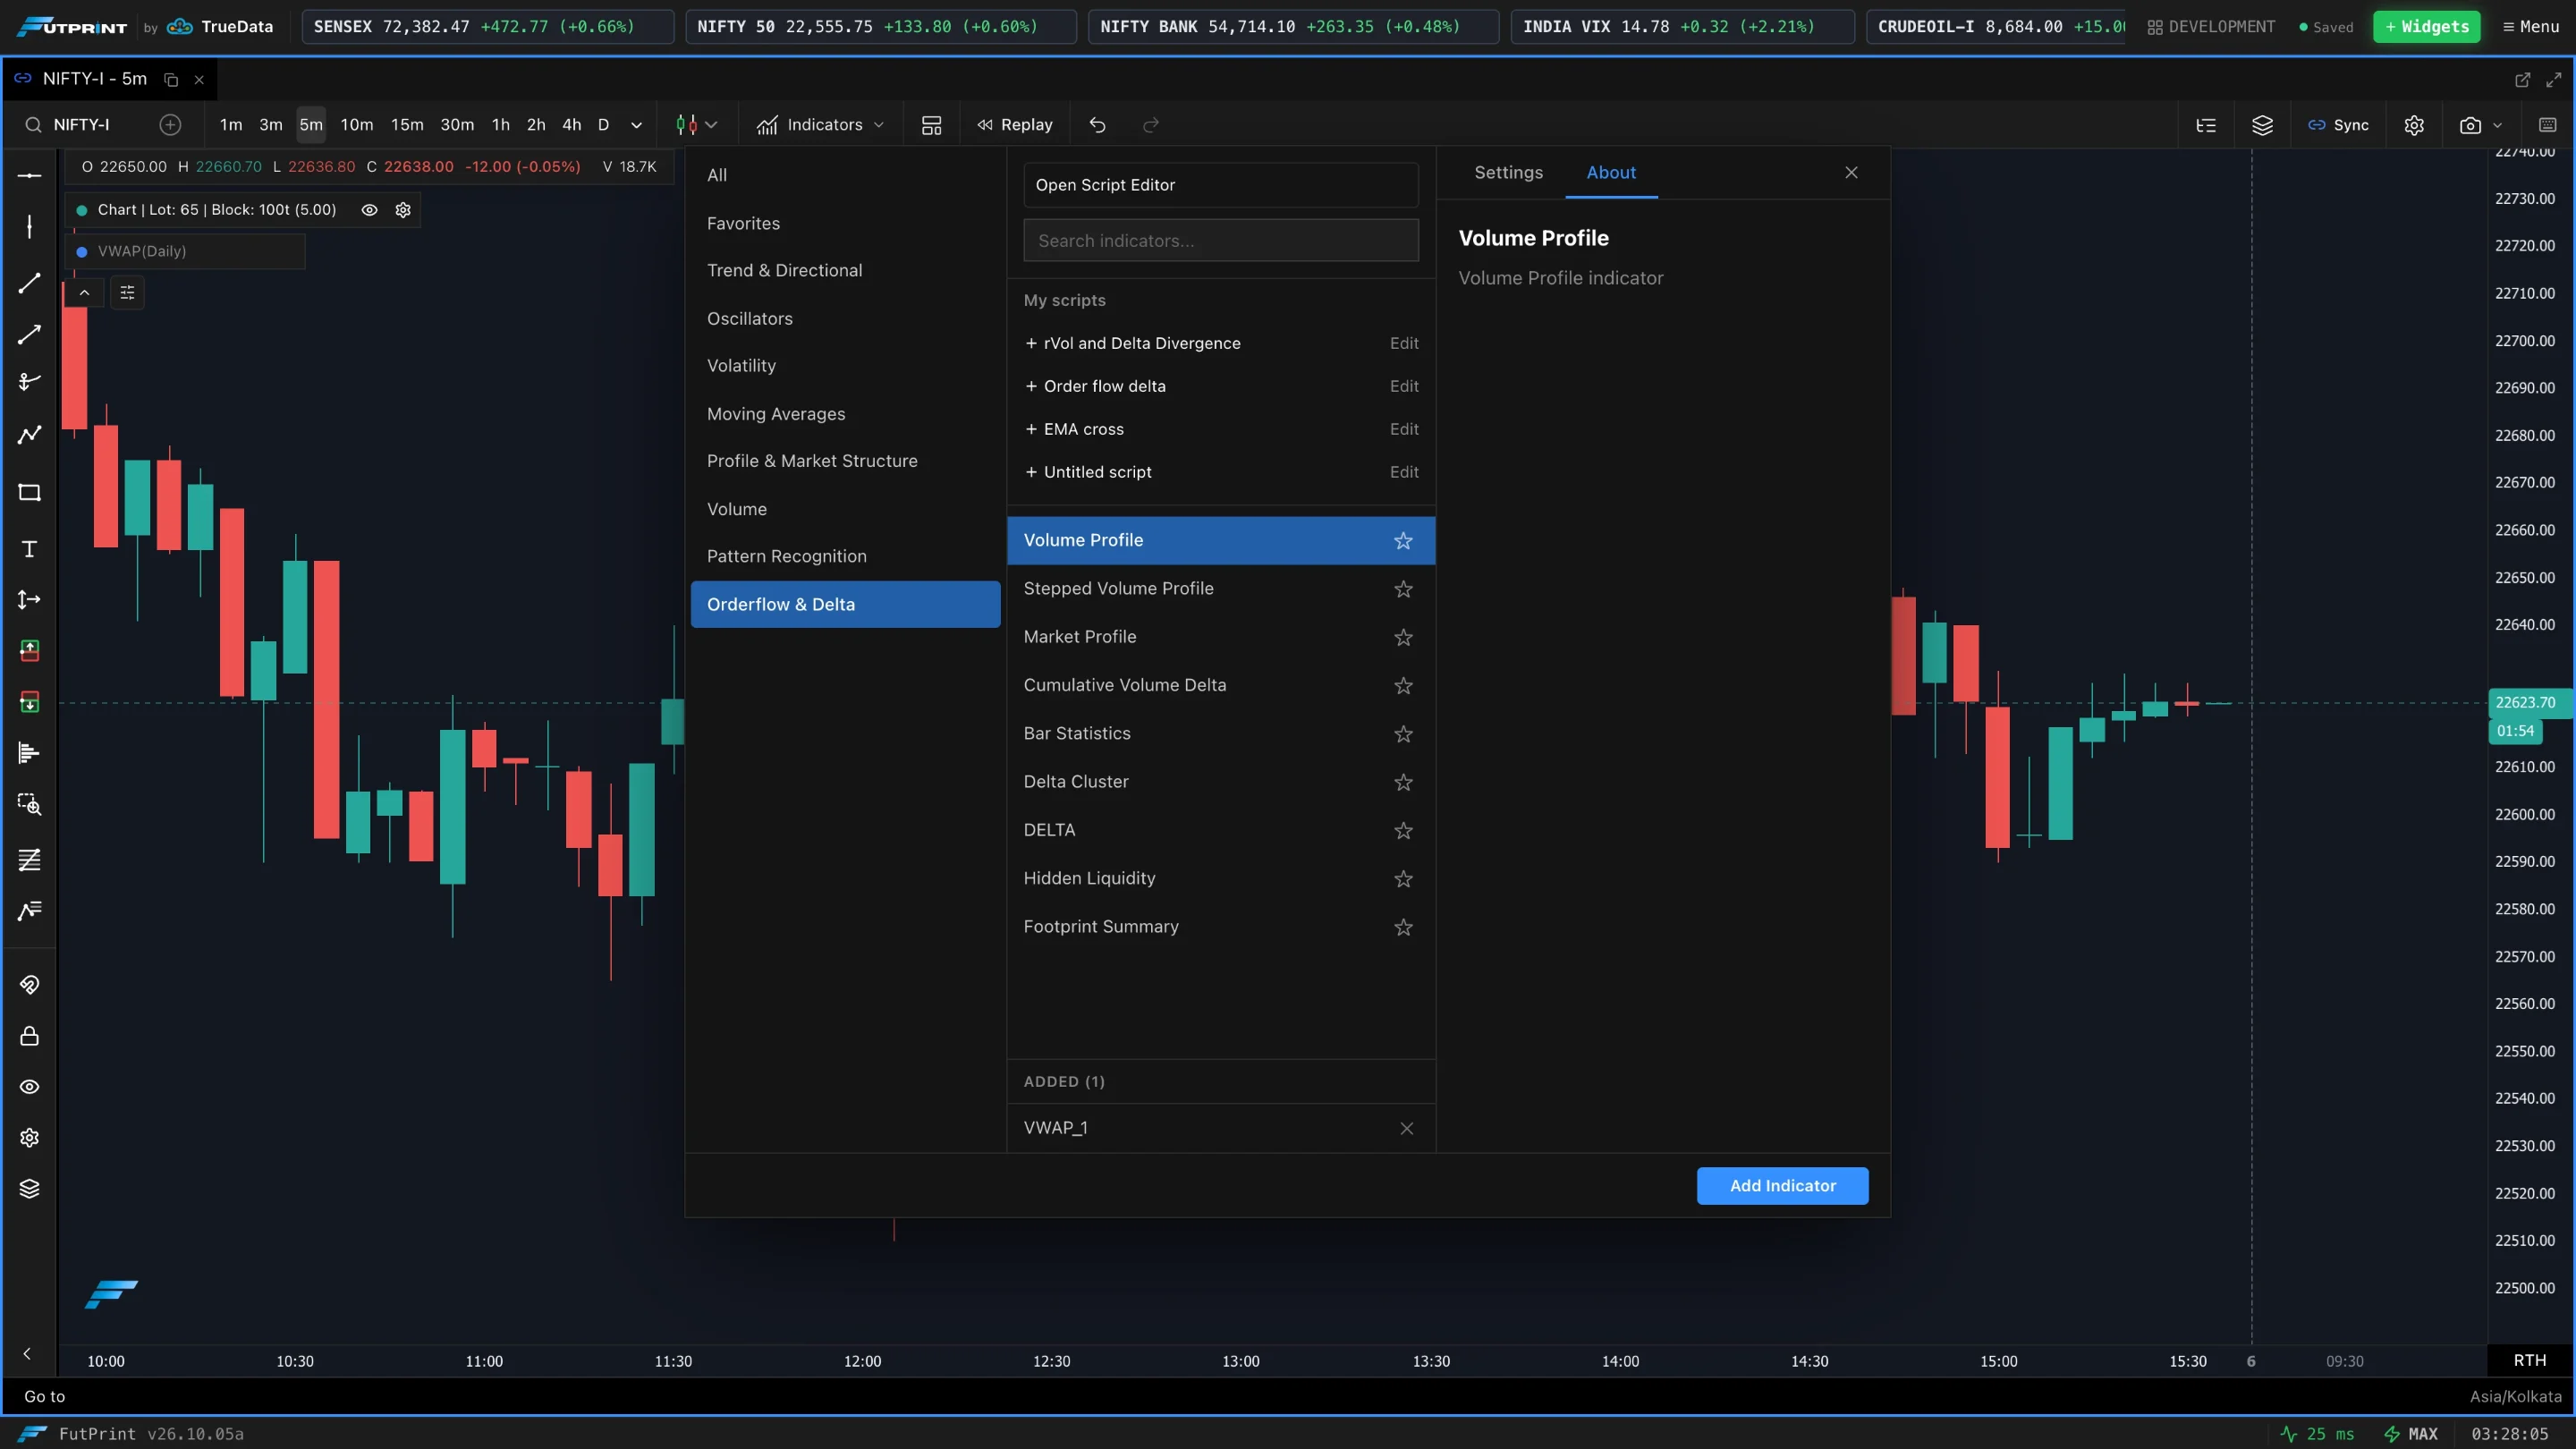
Click Indicators in the chart toolbar. The browser lists categories on the left, the indicators in the middle, and a Settings / About pane on the right. Your own scripts appear at the top under My scripts, and indicators already on the chart are listed under Added at the bottom.
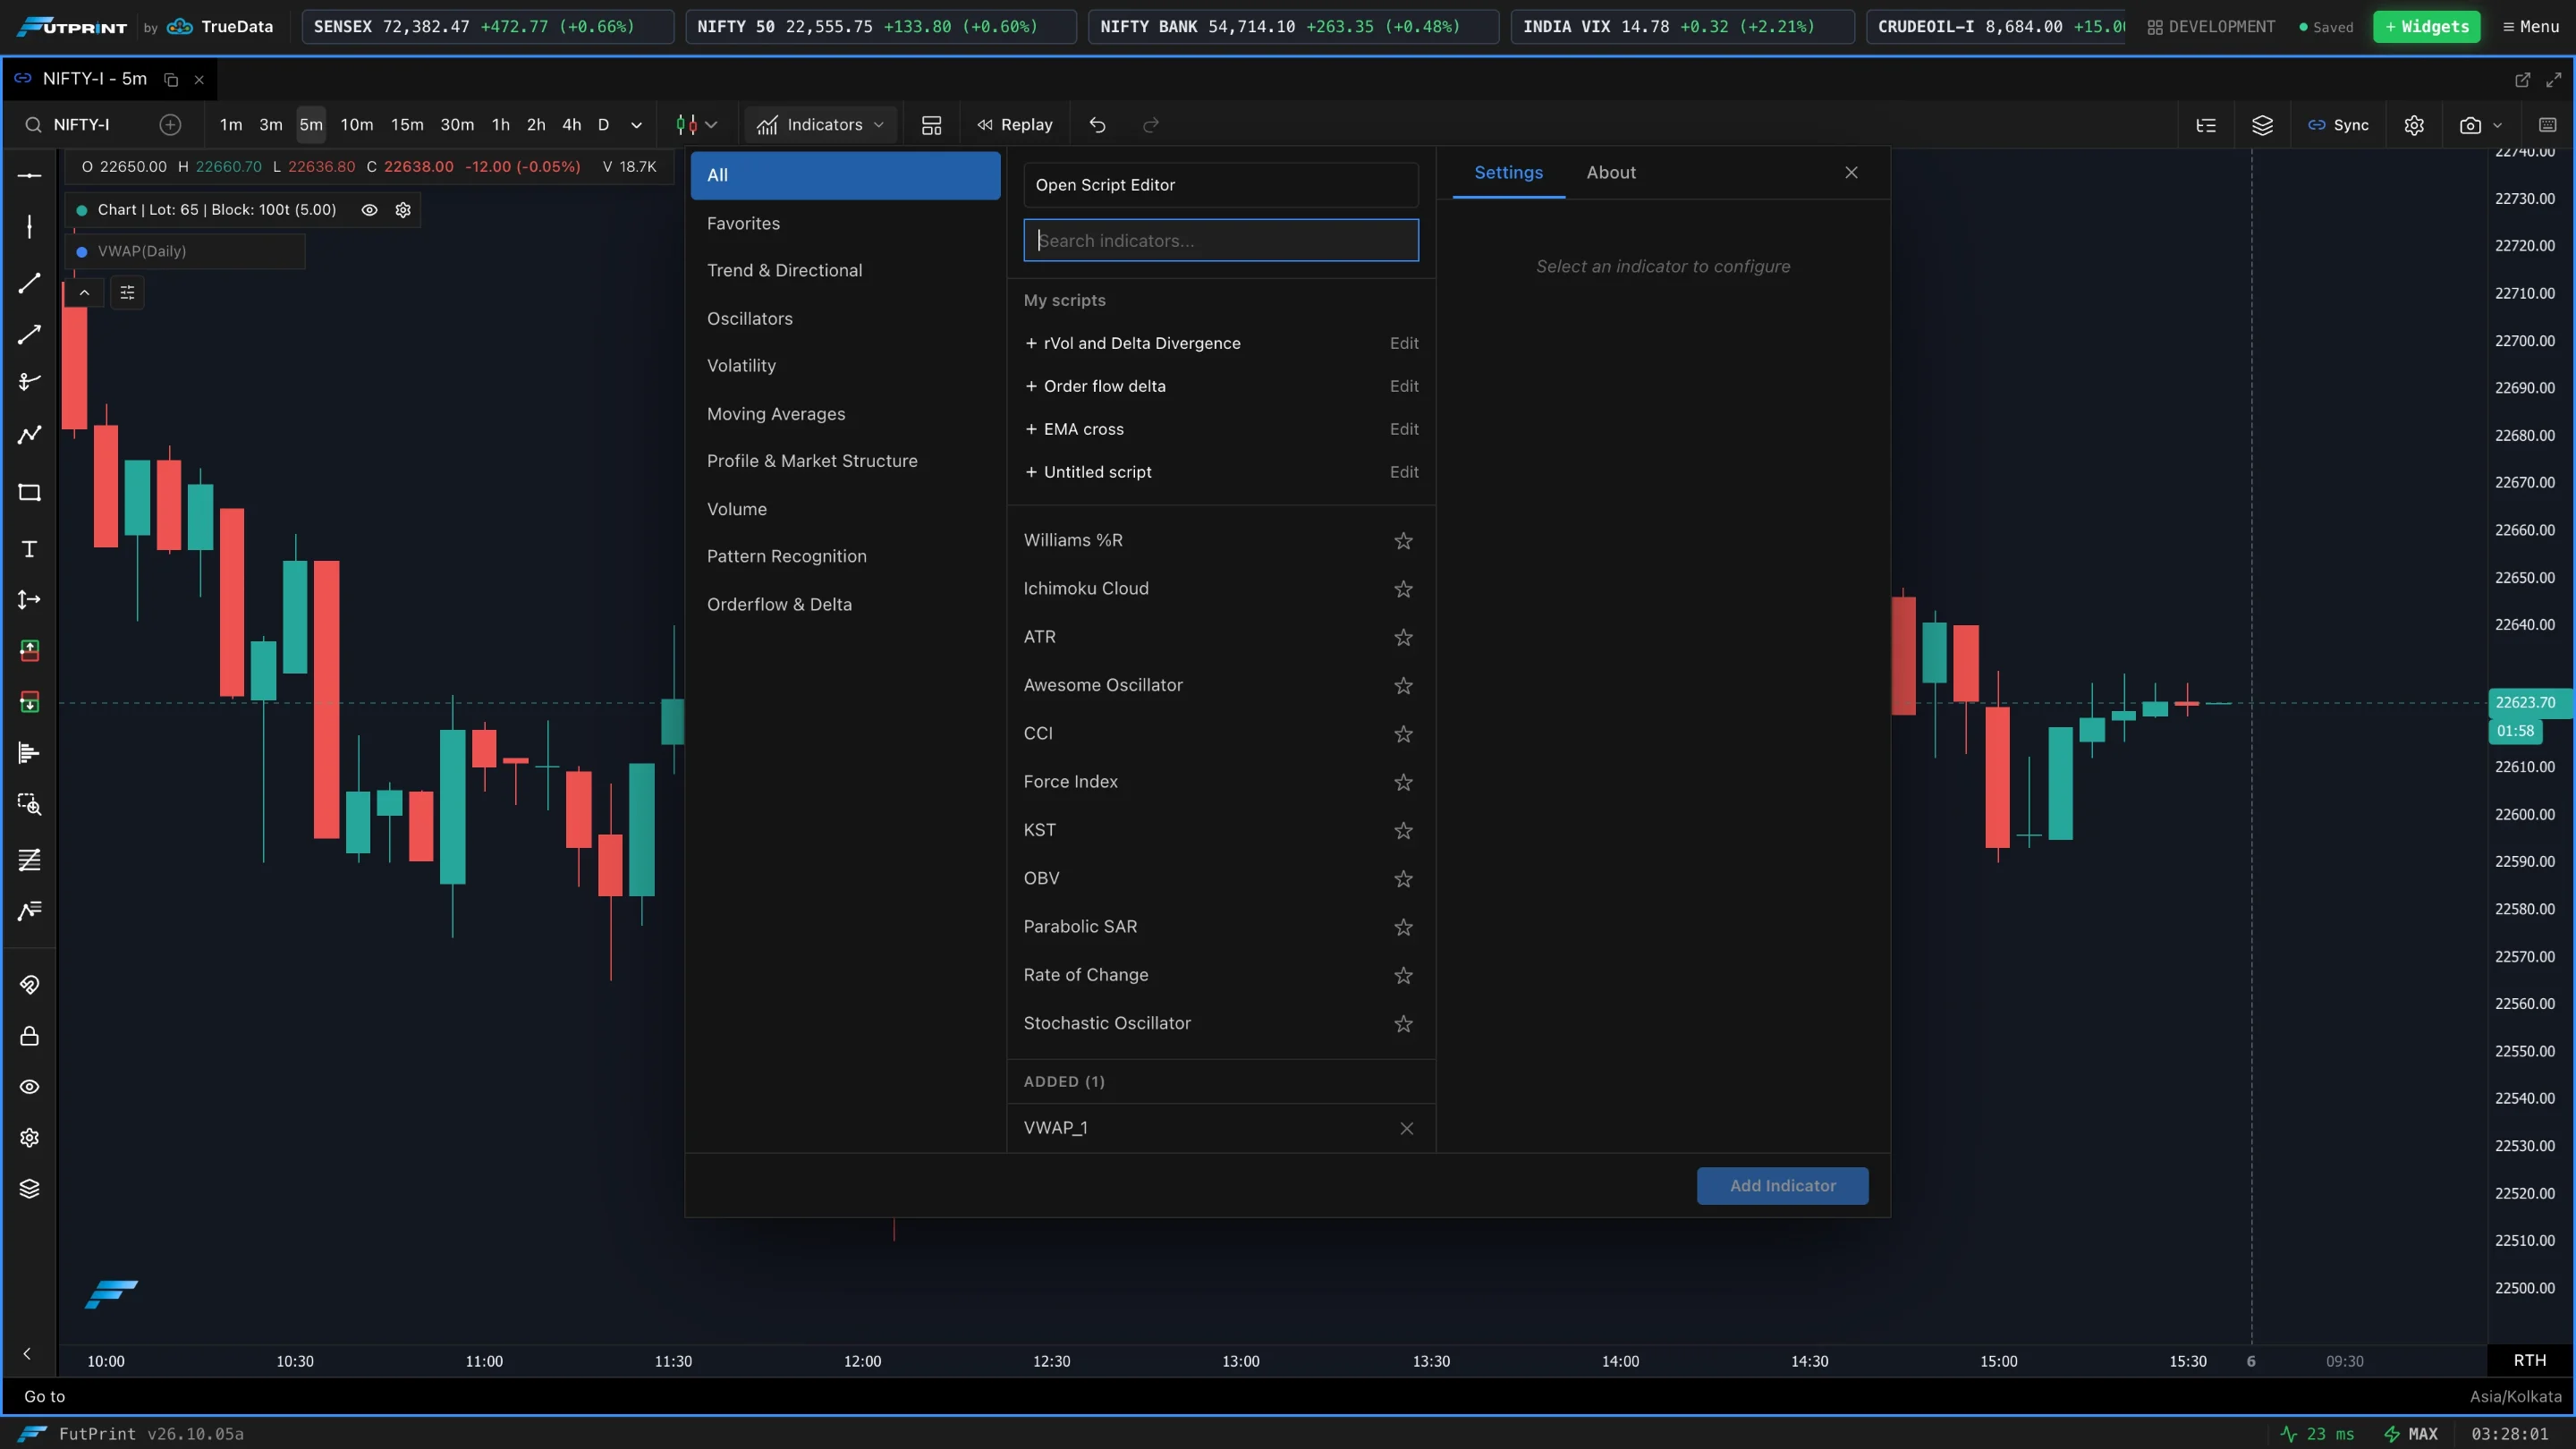
- 1Find the indicator
Pick a category to narrow the list, or type in Search indicators…. Click the star beside an indicator to keep it under Favorites.
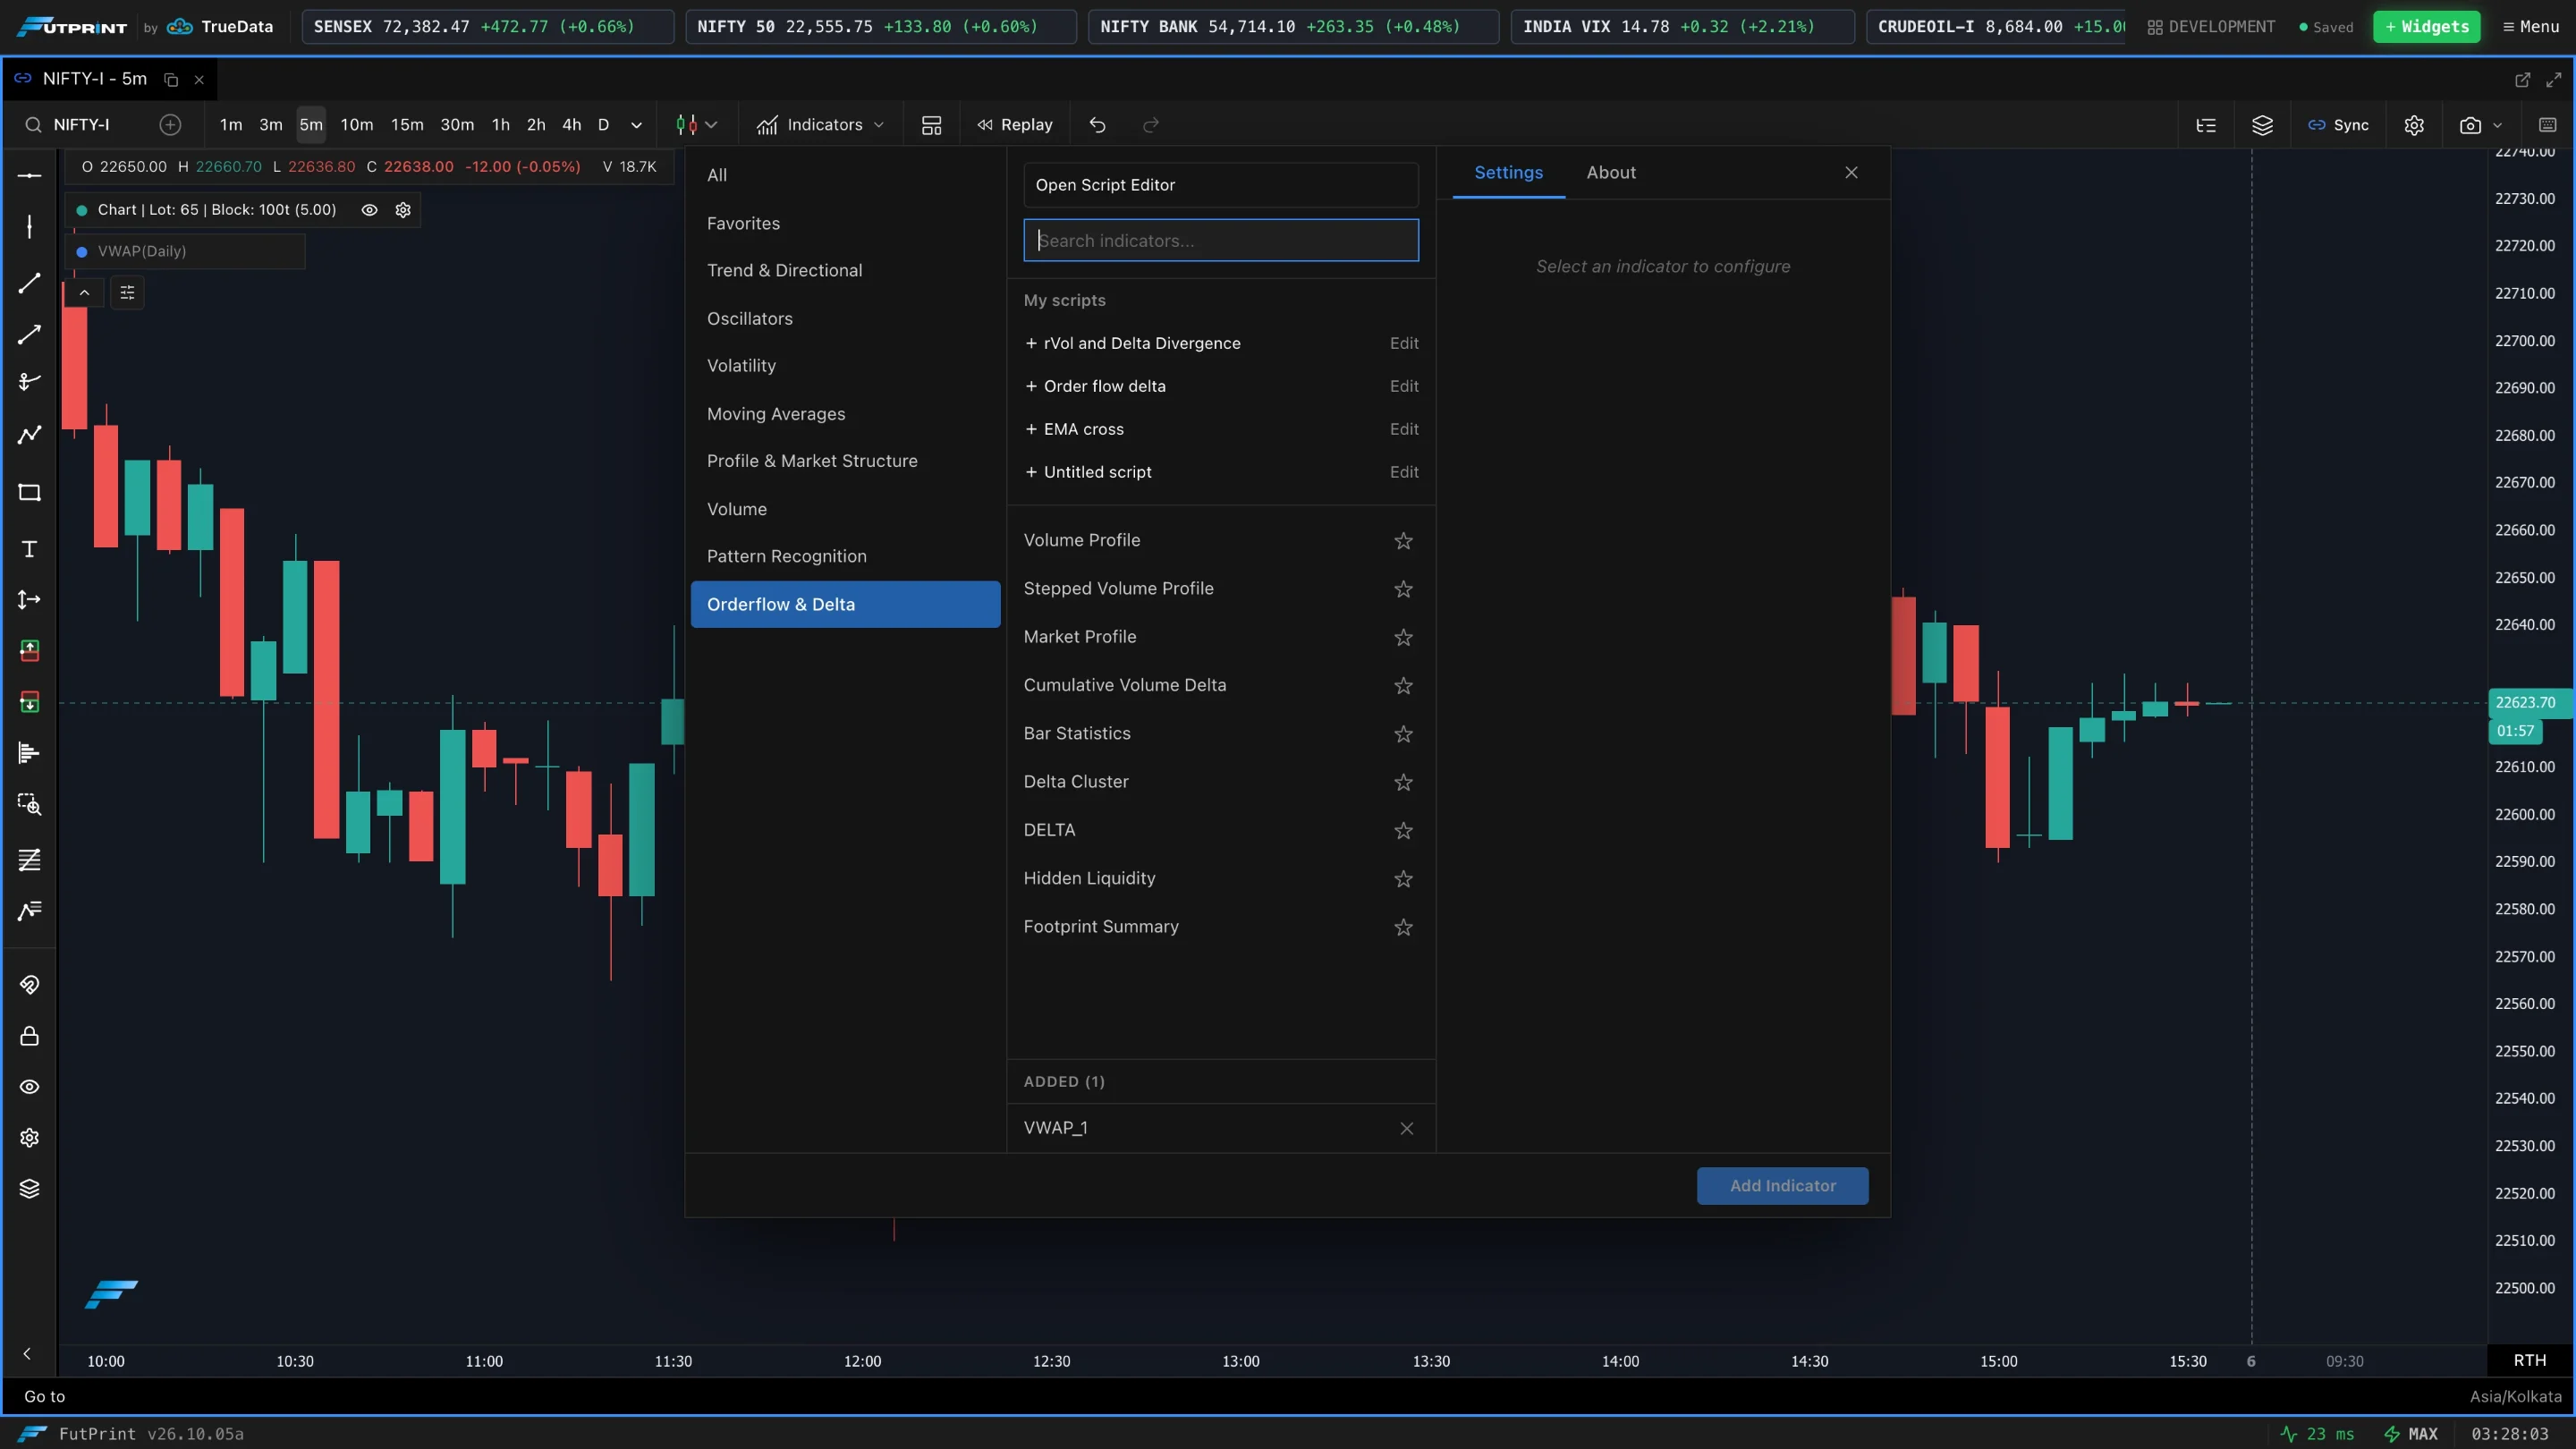
- 1Select it and review its settings
Click the indicator. Its options appear in the Settings pane so you can adjust them before adding; the About tab gives a short description.
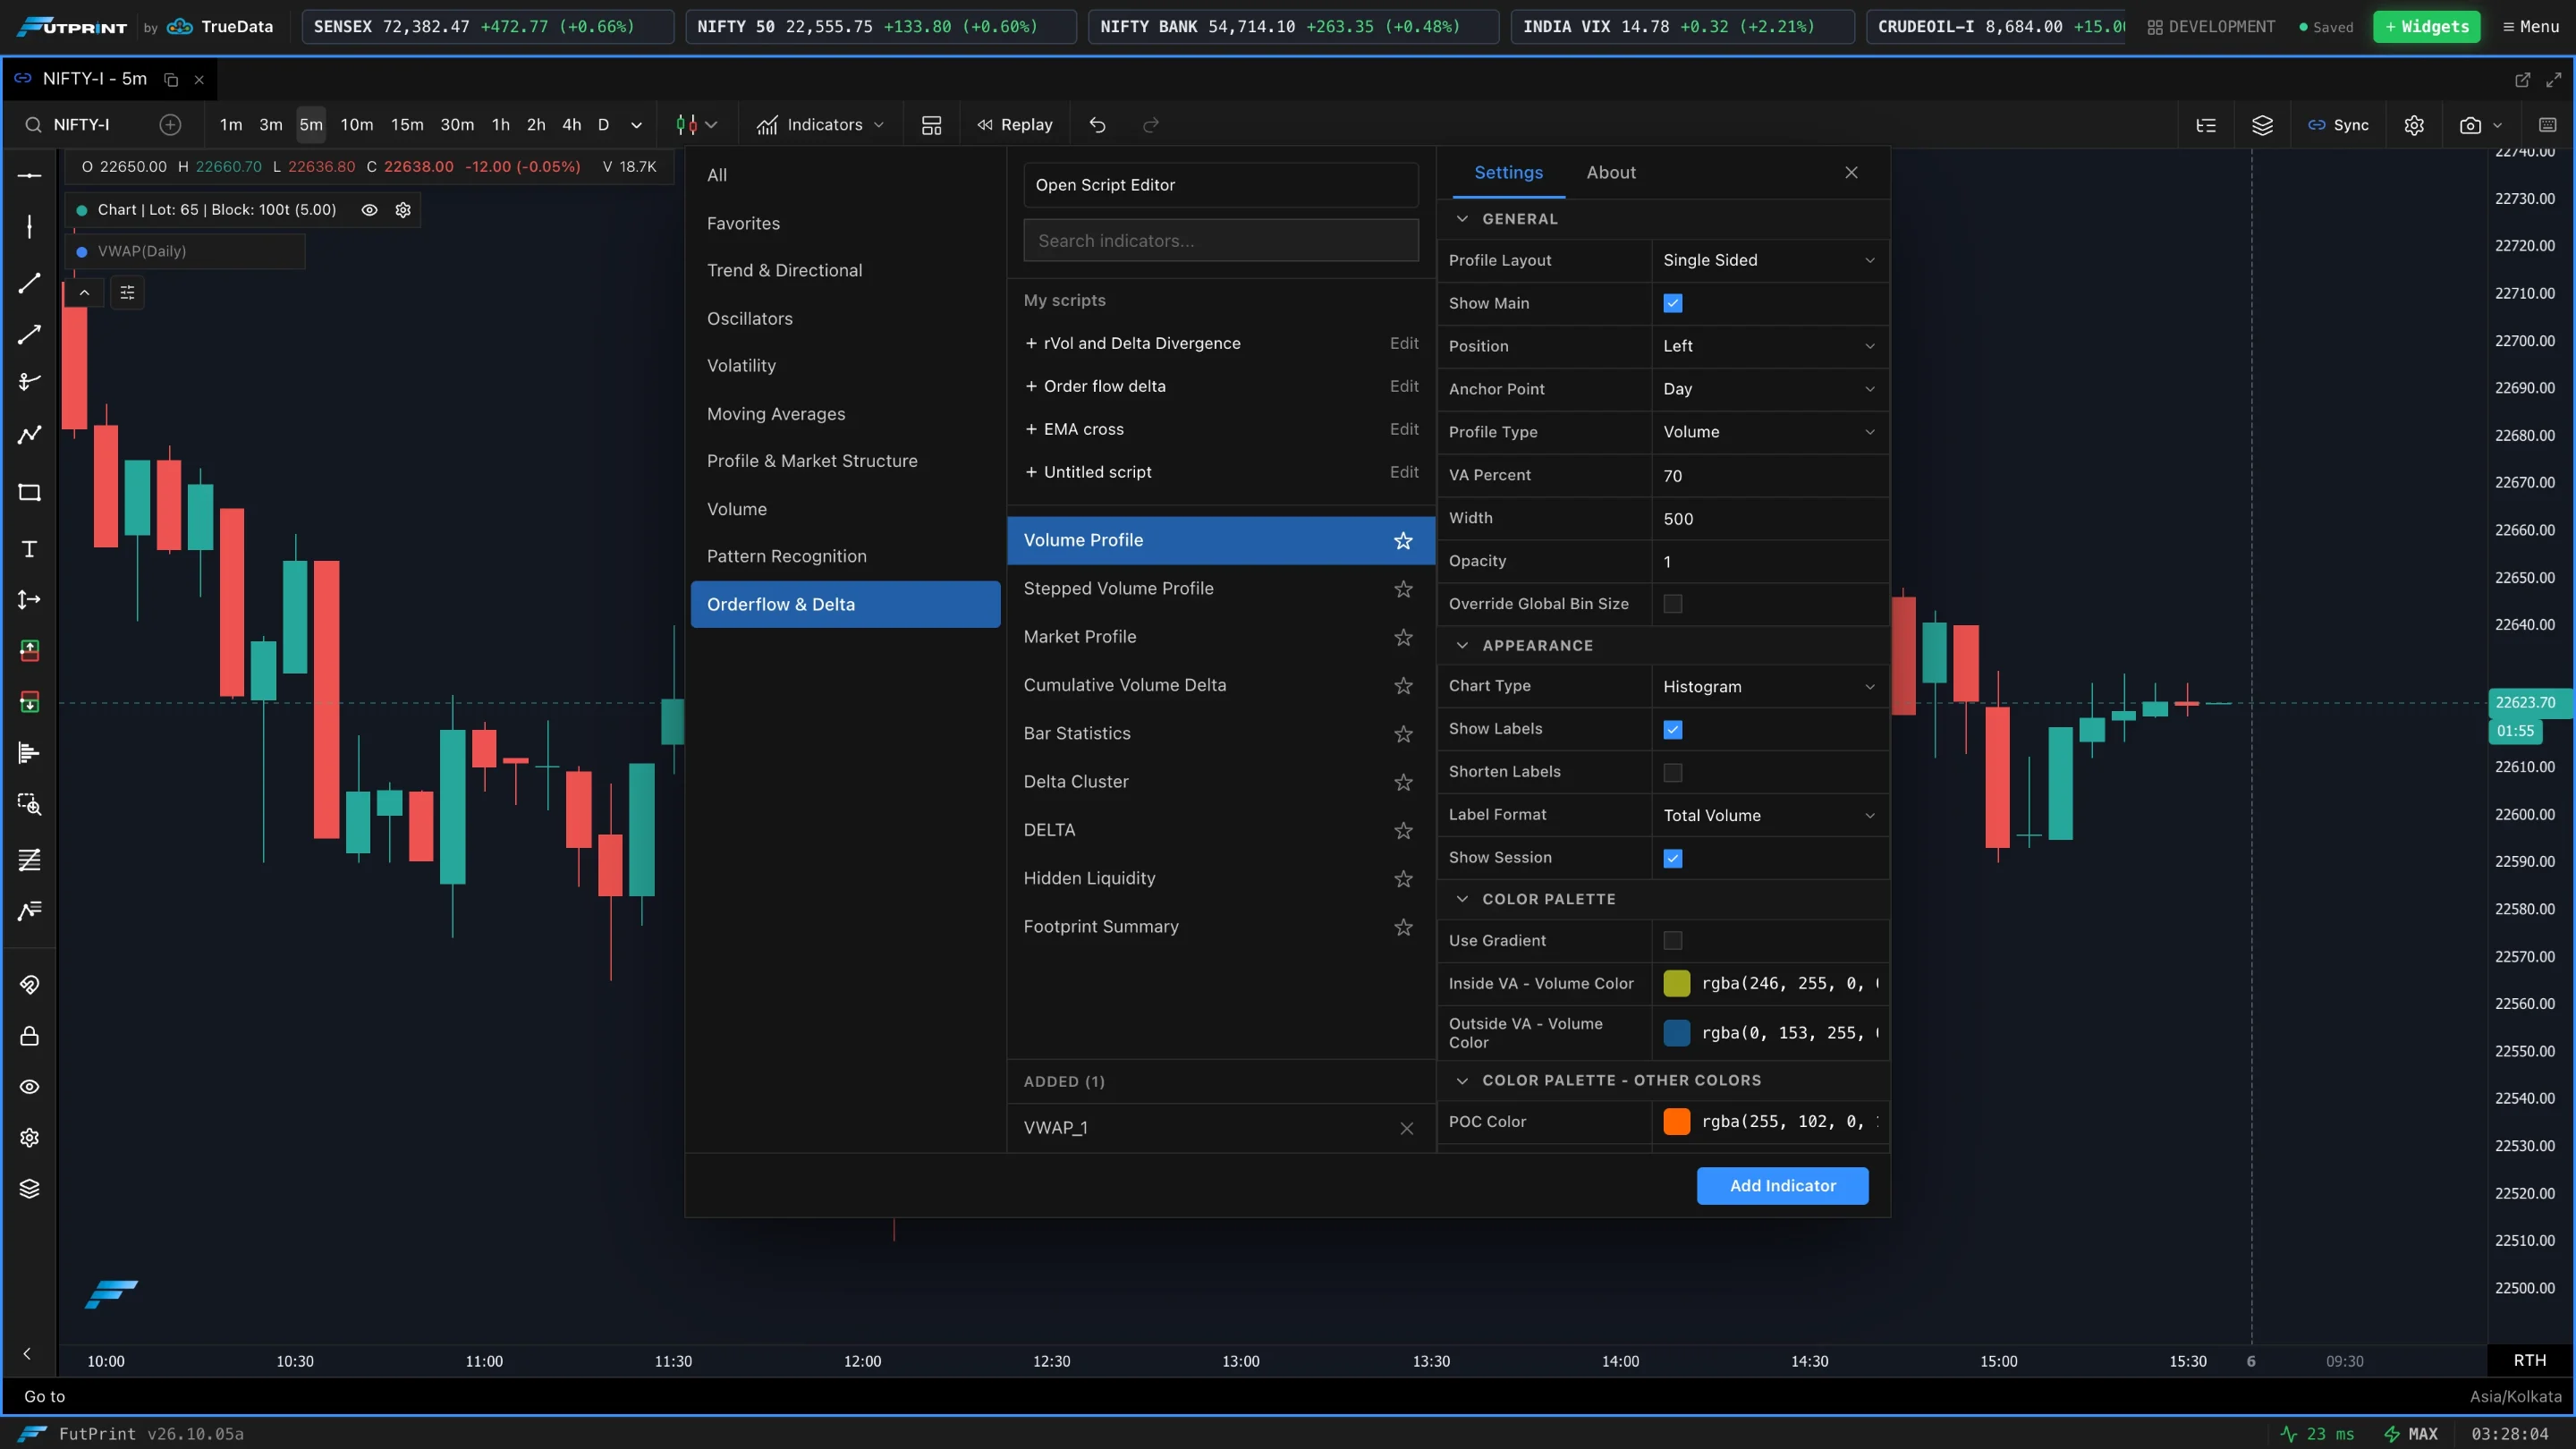
- 2Add it
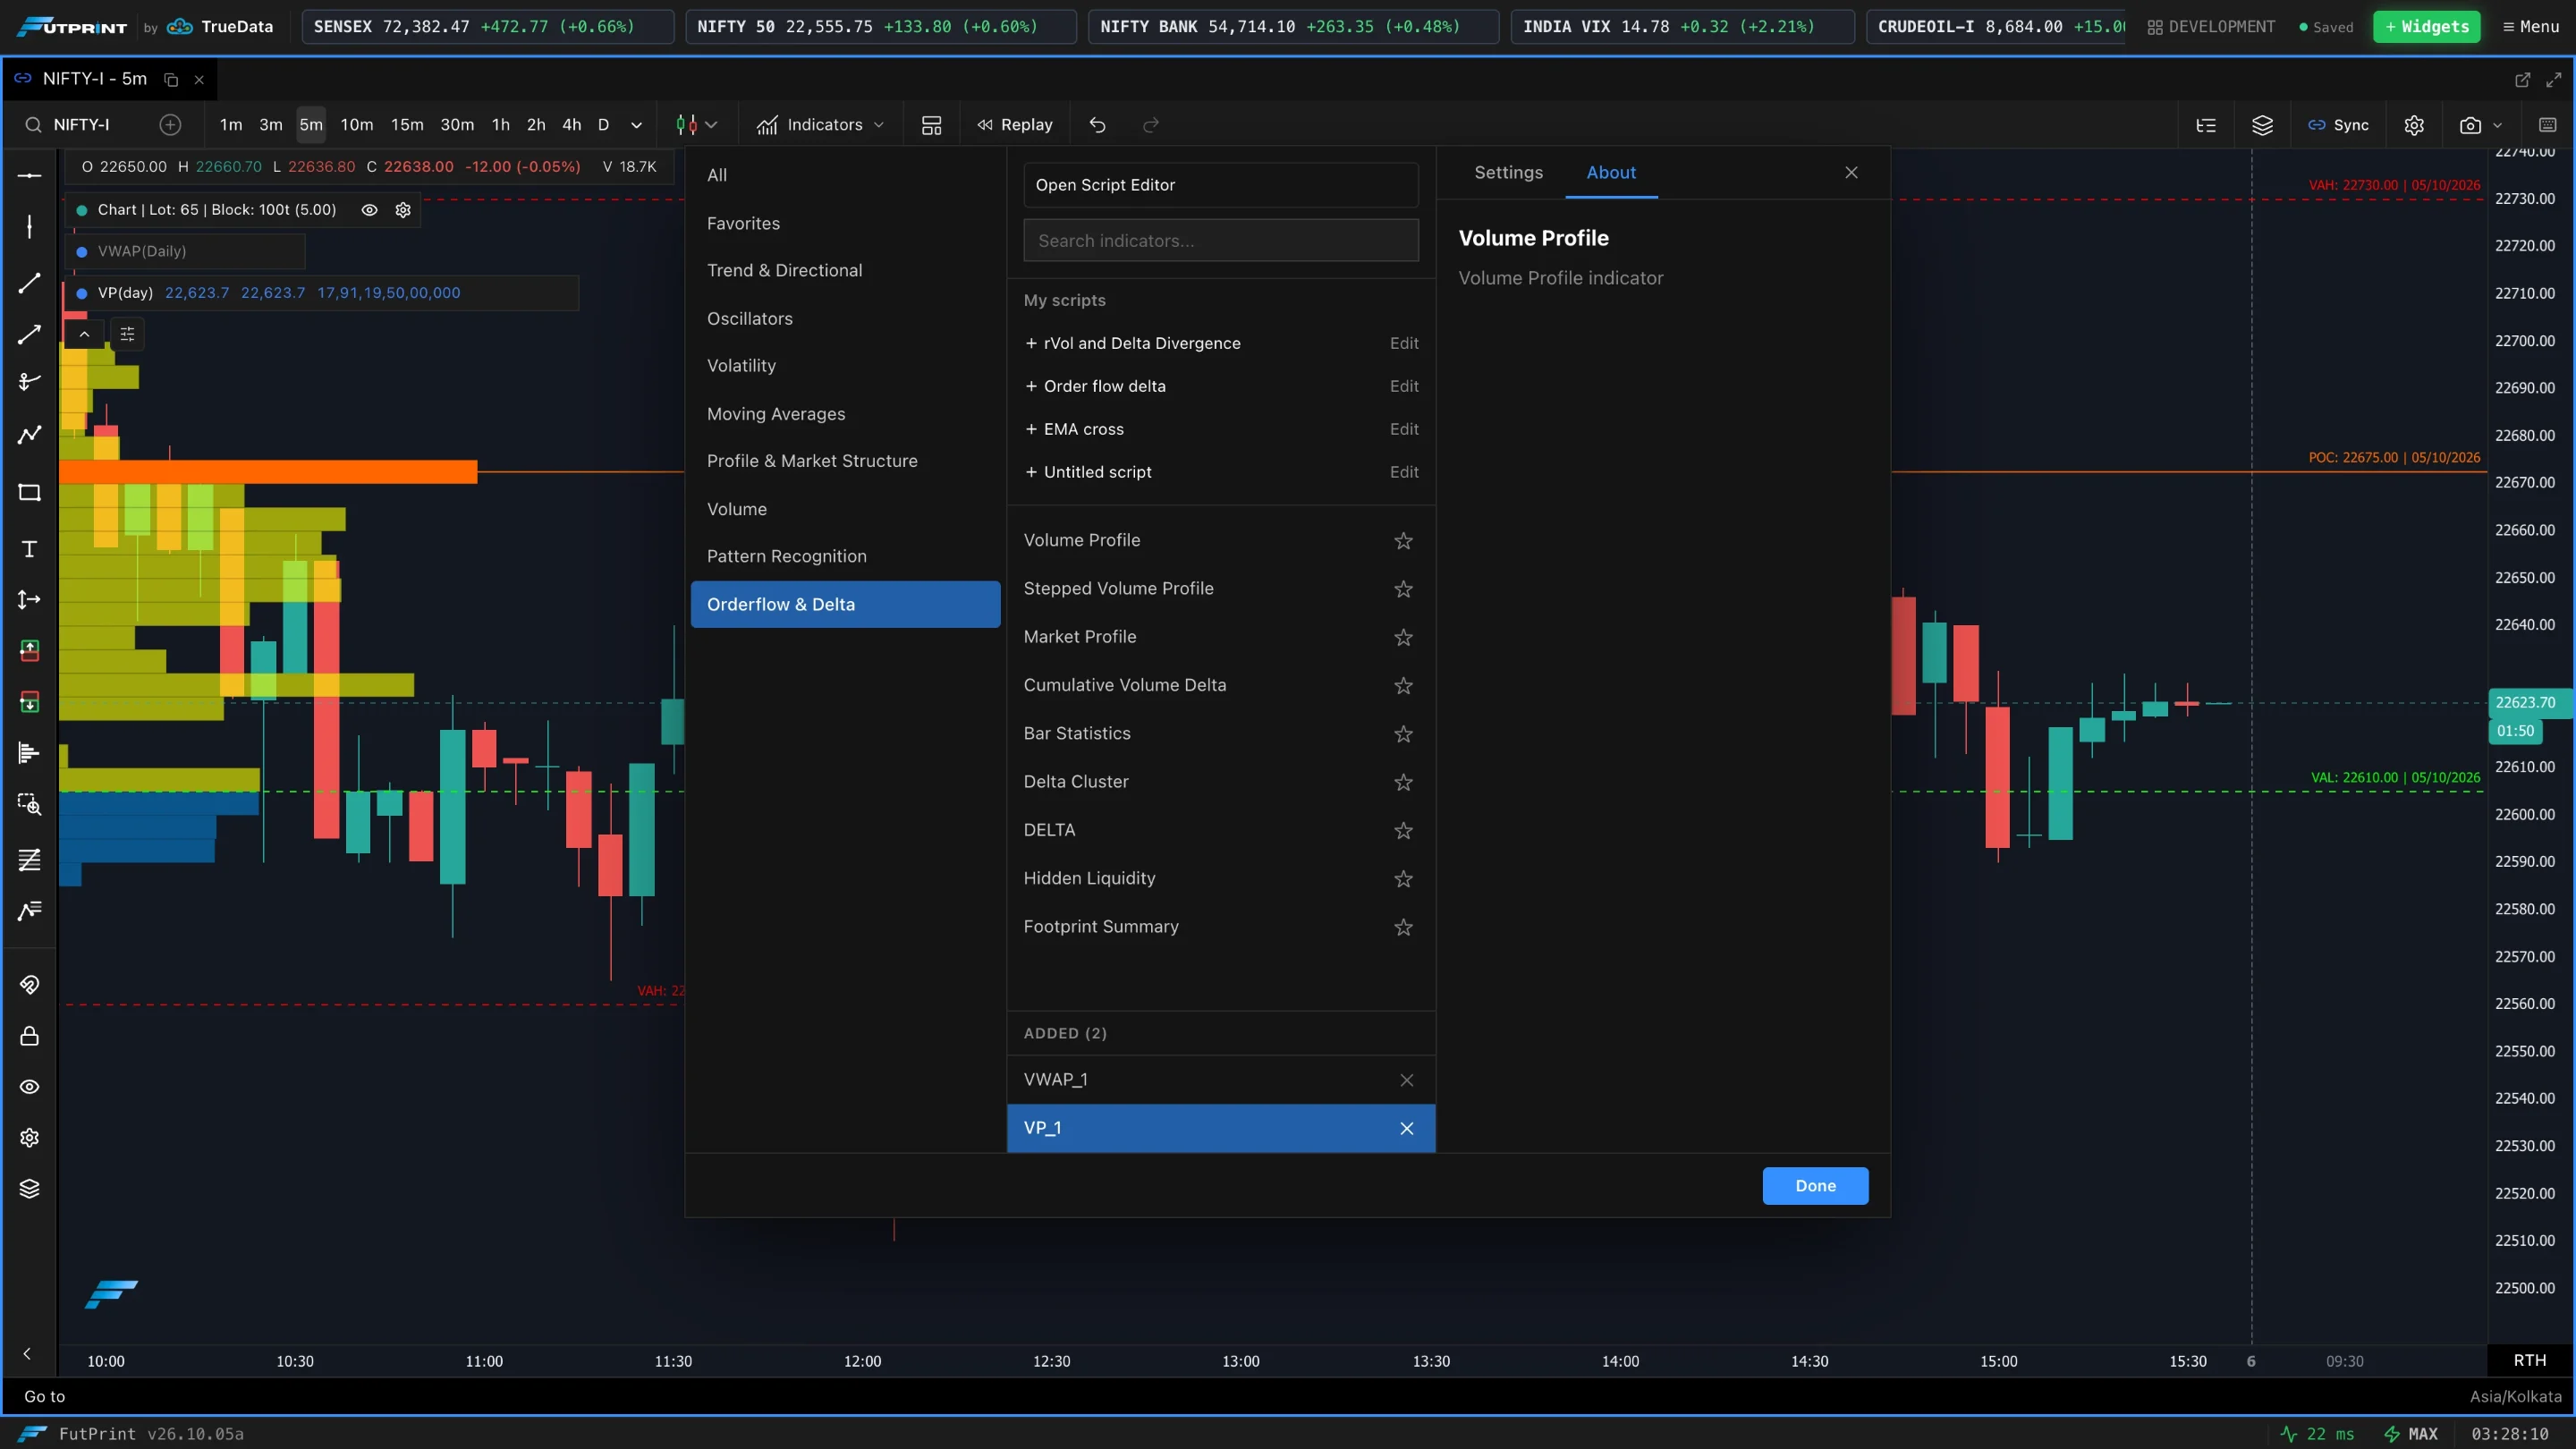
Press Add Indicator. Overlays draw on the price; other studies open in their own pane below the chart. The indicator now appears under Added.
Changing an indicator's settings
There are two ways in:
- From the browser — open Indicators and click the indicator under Added. Its options load in the Settings pane; changes apply as you make them, and Done closes the browser. The × beside it removes the indicator.
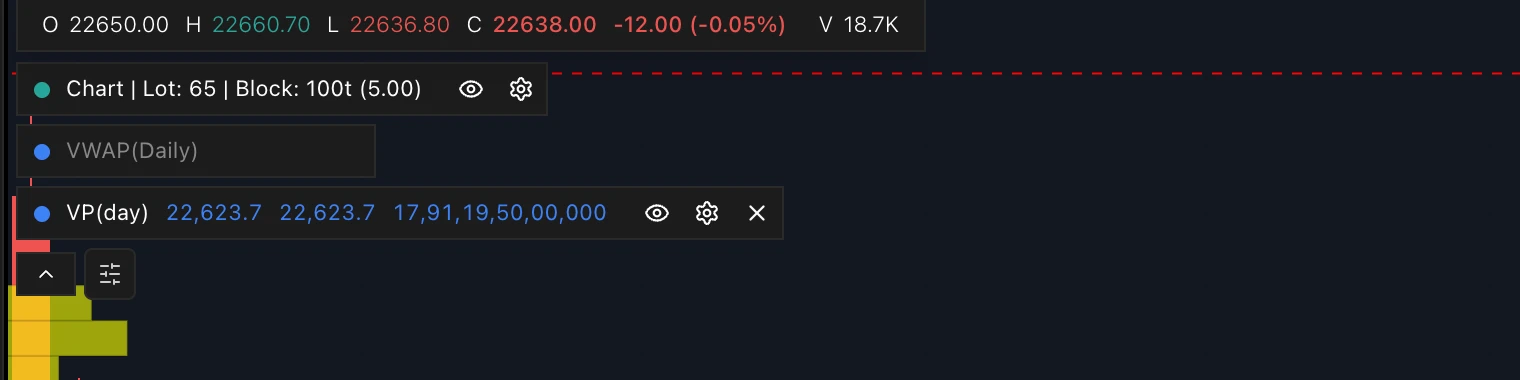
- From the chart legend — hover the indicator's row at the top-left of the chart and use the icons that appear: the eye hides or shows it, the gear opens its settings, and the × removes it.
Indicators in their own pane (CVD, Bar Statistics and others) also have controls on the pane title: Maximize pane, Hide, Settings, Reset view and Remove. Drag the divider above a pane to resize it.
The arrow under the legend collapses it to a single Indicators chip when you want the chart clear.
Managing everything on the chart
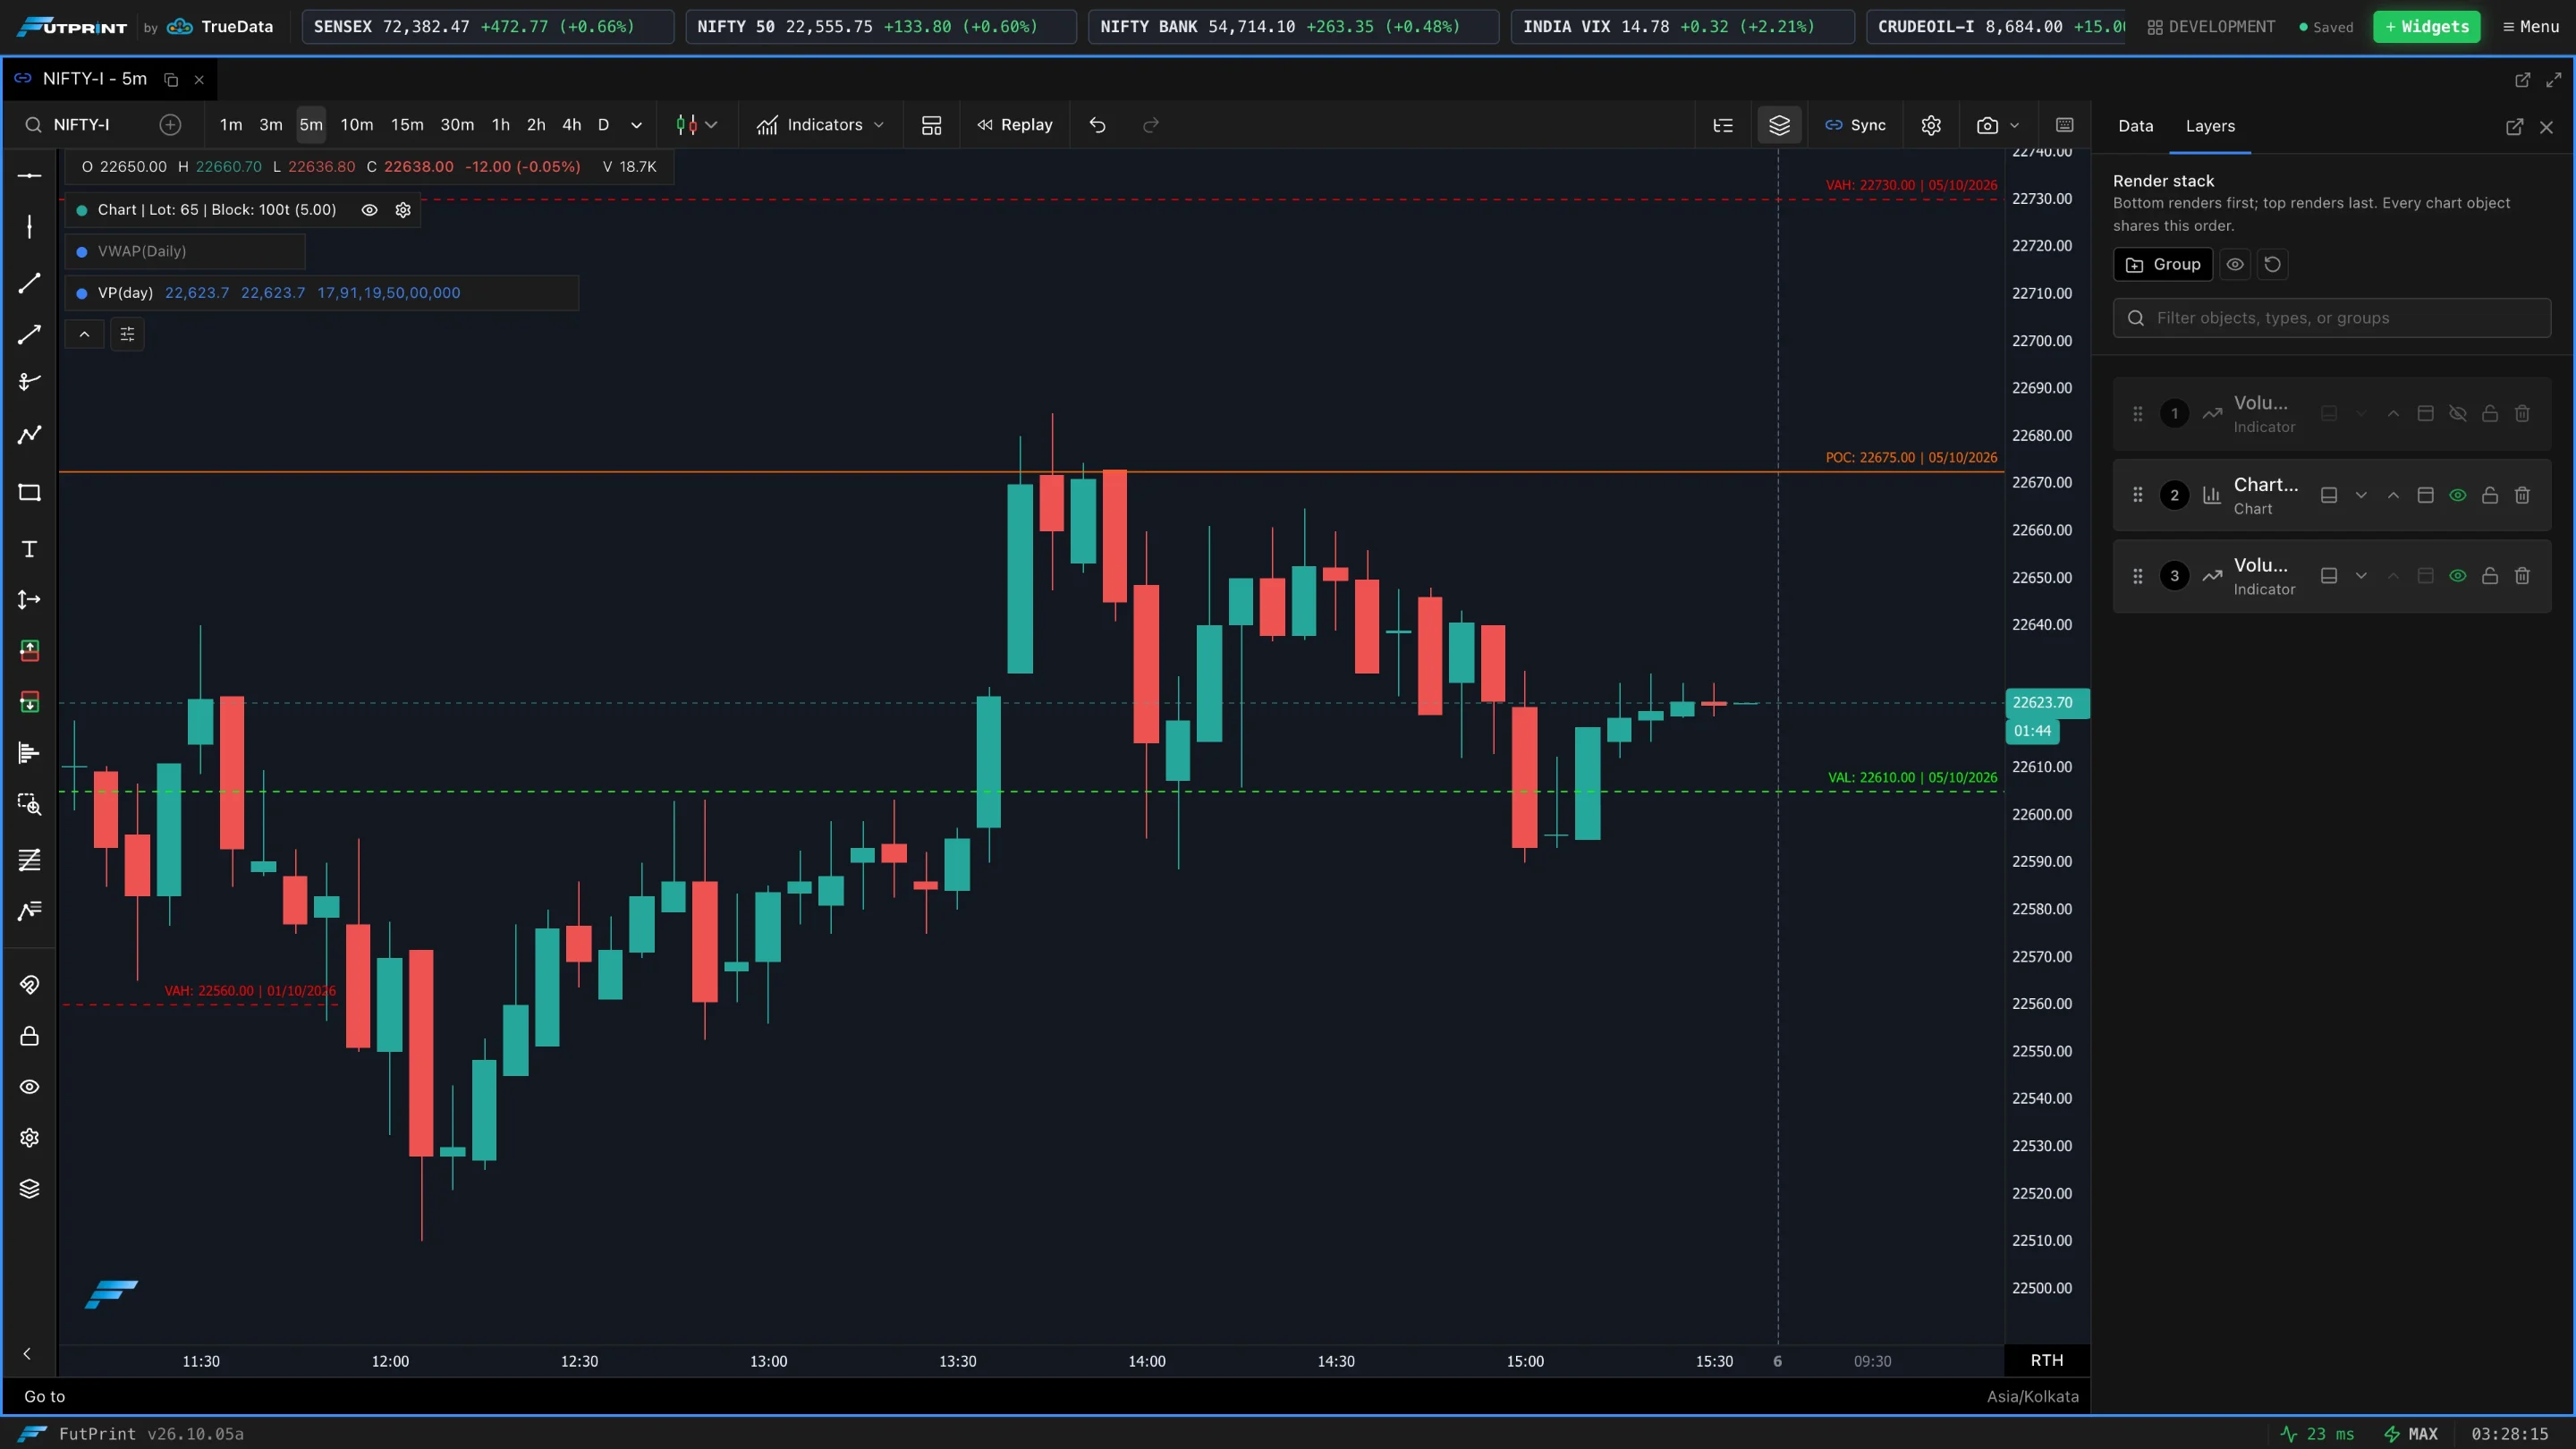
Layer Manager in the chart toolbar lists every layer on the chart — the price series, each indicator and your drawings — in drawing order. Use it to hide, lock, reorder or remove layers, and to group them.
The library, by category
Moving Averages
- Moving Average — multiple types/lengths for trend and dynamic support/resistance.
Oscillators
- RSI, MACD, MFI, CCI, Stochastic Oscillator, Stochastic RSI, Williams %R, Awesome Oscillator, Rate of Change, TRIX, KST, Force Index.
Trend & Directional
- ADX, Parabolic SAR, Ichimoku Cloud, Gann Levels.
Volatility
- ATR, Bollinger Bands.
Volume
- Volume, OBV, Volume Profile, Stepped Volume Profile, Cumulative Volume Delta.
Order-flow & Delta
- Delta, Delta Cluster, Footprint Summary, Bar Statistics.
Profile & Market Structure
- Market Profile, Williams Fractals, Option Strikes, Option Strikes Profile.
Pattern Recognition
- Candlestick Patterns.
Options & Greeks
- Implied Volatility, Delta, Gamma, Theta, Vega, Rho — study option greeks and IV directly on the chart.
- Gamma Blast — the option chain's dealer gamma drawn on an index futures chart: call/put walls, the zero-gamma flip, a greeks table and entry markers with stop and target.
Price
- Typical Price.
Trend/level studies (moving averages, Bollinger Bands, VWAP, SAR, Ichimoku, profiles) draw on the price. Oscillators (RSI, MACD, Stochastic, MFI, CCI, …) and volume/delta studies open in their own sub-pane so they don't crowd the candles.
Once you've got a chart configured the way you like — type, indicators and styling — save it with the Templates Manager and apply it to any other chart in one click.
Detailed guides
Every option, with screenshots in both themes:
Guides for the remaining studies are being added progressively.