IV Smile
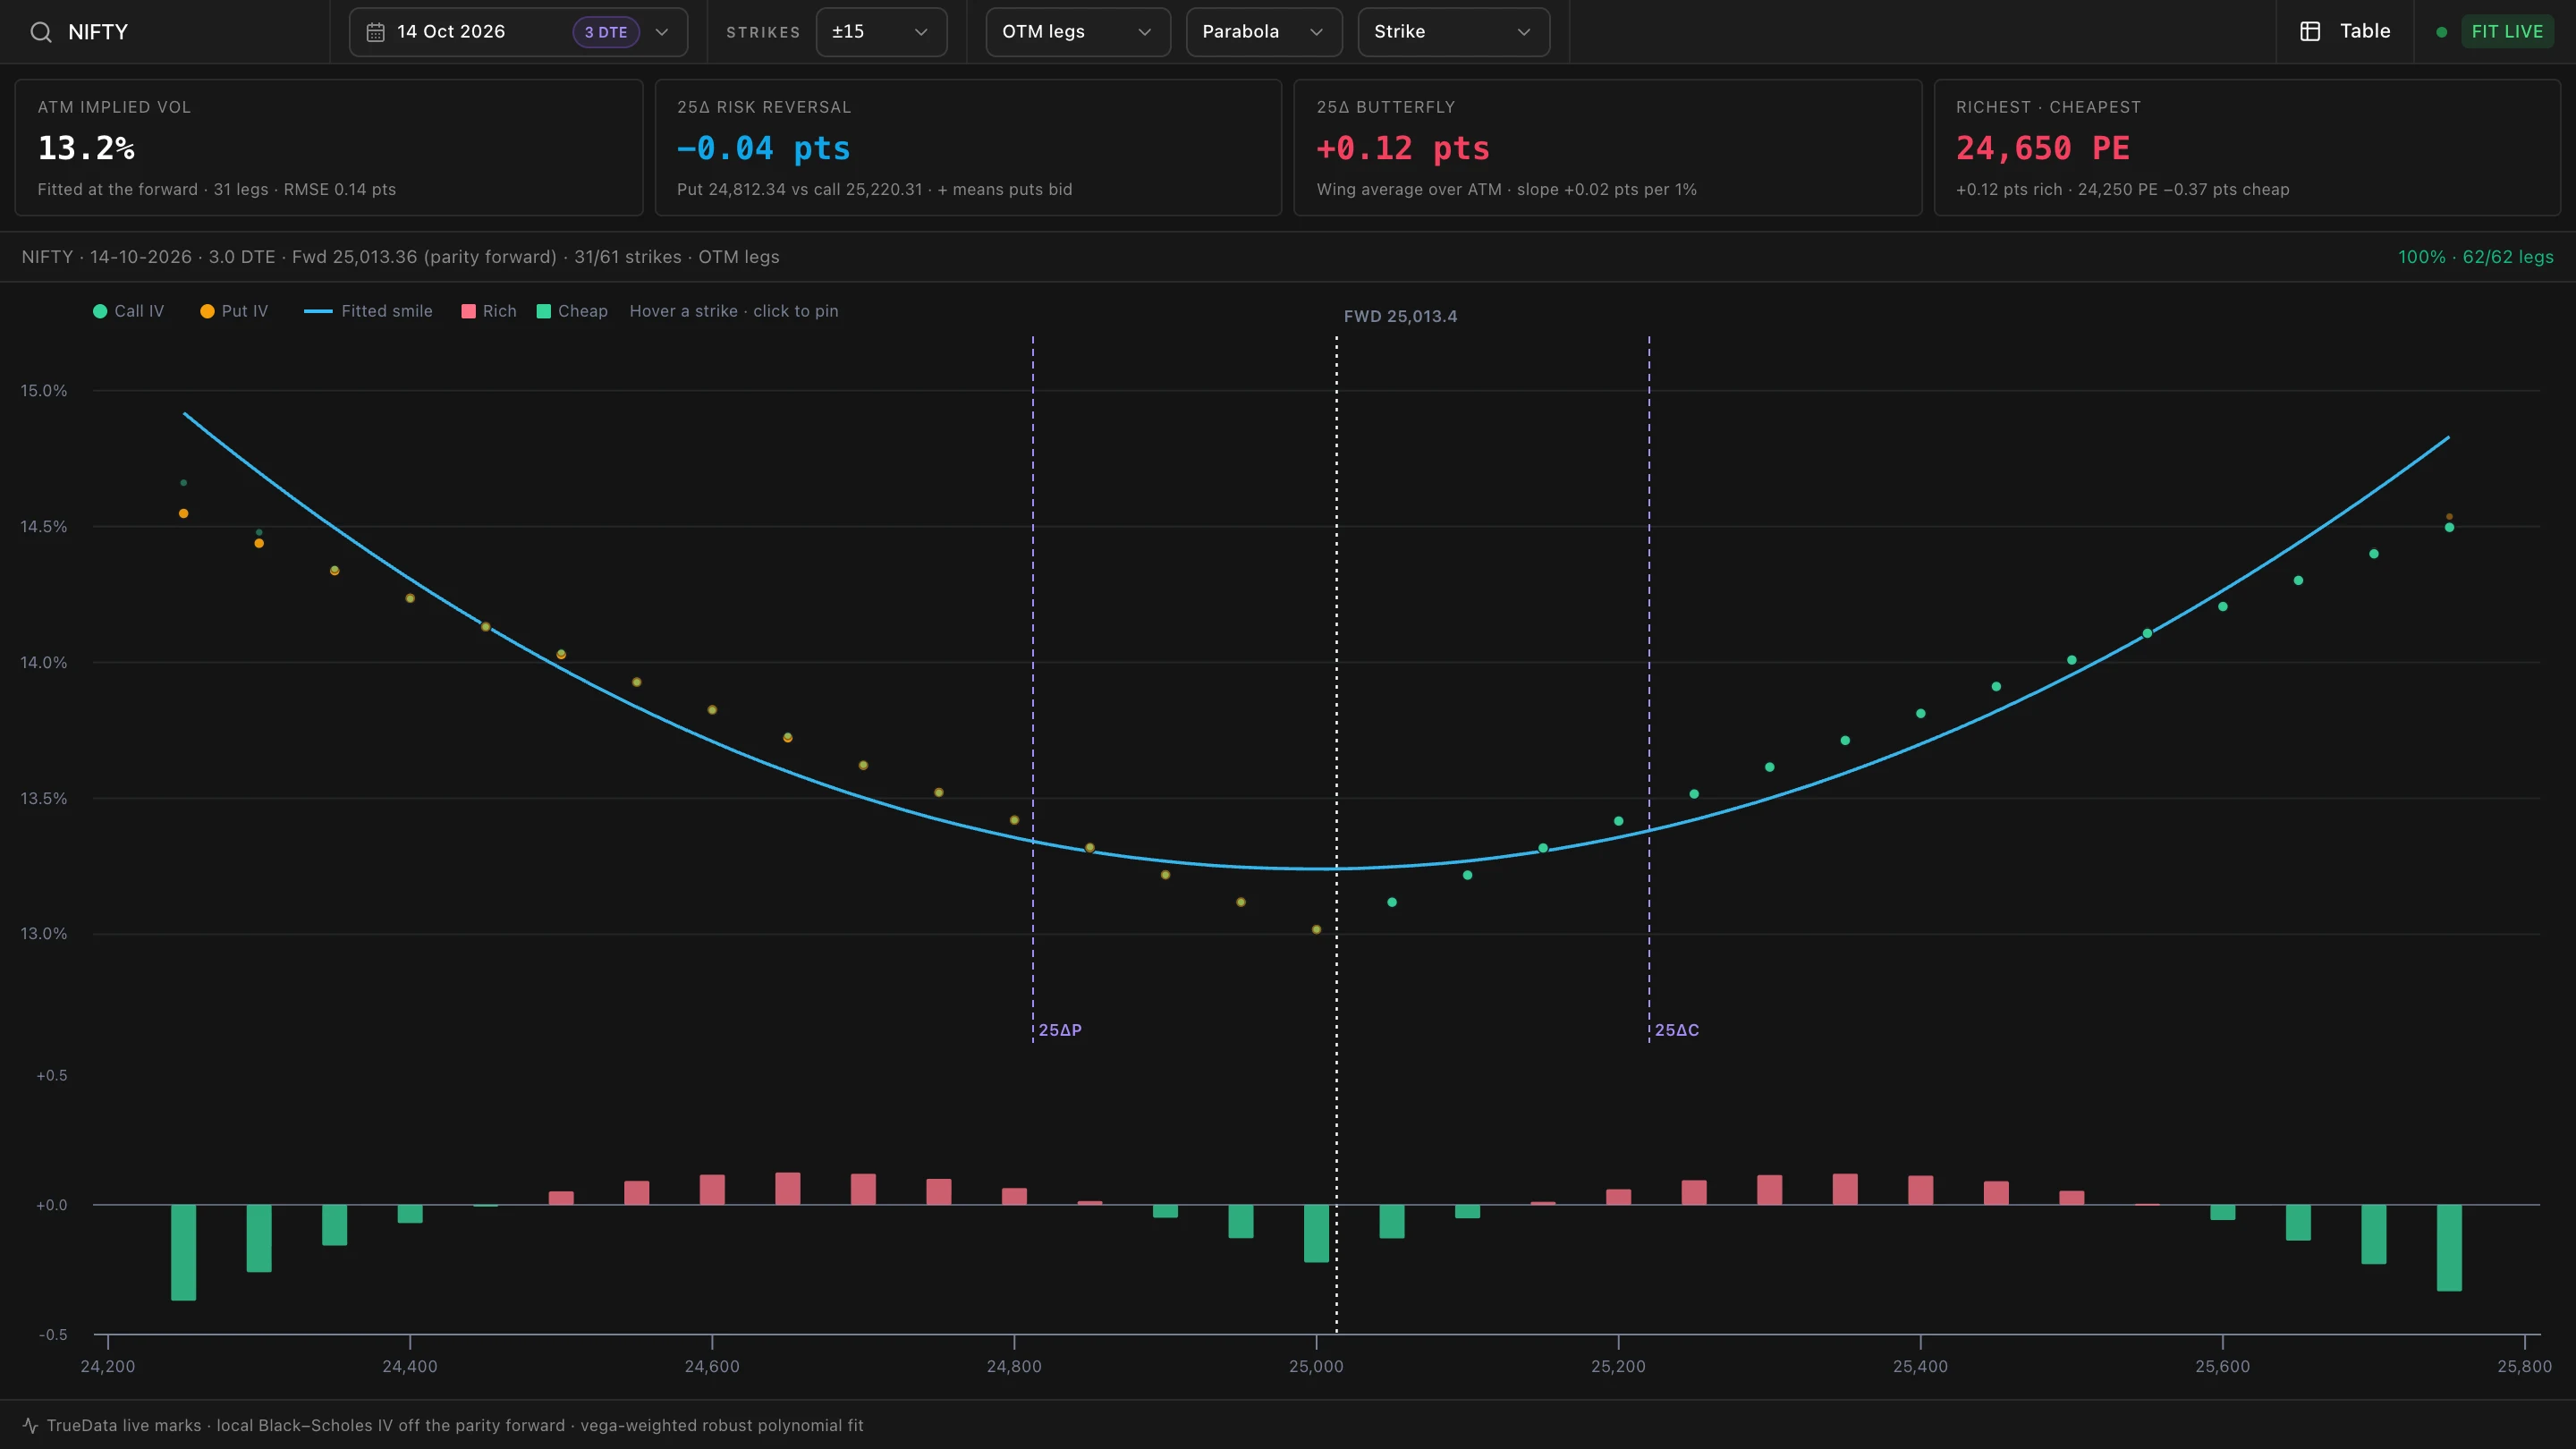
IV Smile solves an implied volatility for every strike of a live expiry, fits a smile through them and reads the skew off the fit, so you can see which strikes trade rich or cheap against the rest of the chain.
Loading a smile
- 1Choose an underlying
Search for an index or futures underlying. The widget resolves its spot and front future and prices every strike off the same forward the Option Chain and Gamma Exposure use: put-call parity at the money, else the traded future, else the spot carried to expiry. The footer names which one is in use.
- 2Choose an expiry
The nearest upcoming expiry is selected initially. One smile is fitted per expiry.
- 3Choose the strike scope
±5 to ±30 strikes around the money. Wider scopes show more of the wings but take longer to warm up on an illiquid chain.
The fit
| Control | Options |
|---|---|
| Legs | OTM legs (puts below the forward, calls above; the liquid side of each strike), Calls, Puts, or Calls + puts (every solved leg, parity gaps included). |
| Shape | Parabola (a symmetric smile with a slope) or Cubic (allows an asymmetric smirk). |
| Axis | Strike, Moneyness % (distance from the forward) or Delta. |
The fit is a vega-weighted robust polynomial in log-moneyness. Legs whose vol could not be solved (a stale or below-intrinsic mark) are left out and shown hollow.
The cards
- ATM implied vol is the fitted vol at the forward, with the number of legs in the sample and the fit's RMSE in vol points.
- 25Δ risk reversal is the 25-delta put vol minus the 25-delta call vol. A positive value means puts are bid, the normal state for an index.
- 25Δ butterfly is the average of the two 25-delta wing vols over the ATM vol, with the smile's slope per 1% of moneyness.
- Richest · cheapest names the strikes with the largest residual above and below the fit, in vol points.
Chart and table
Chart draws every solved call and put vol, the fitted curve, the forward, and the 25-delta strikes. Click a point to pin it; Esc releases it.
Table lists each strike's moneyness, put and call vol, the fitted vol, the residual (red rich, green cheap, tinted by size), the delta, the mark used and the OI. Rows outside the fit sample are dimmed.
The status badge reads FIT LIVE once at least 60% of the scoped legs have a usable mark. When the market is shut or the feed is thin, the panel loads the previous session's closes and shows PREVIOUS SESSION.
What's saved
The underlying, expiry, strike scope, legs, shape, axis and chart/table view are stored with your workspace.