Chart — Drawing Tools
Drawing tools let you mark up the chart — trend lines, levels, channels, Fibonacci, trade plans and more. Pick a tool from the drawing rail, then click on the canvas to place it. Drawings are saved with the chart and, in linked charts, can be shared across the group (via Sync ▸ Drawings).
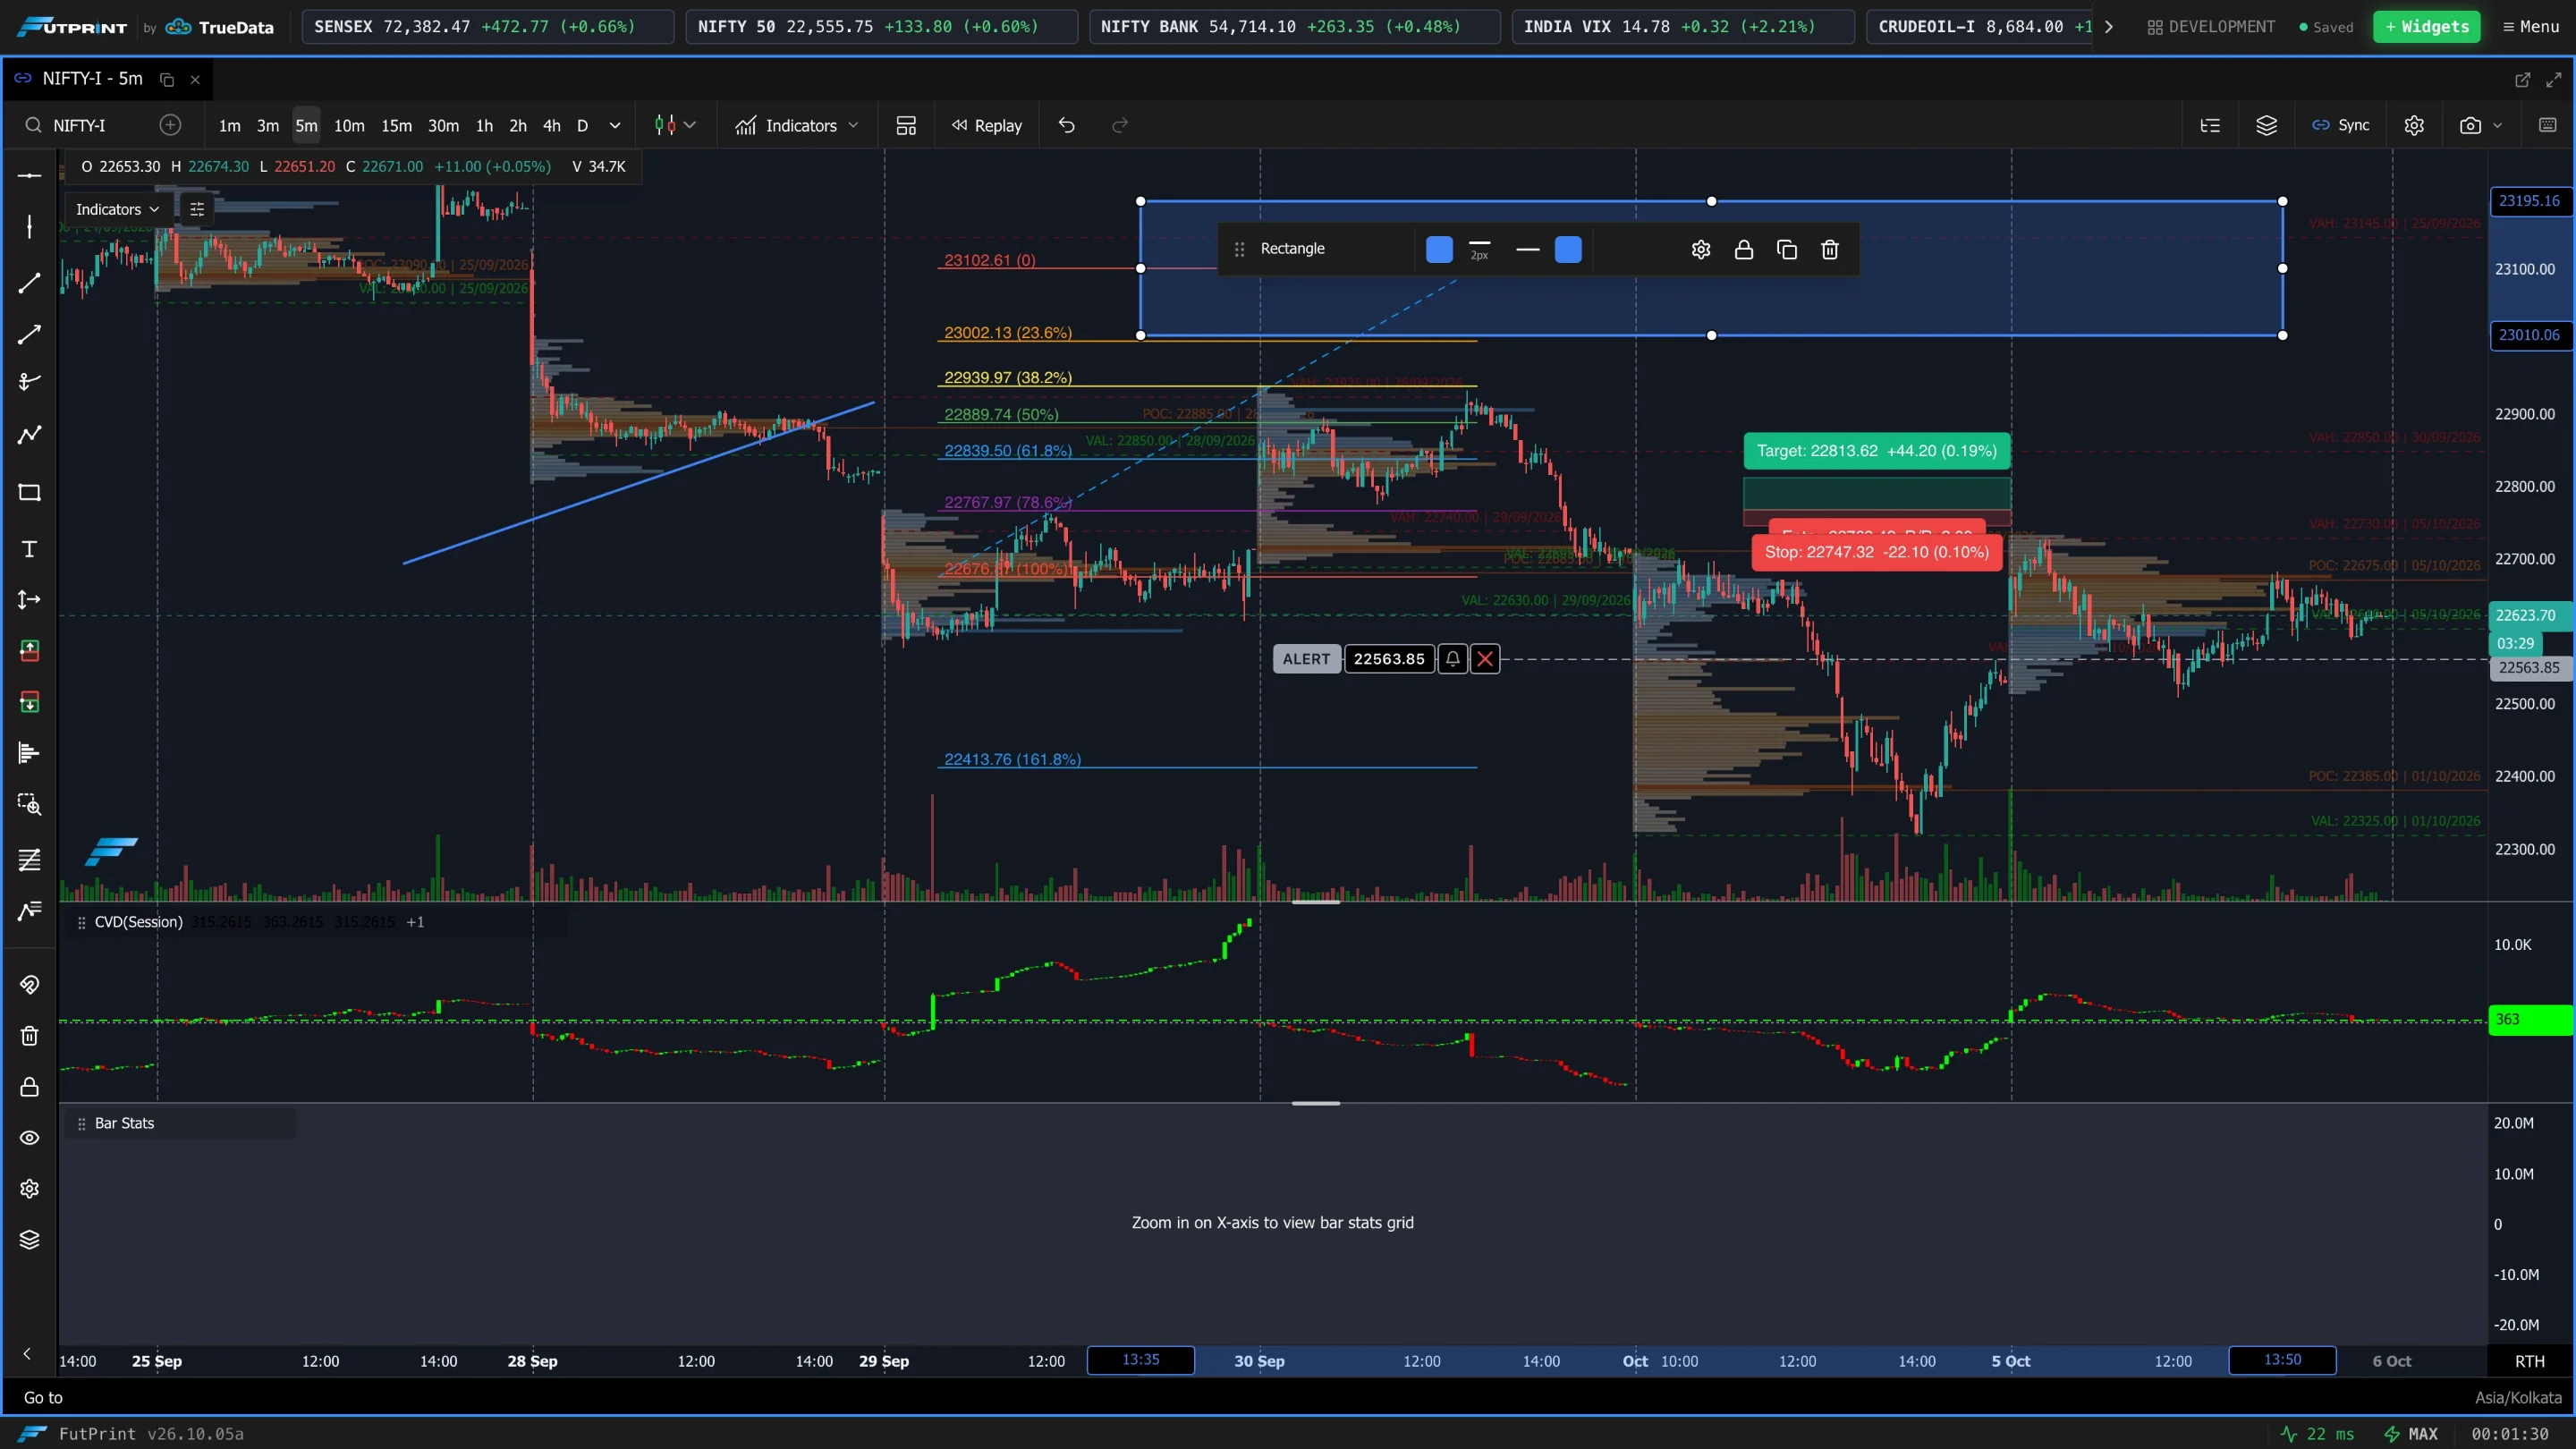
How drawing works
- 1Pick a tool
Click its icon on the drawing rail. The pointer switches to drawing mode.
- 2Place it
Click (and for two-point tools, click again, or drag) to set the anchor points on the chart.
- 3Select & edit
Click an existing drawing to select it. Drag its handles to reshape, drag the body to move it, and use the settings/toolbar to change colour, line style and width.
- 4Delete
Select and delete it (or use the right-click menu). You can remove drawings one at a time or clear them.
The drawing toolbar
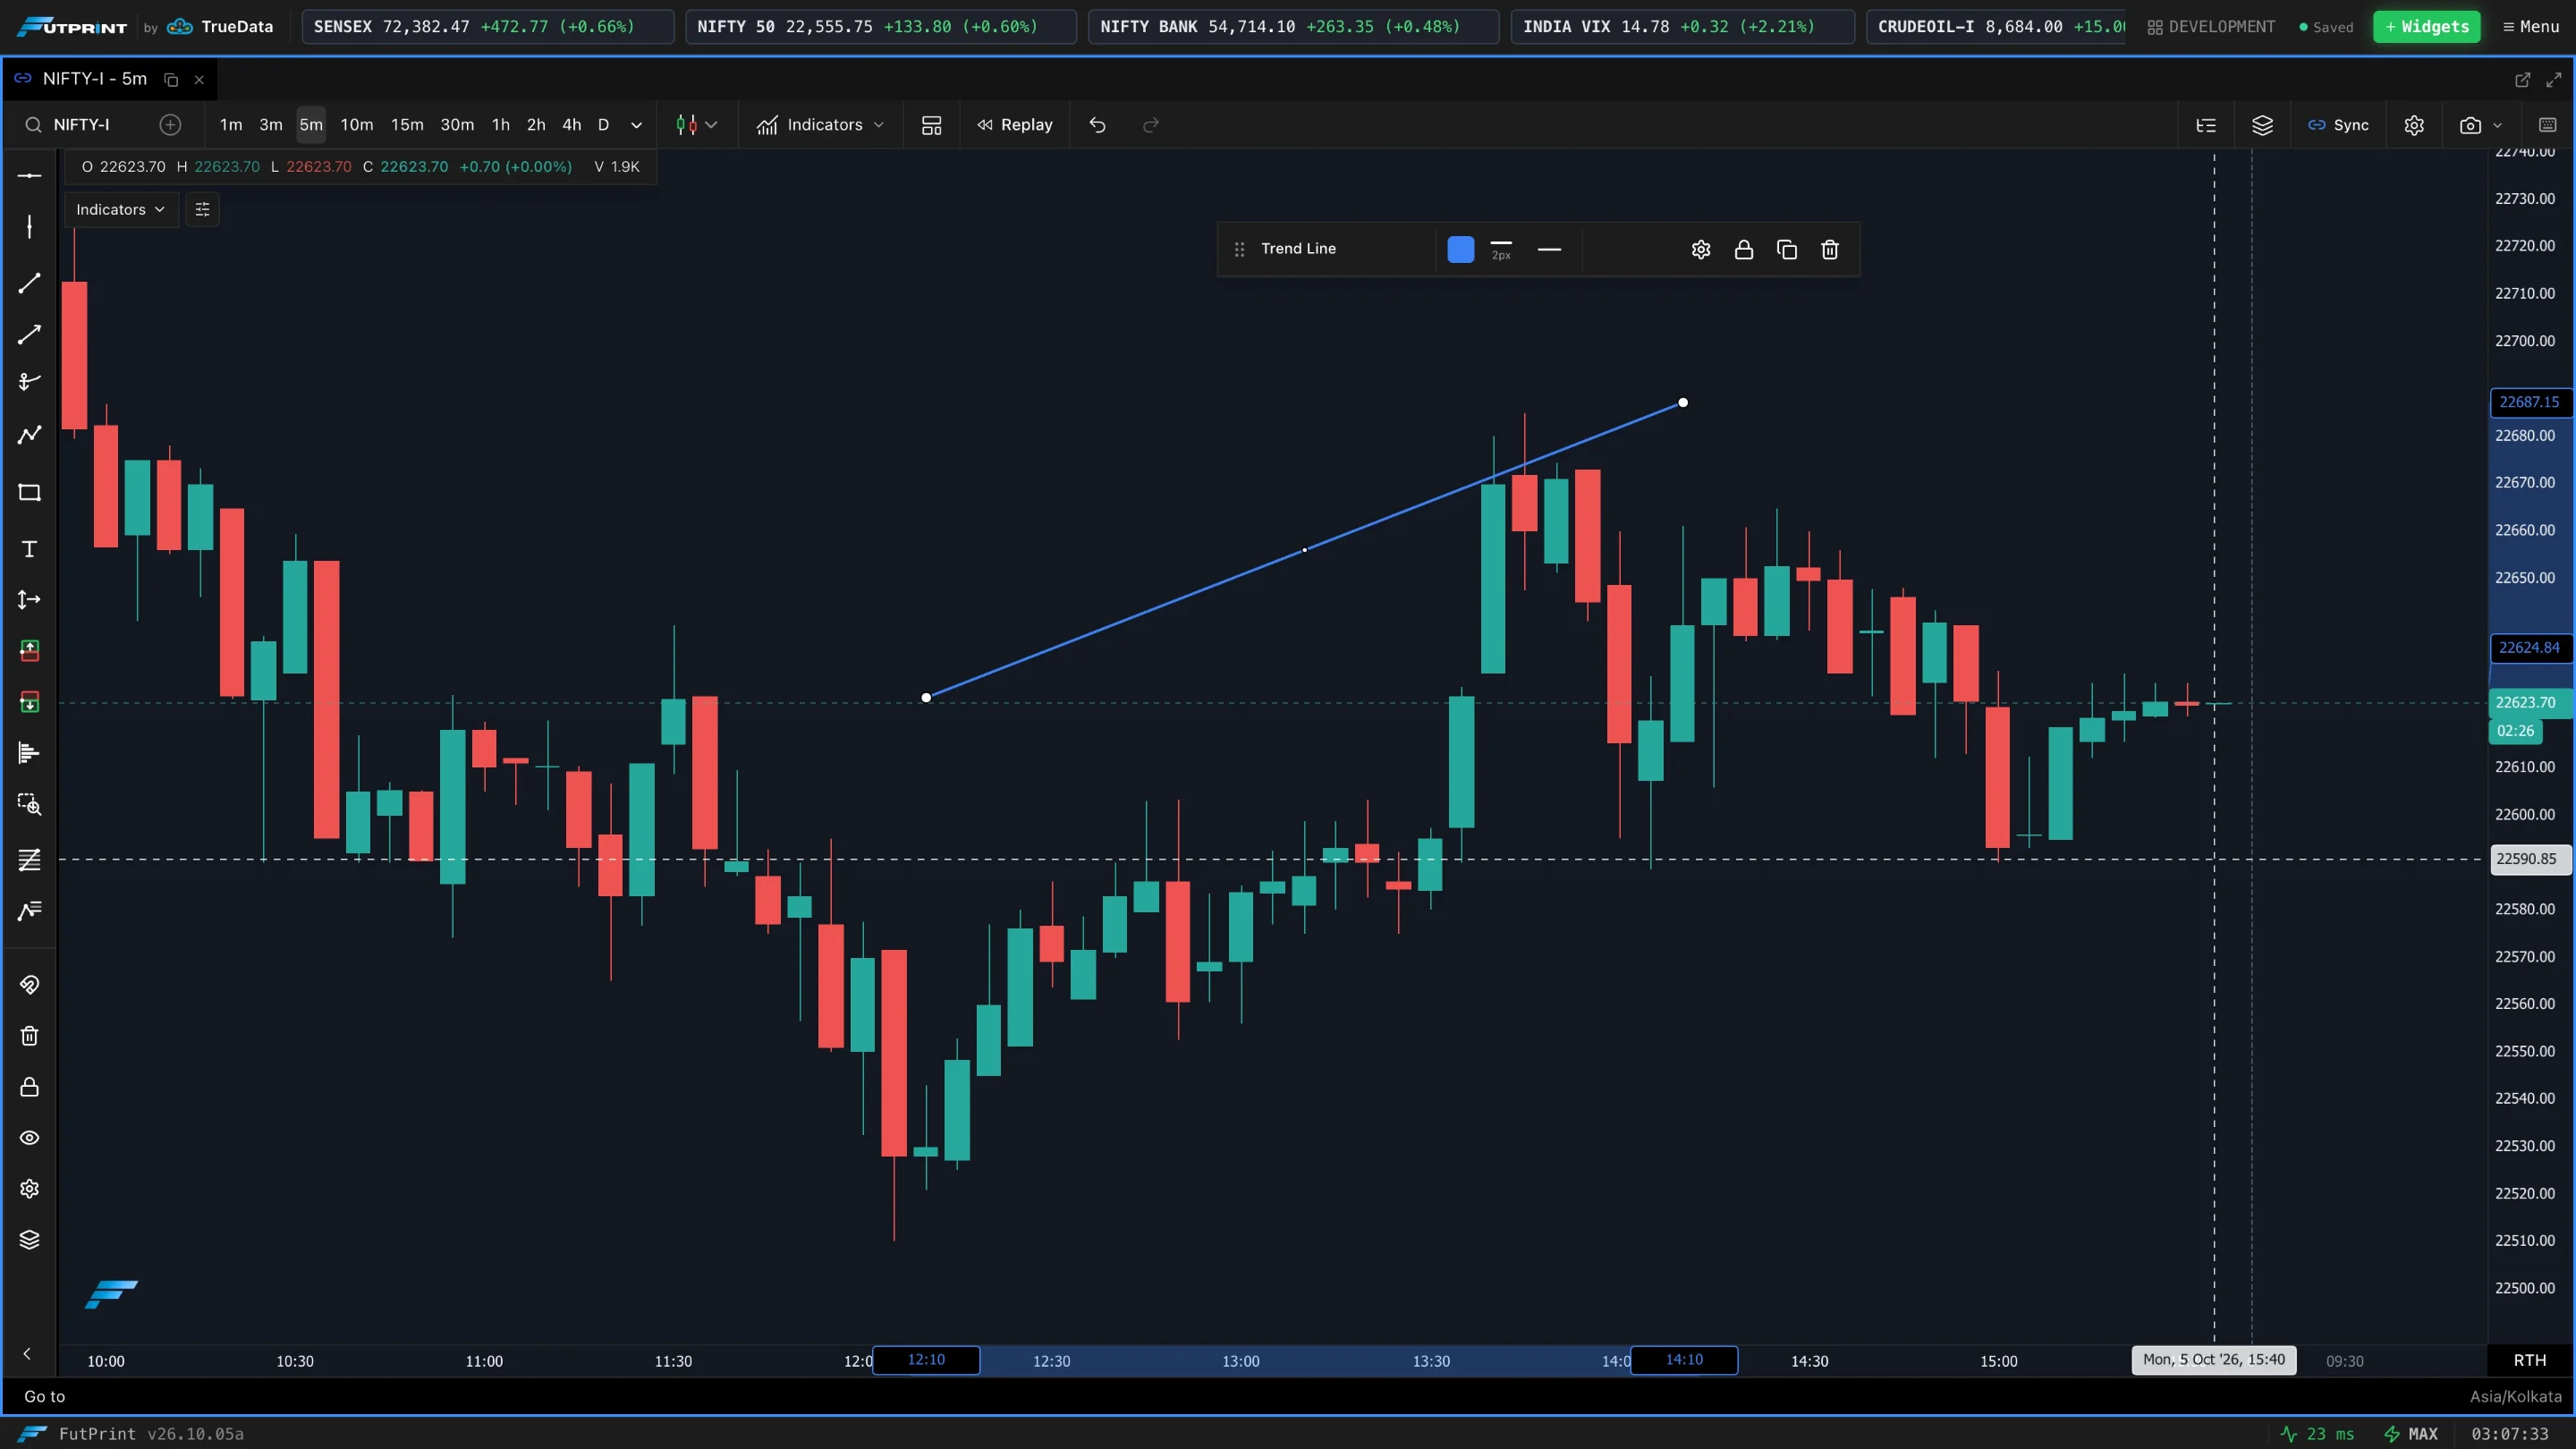
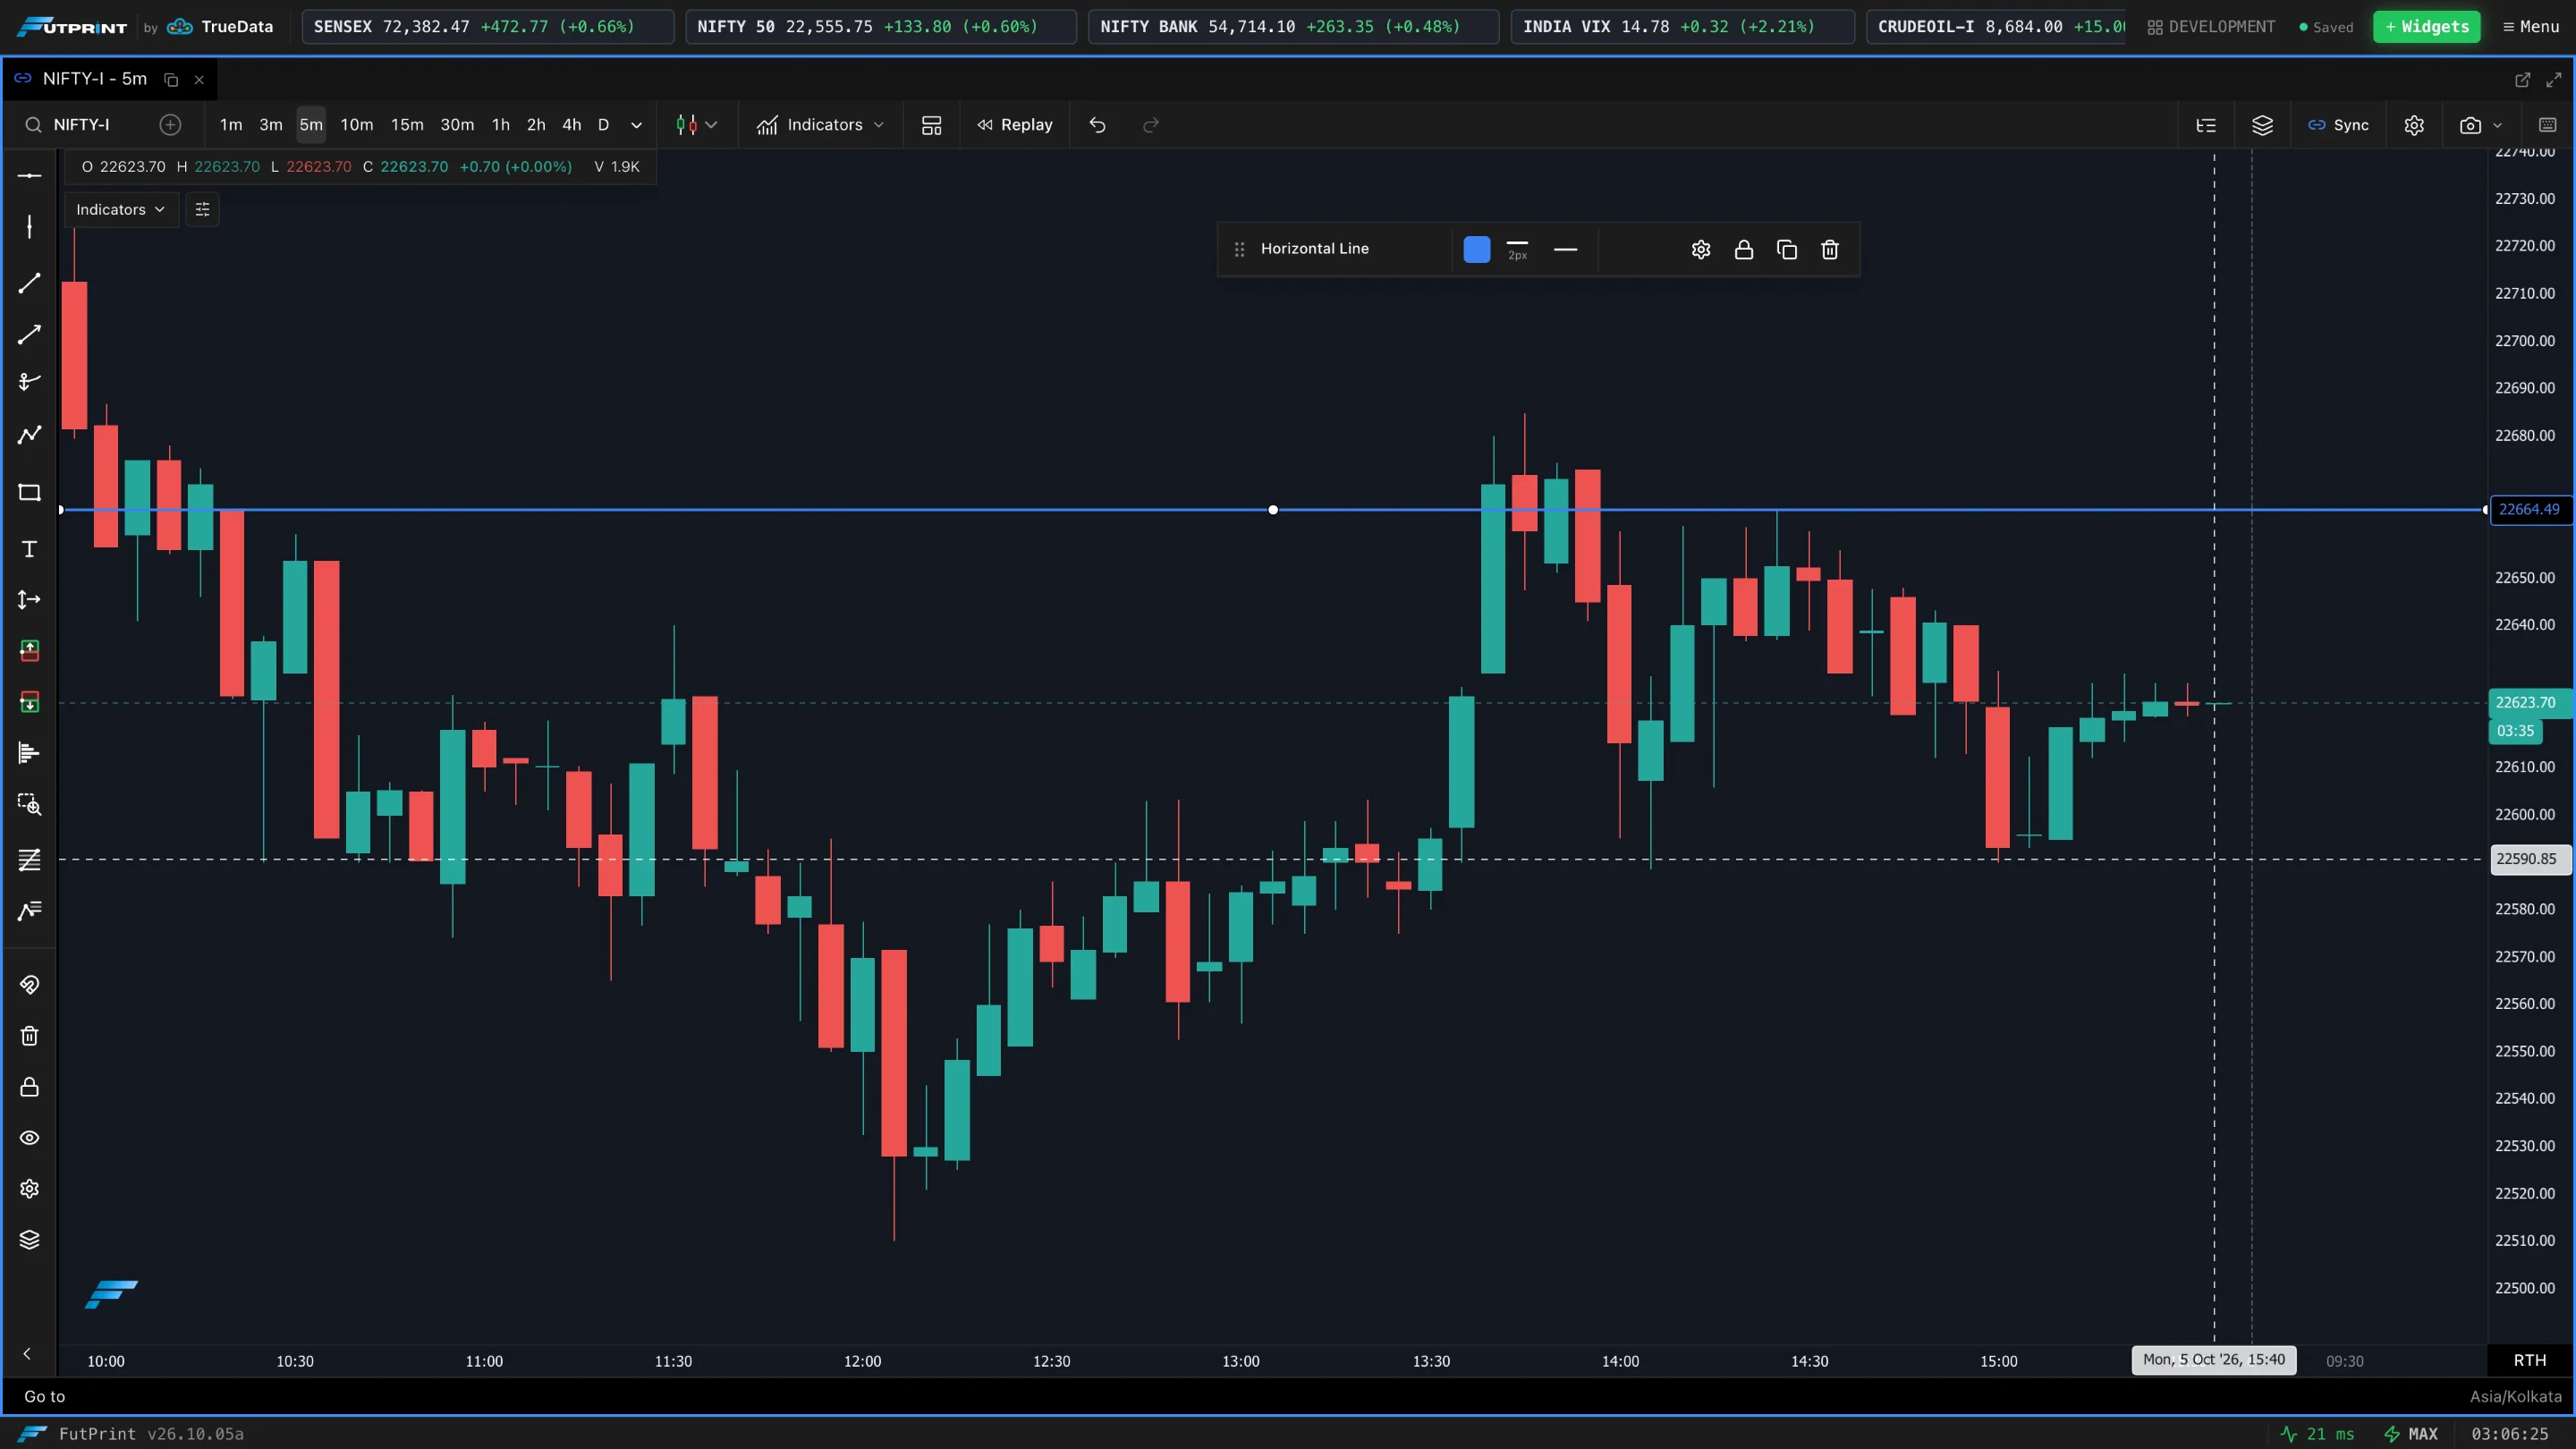
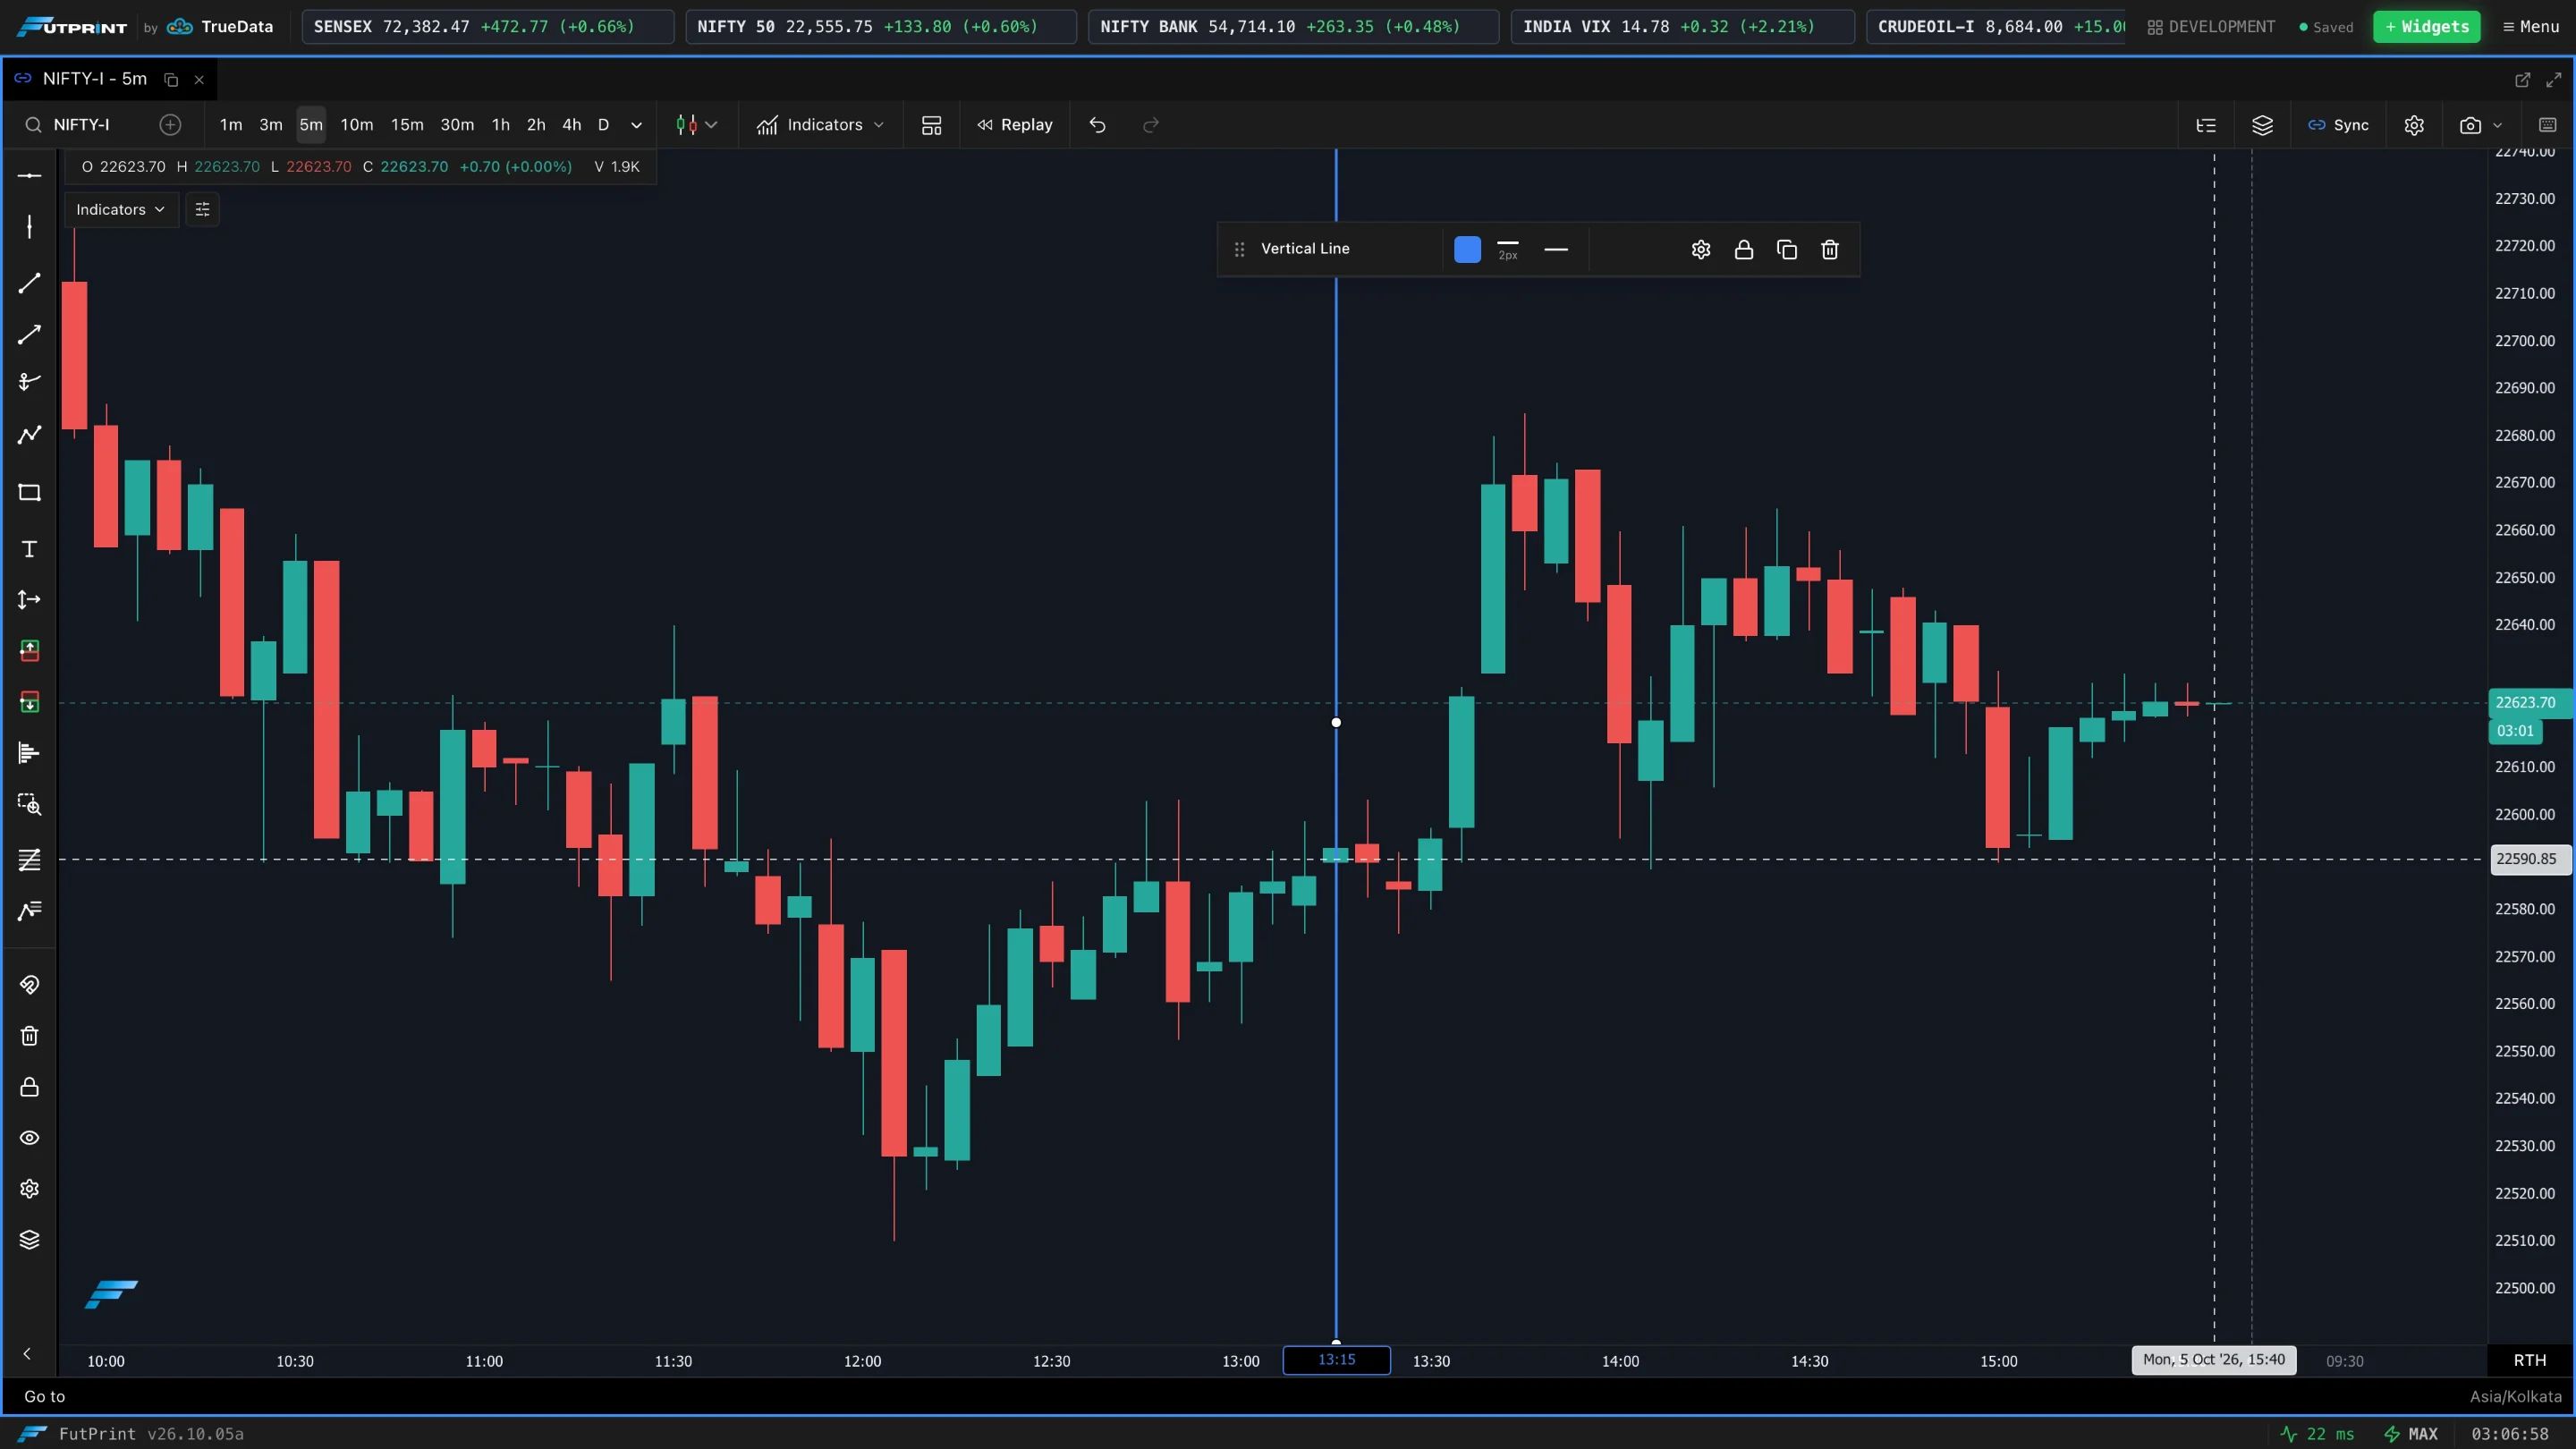
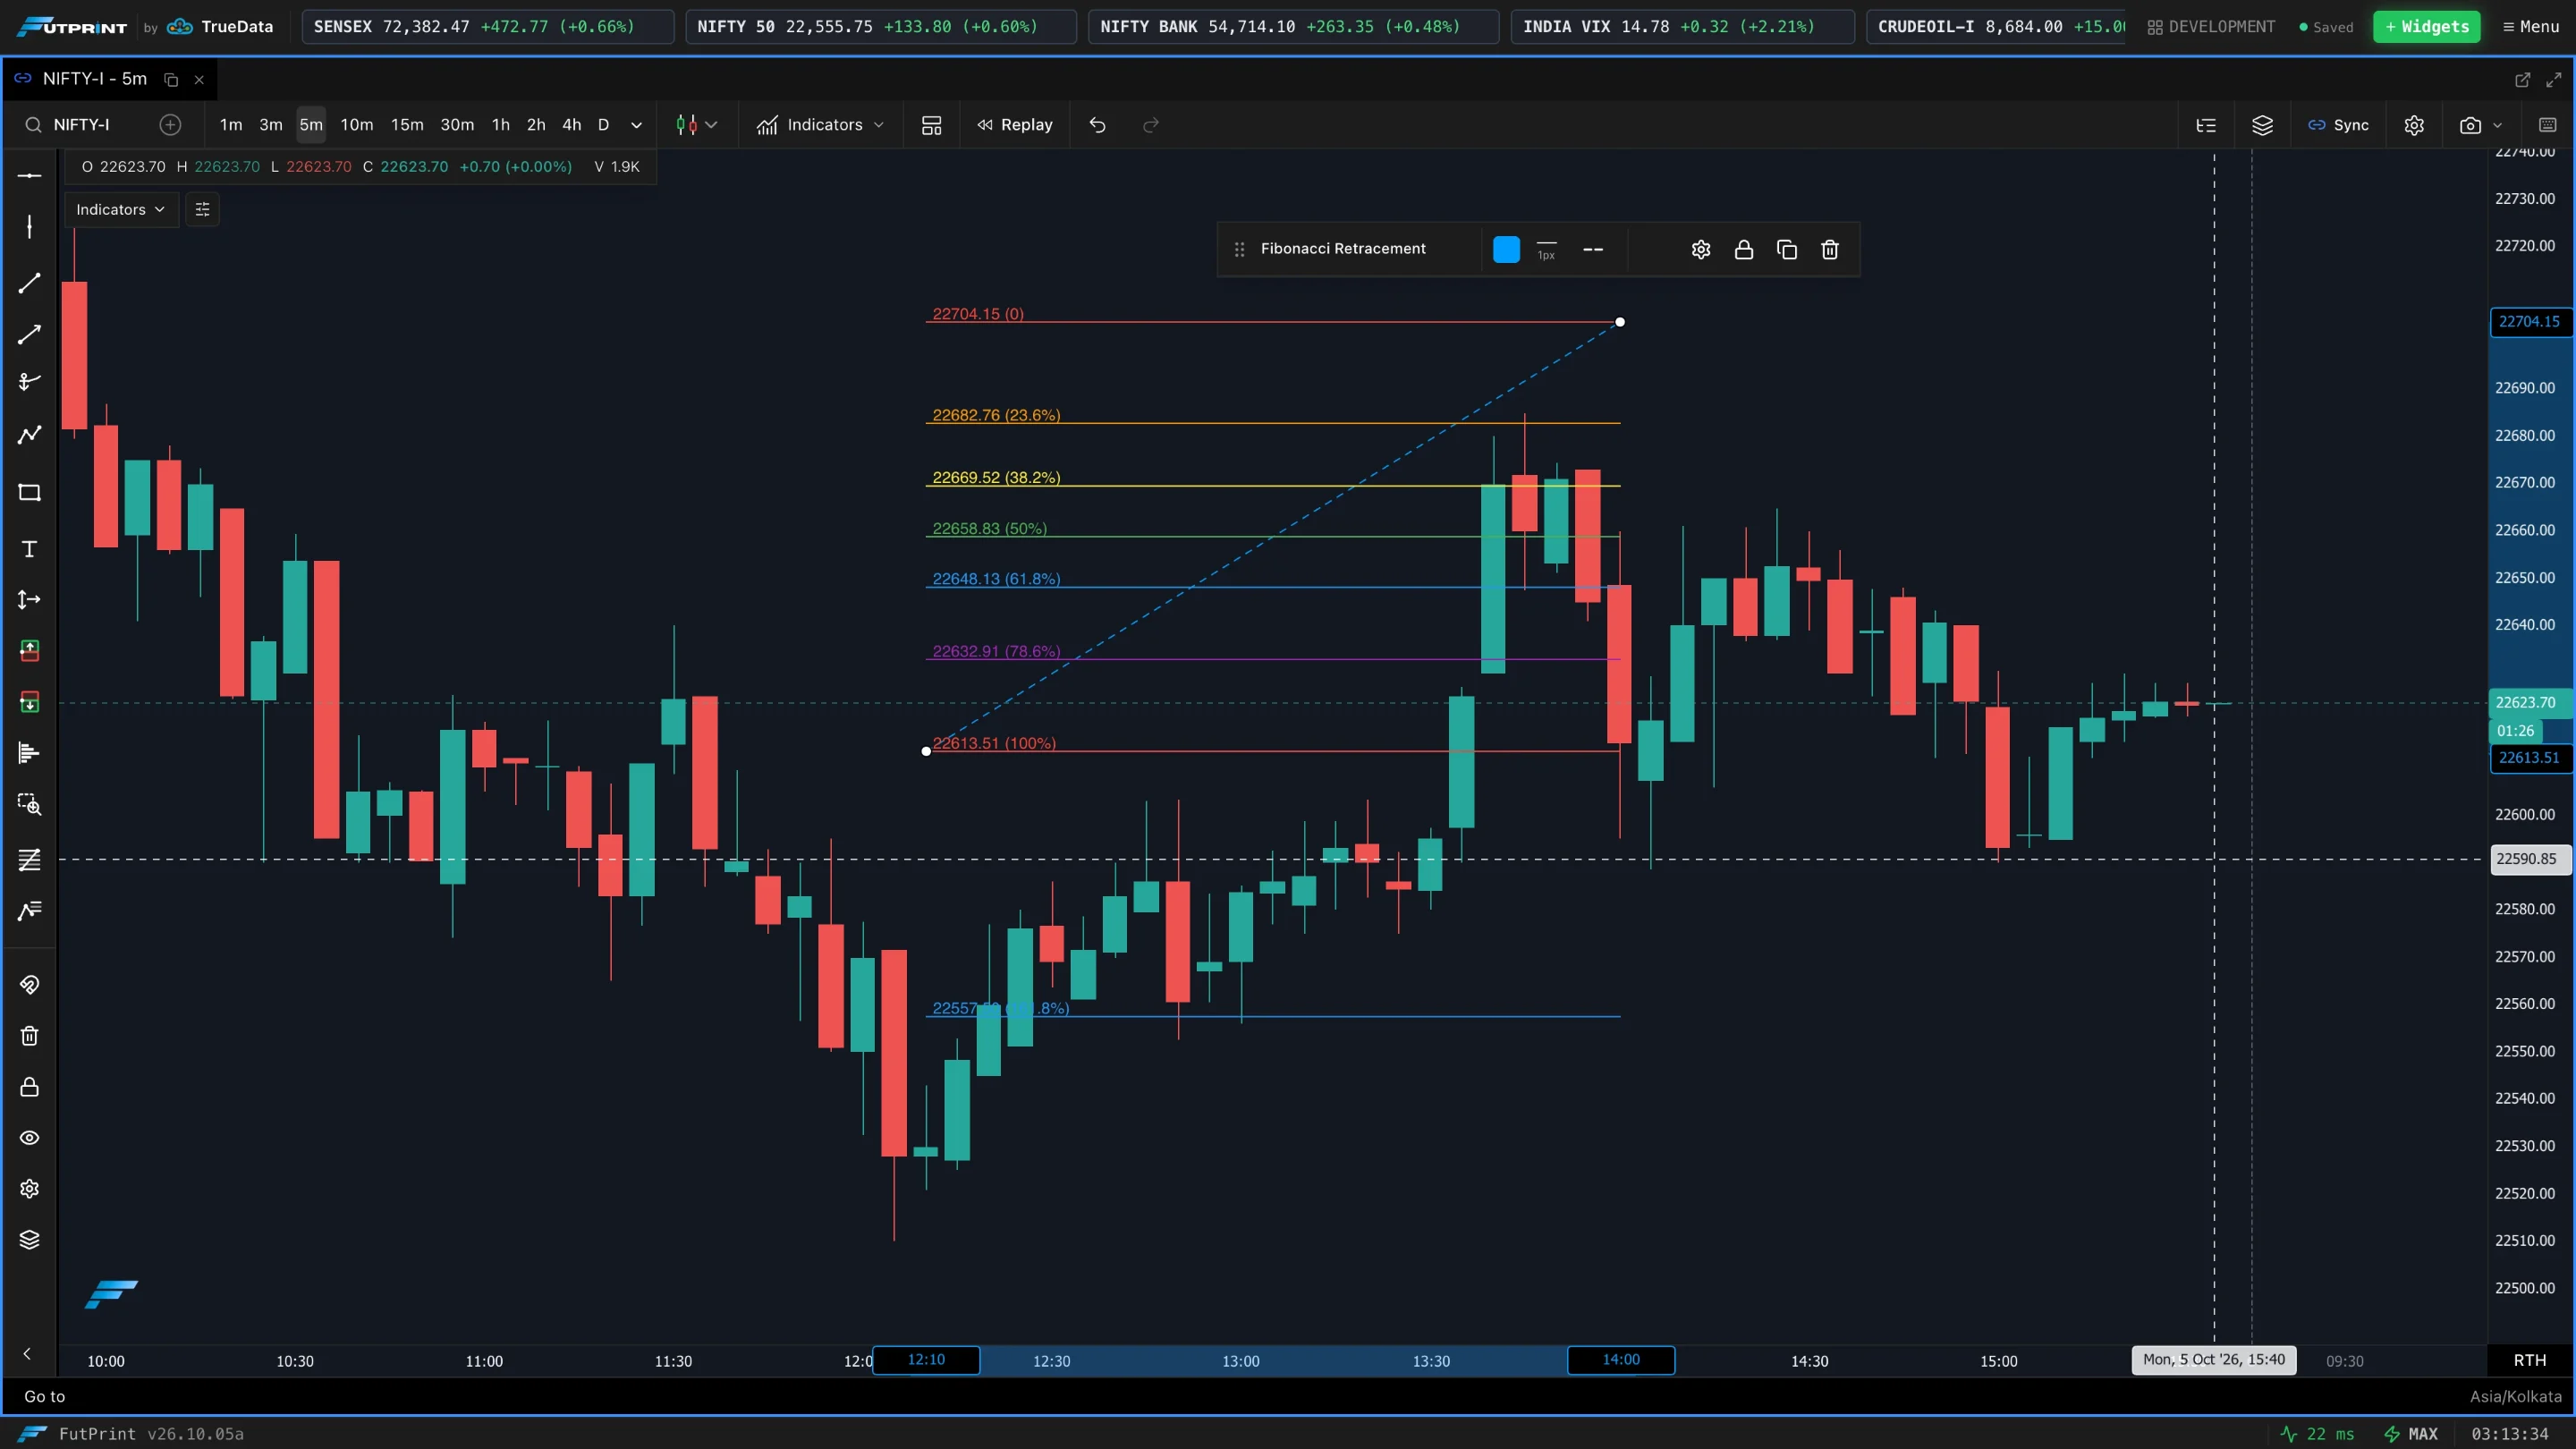
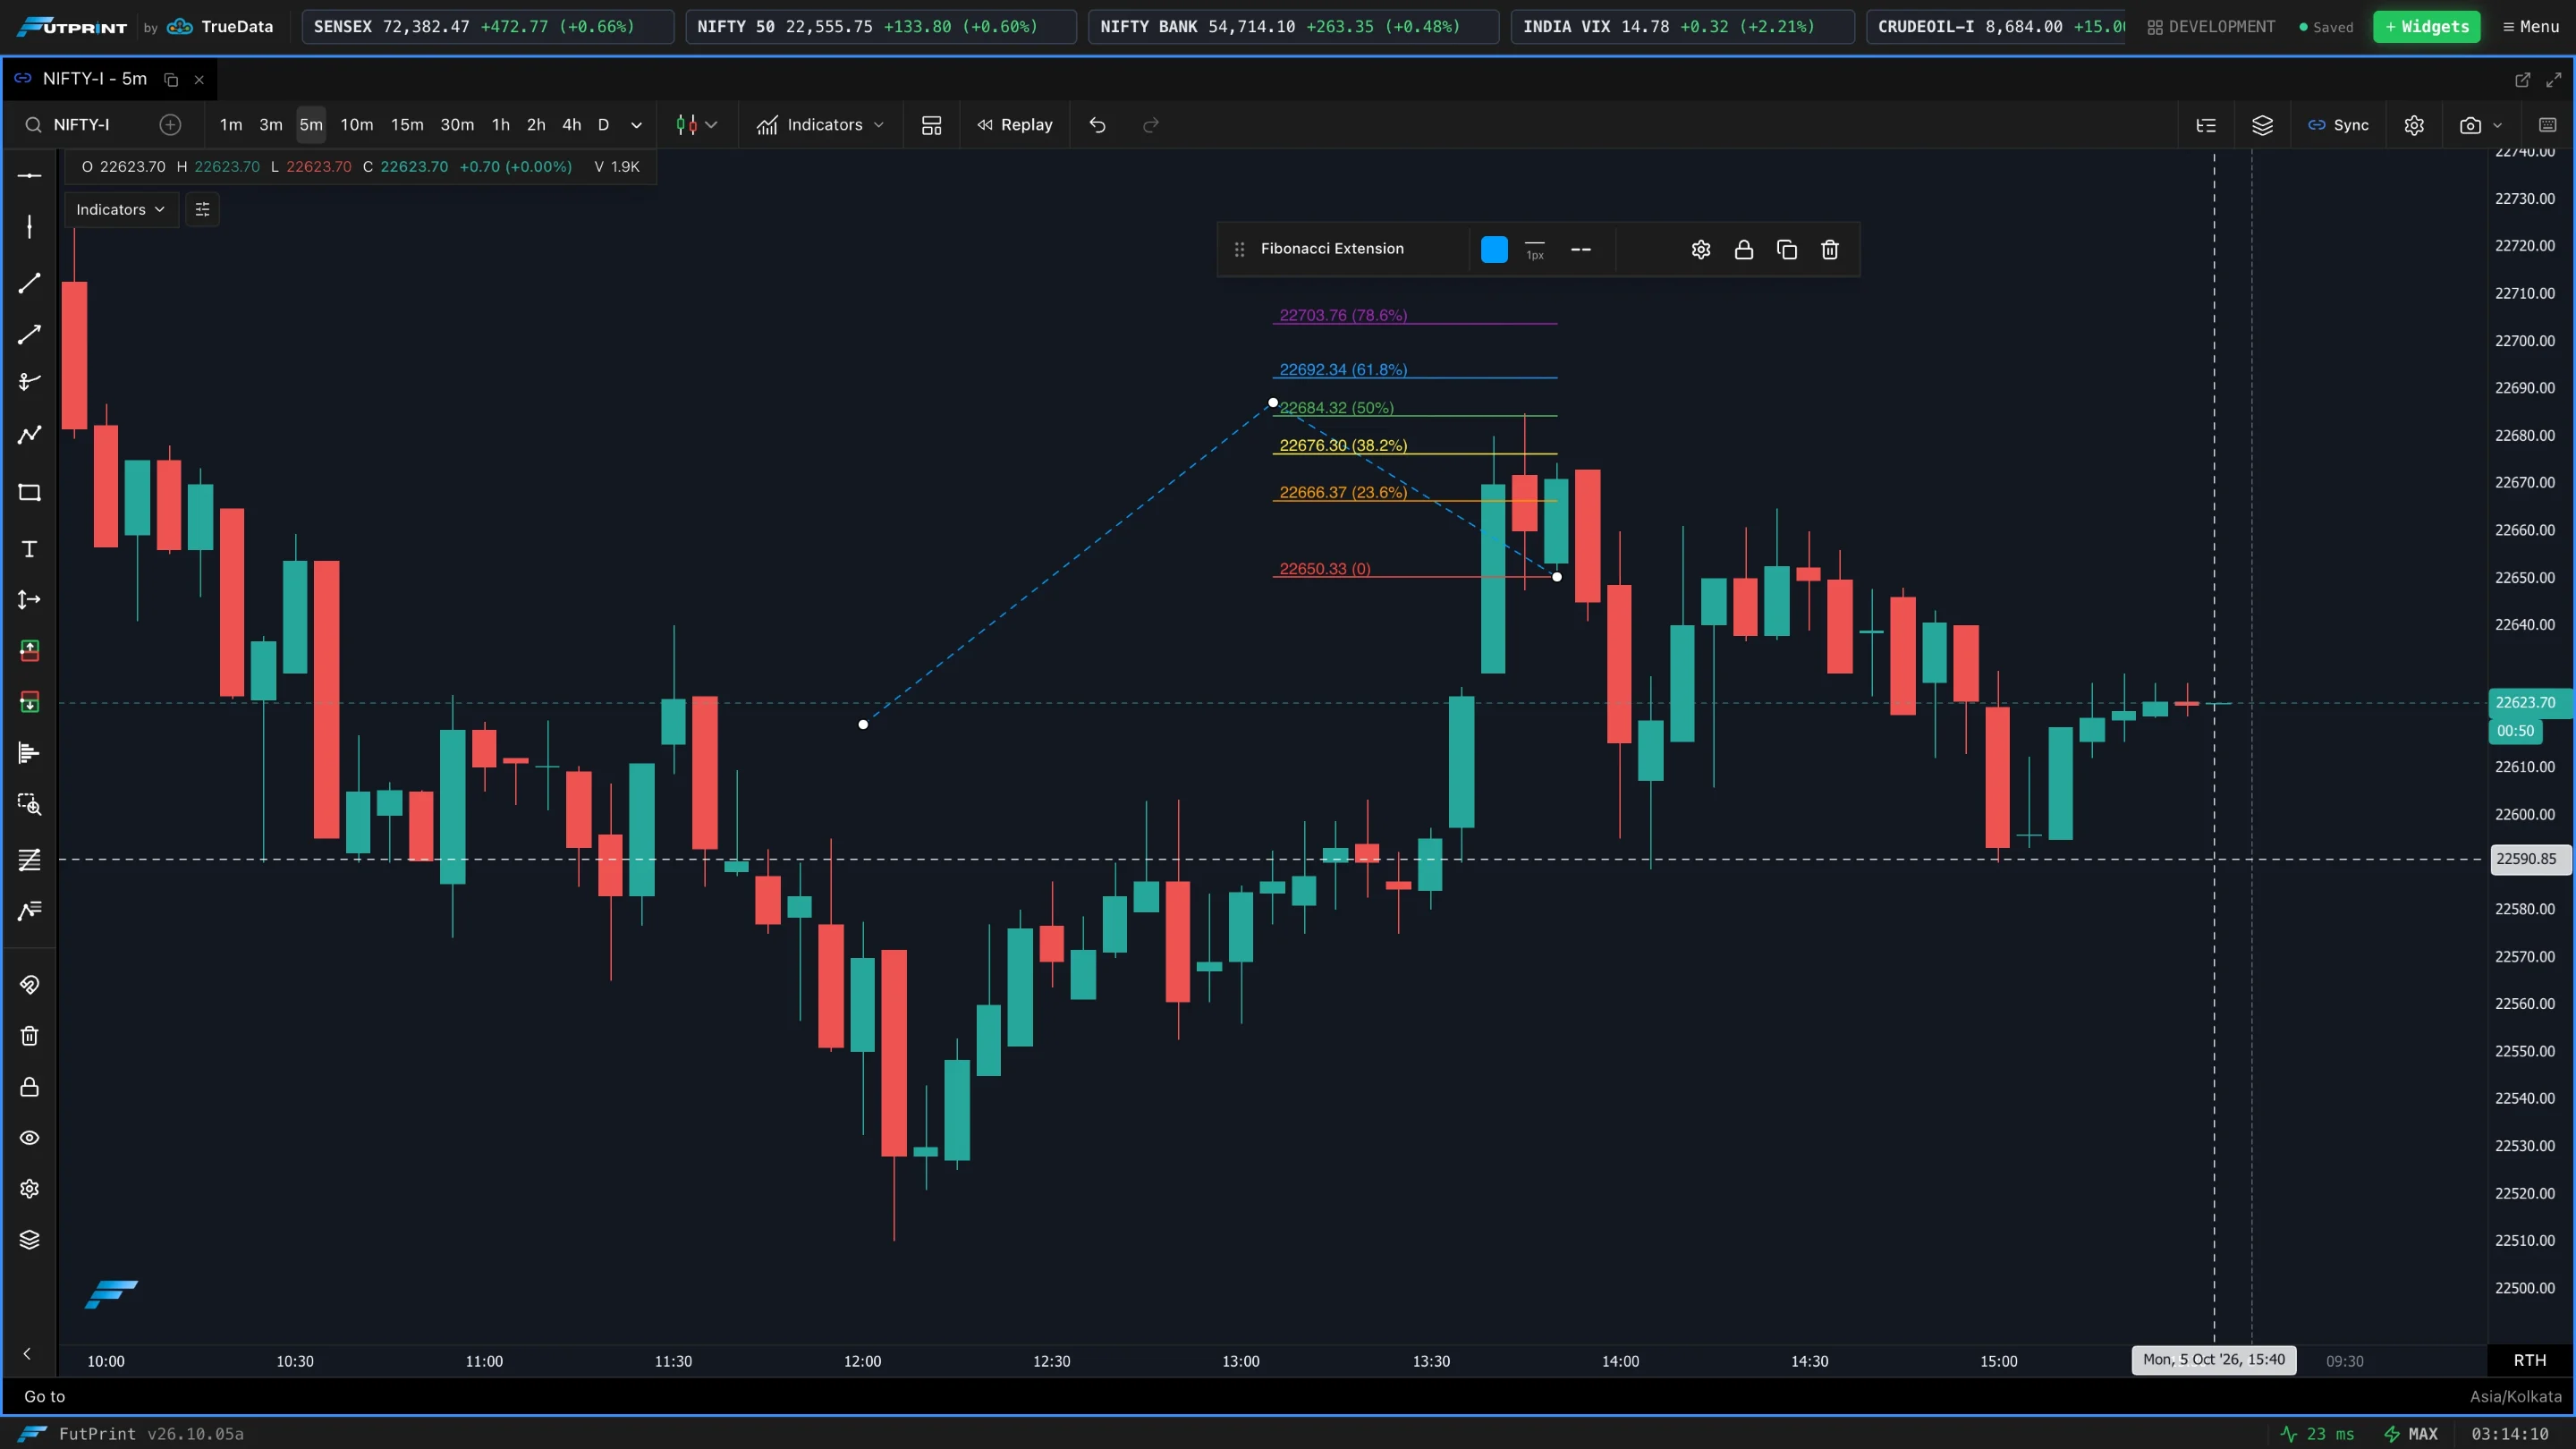
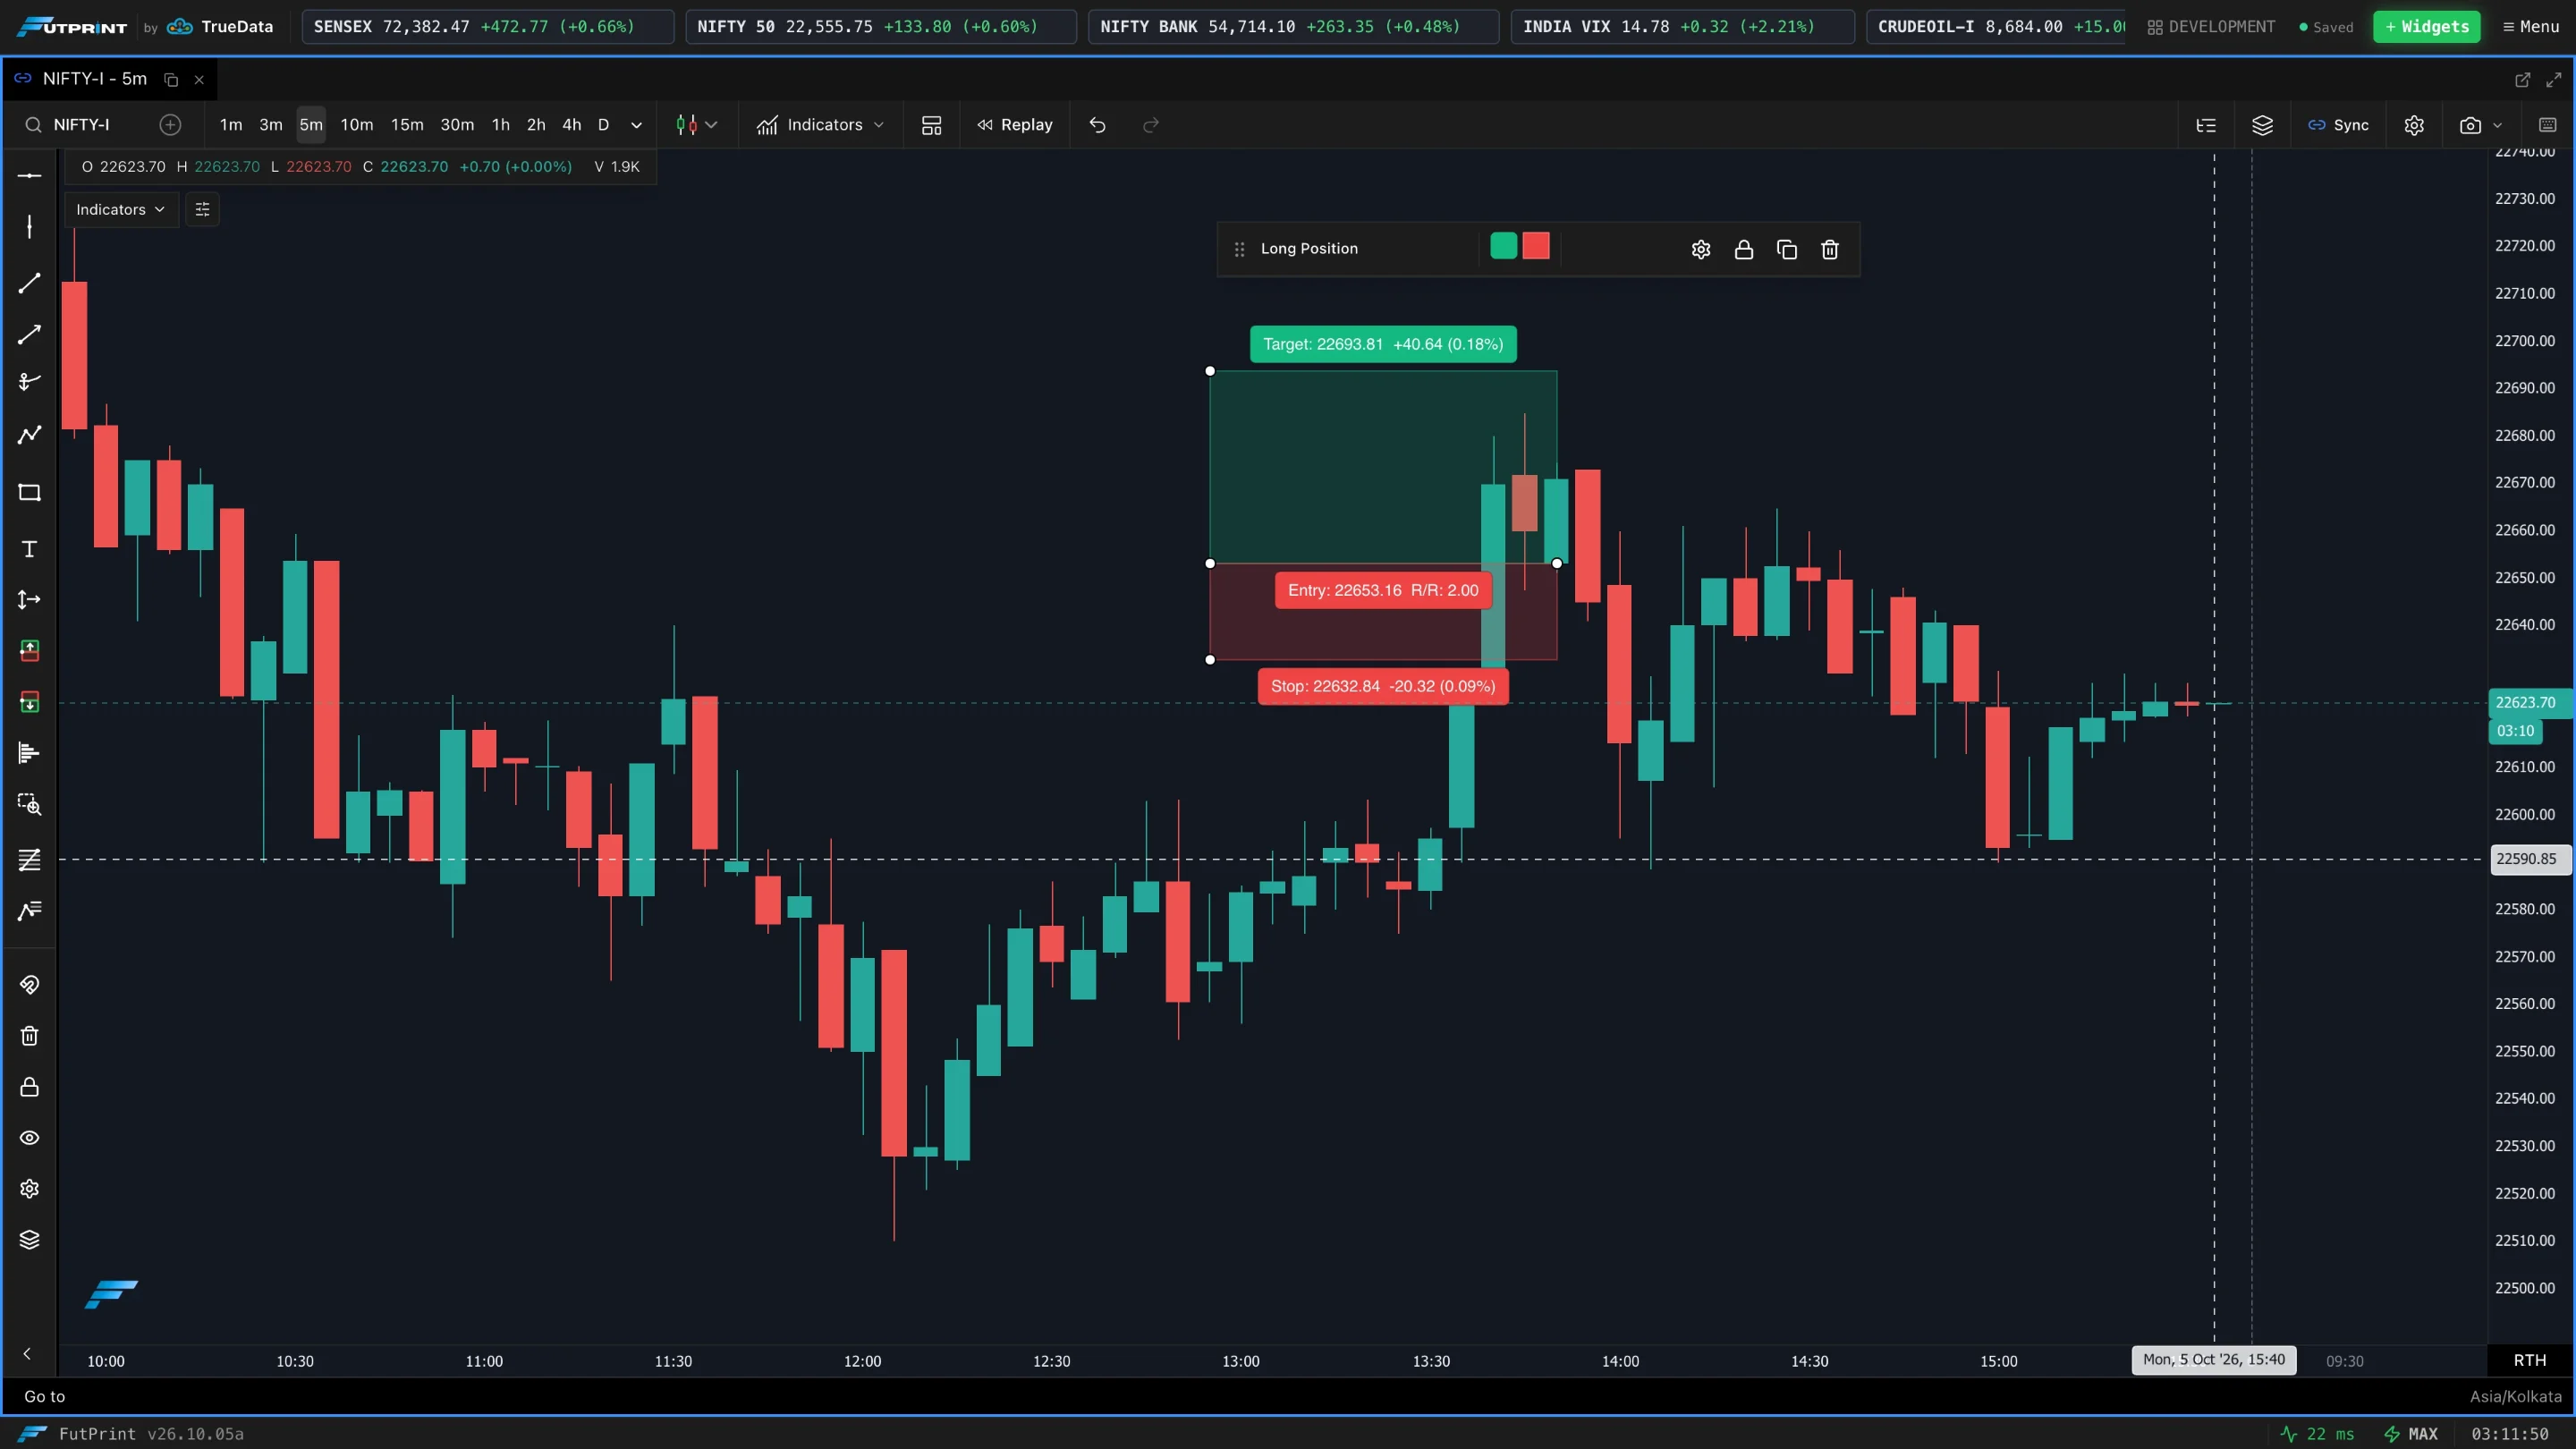
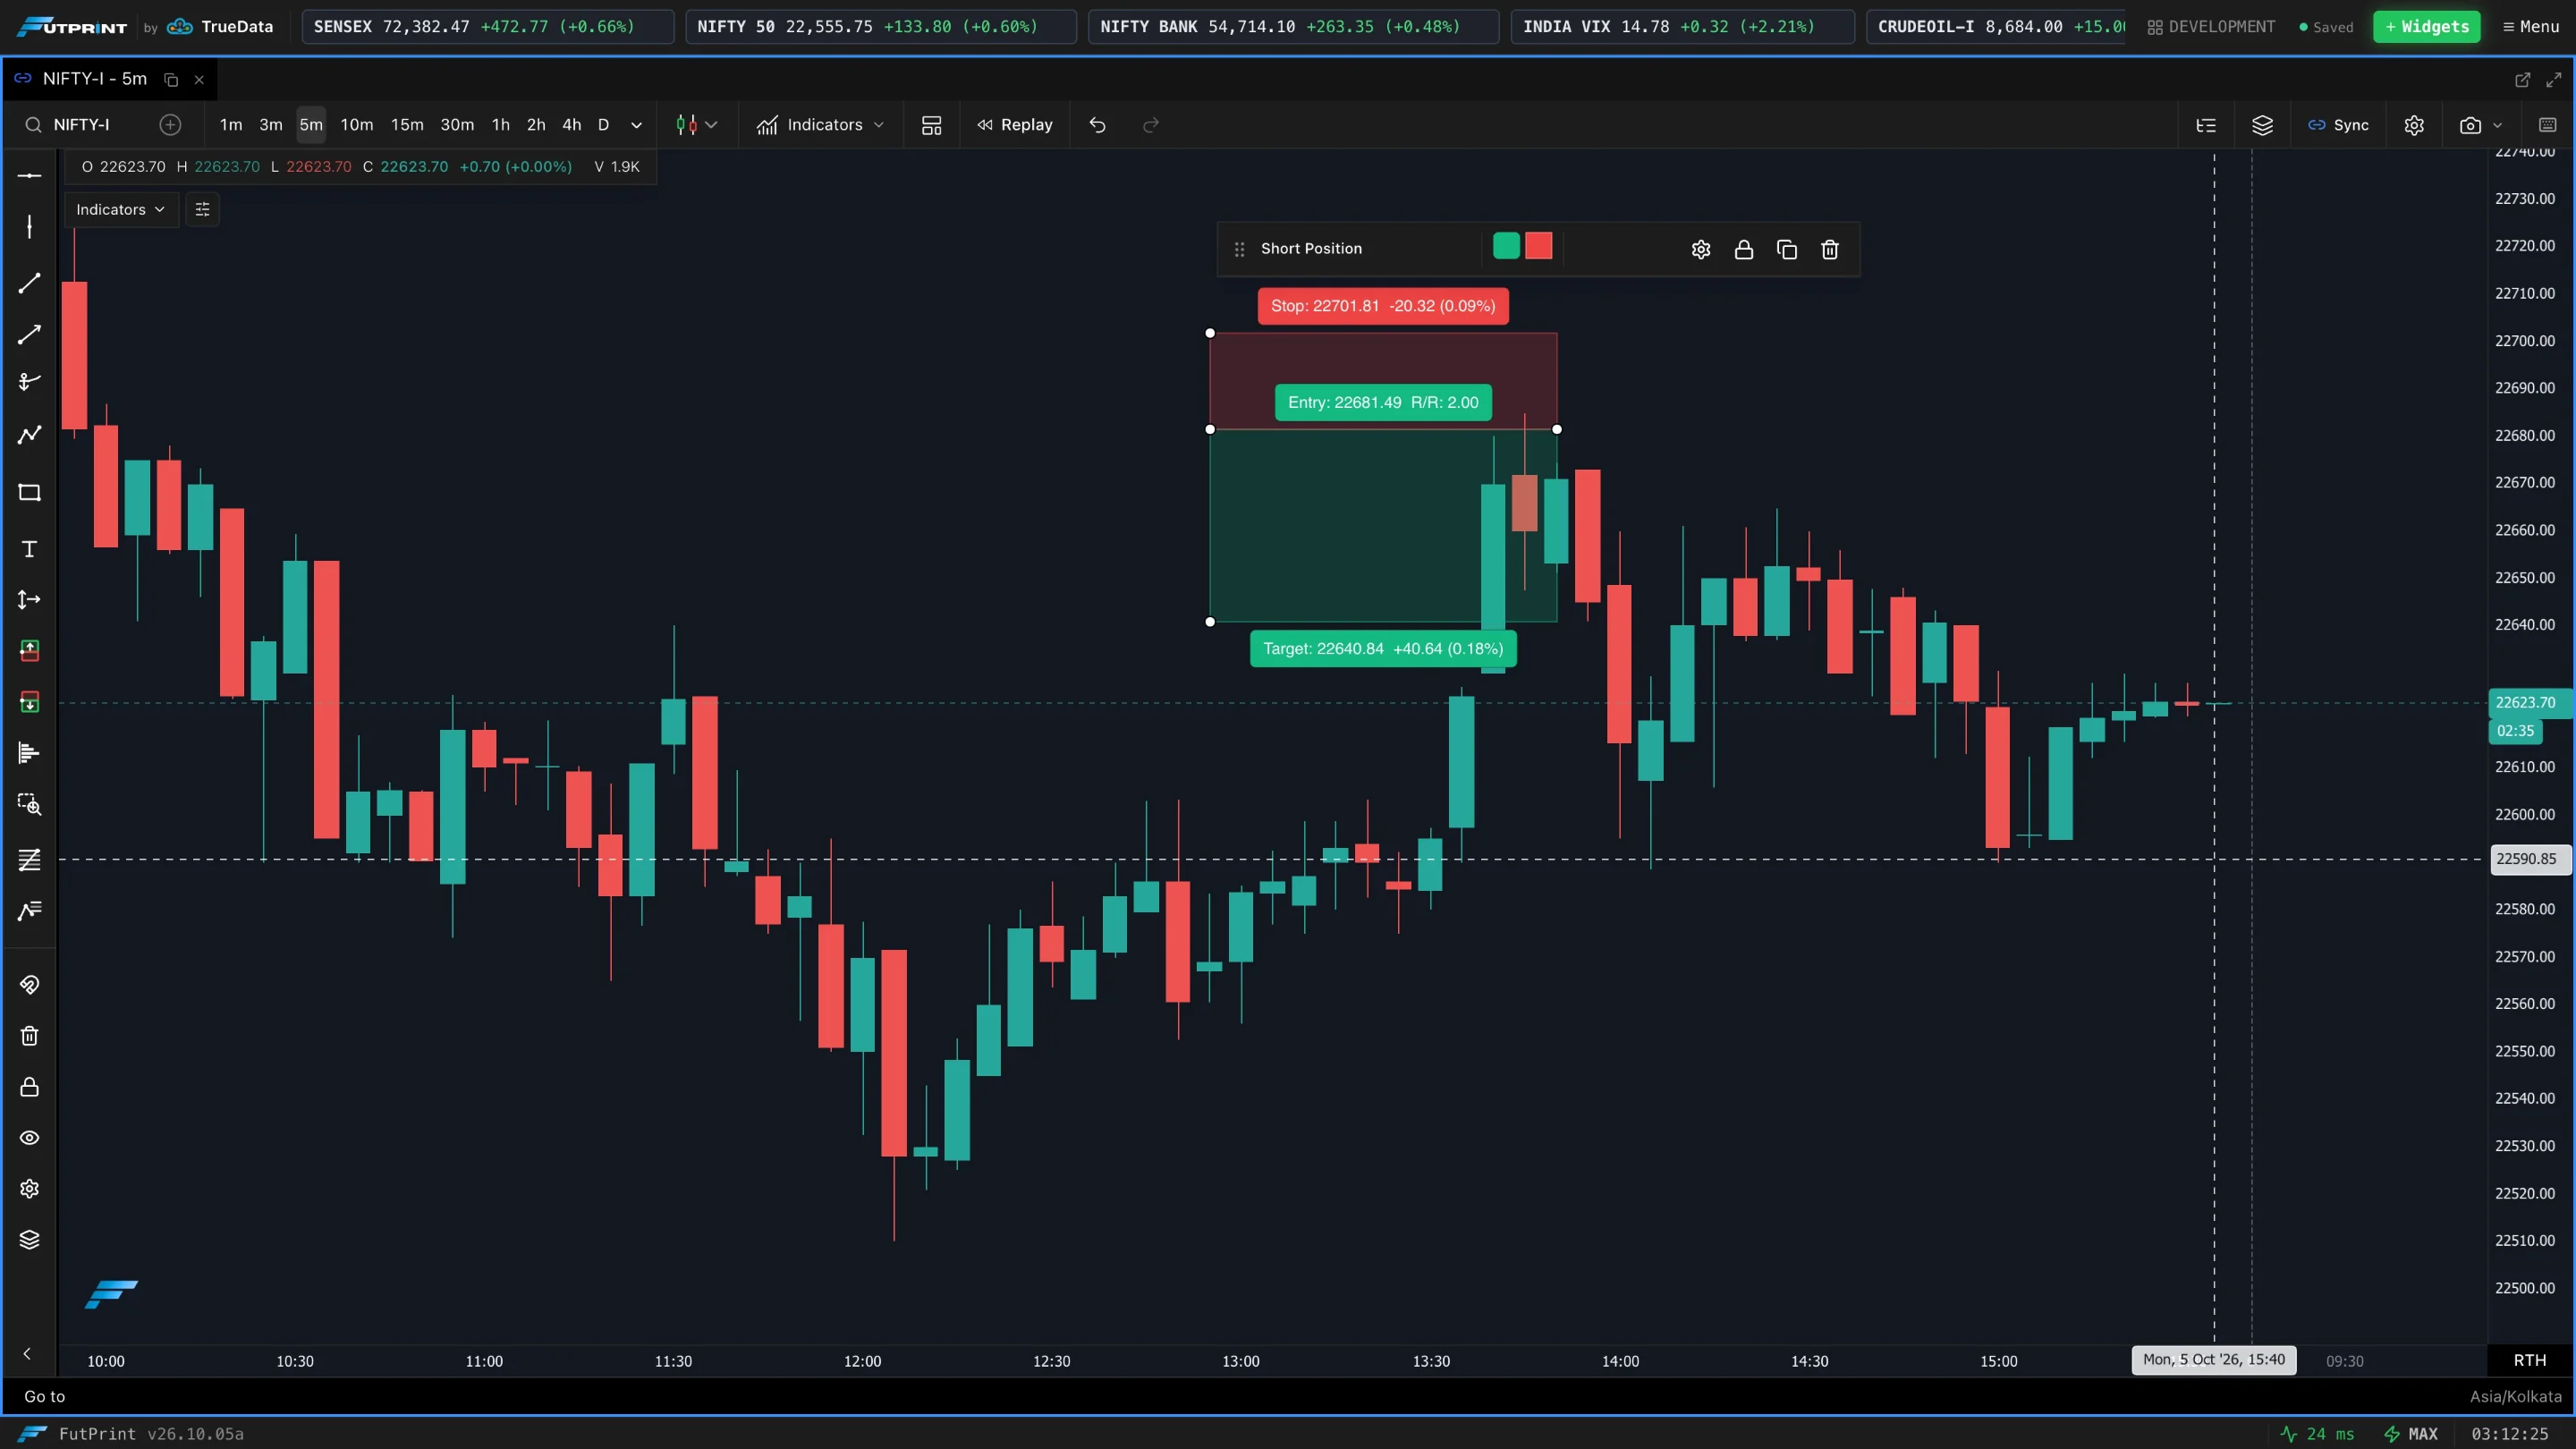
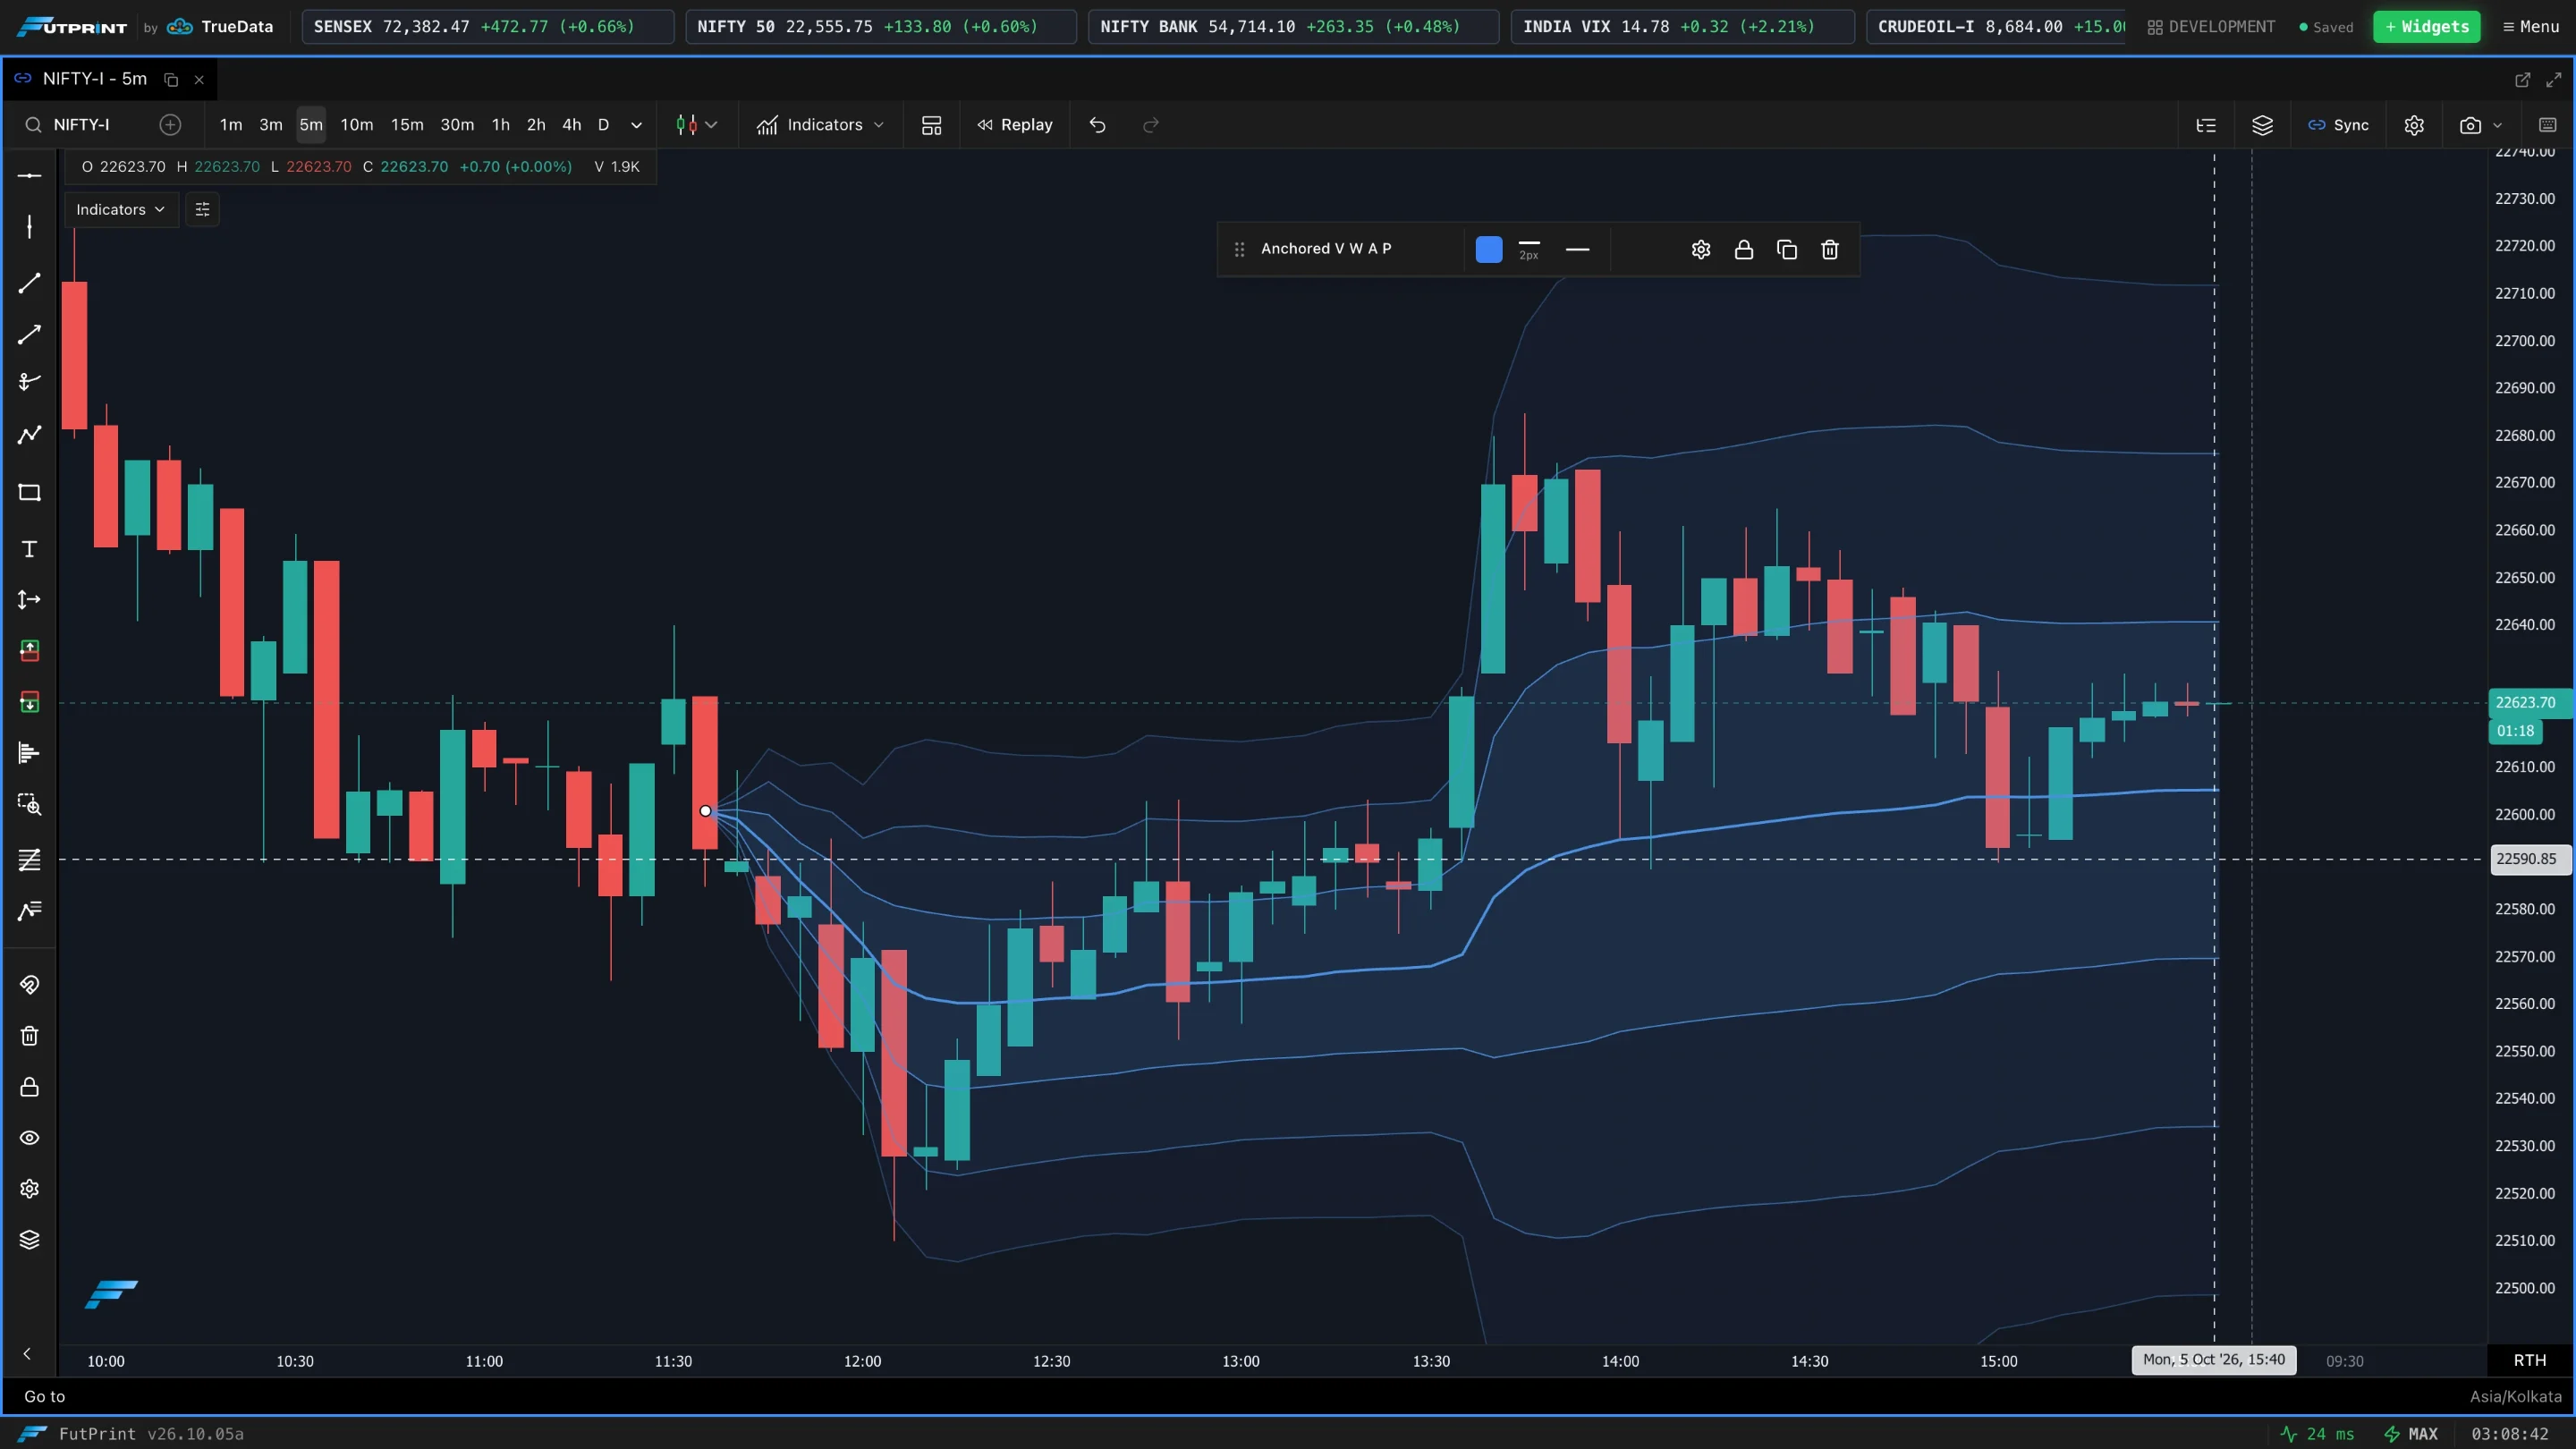
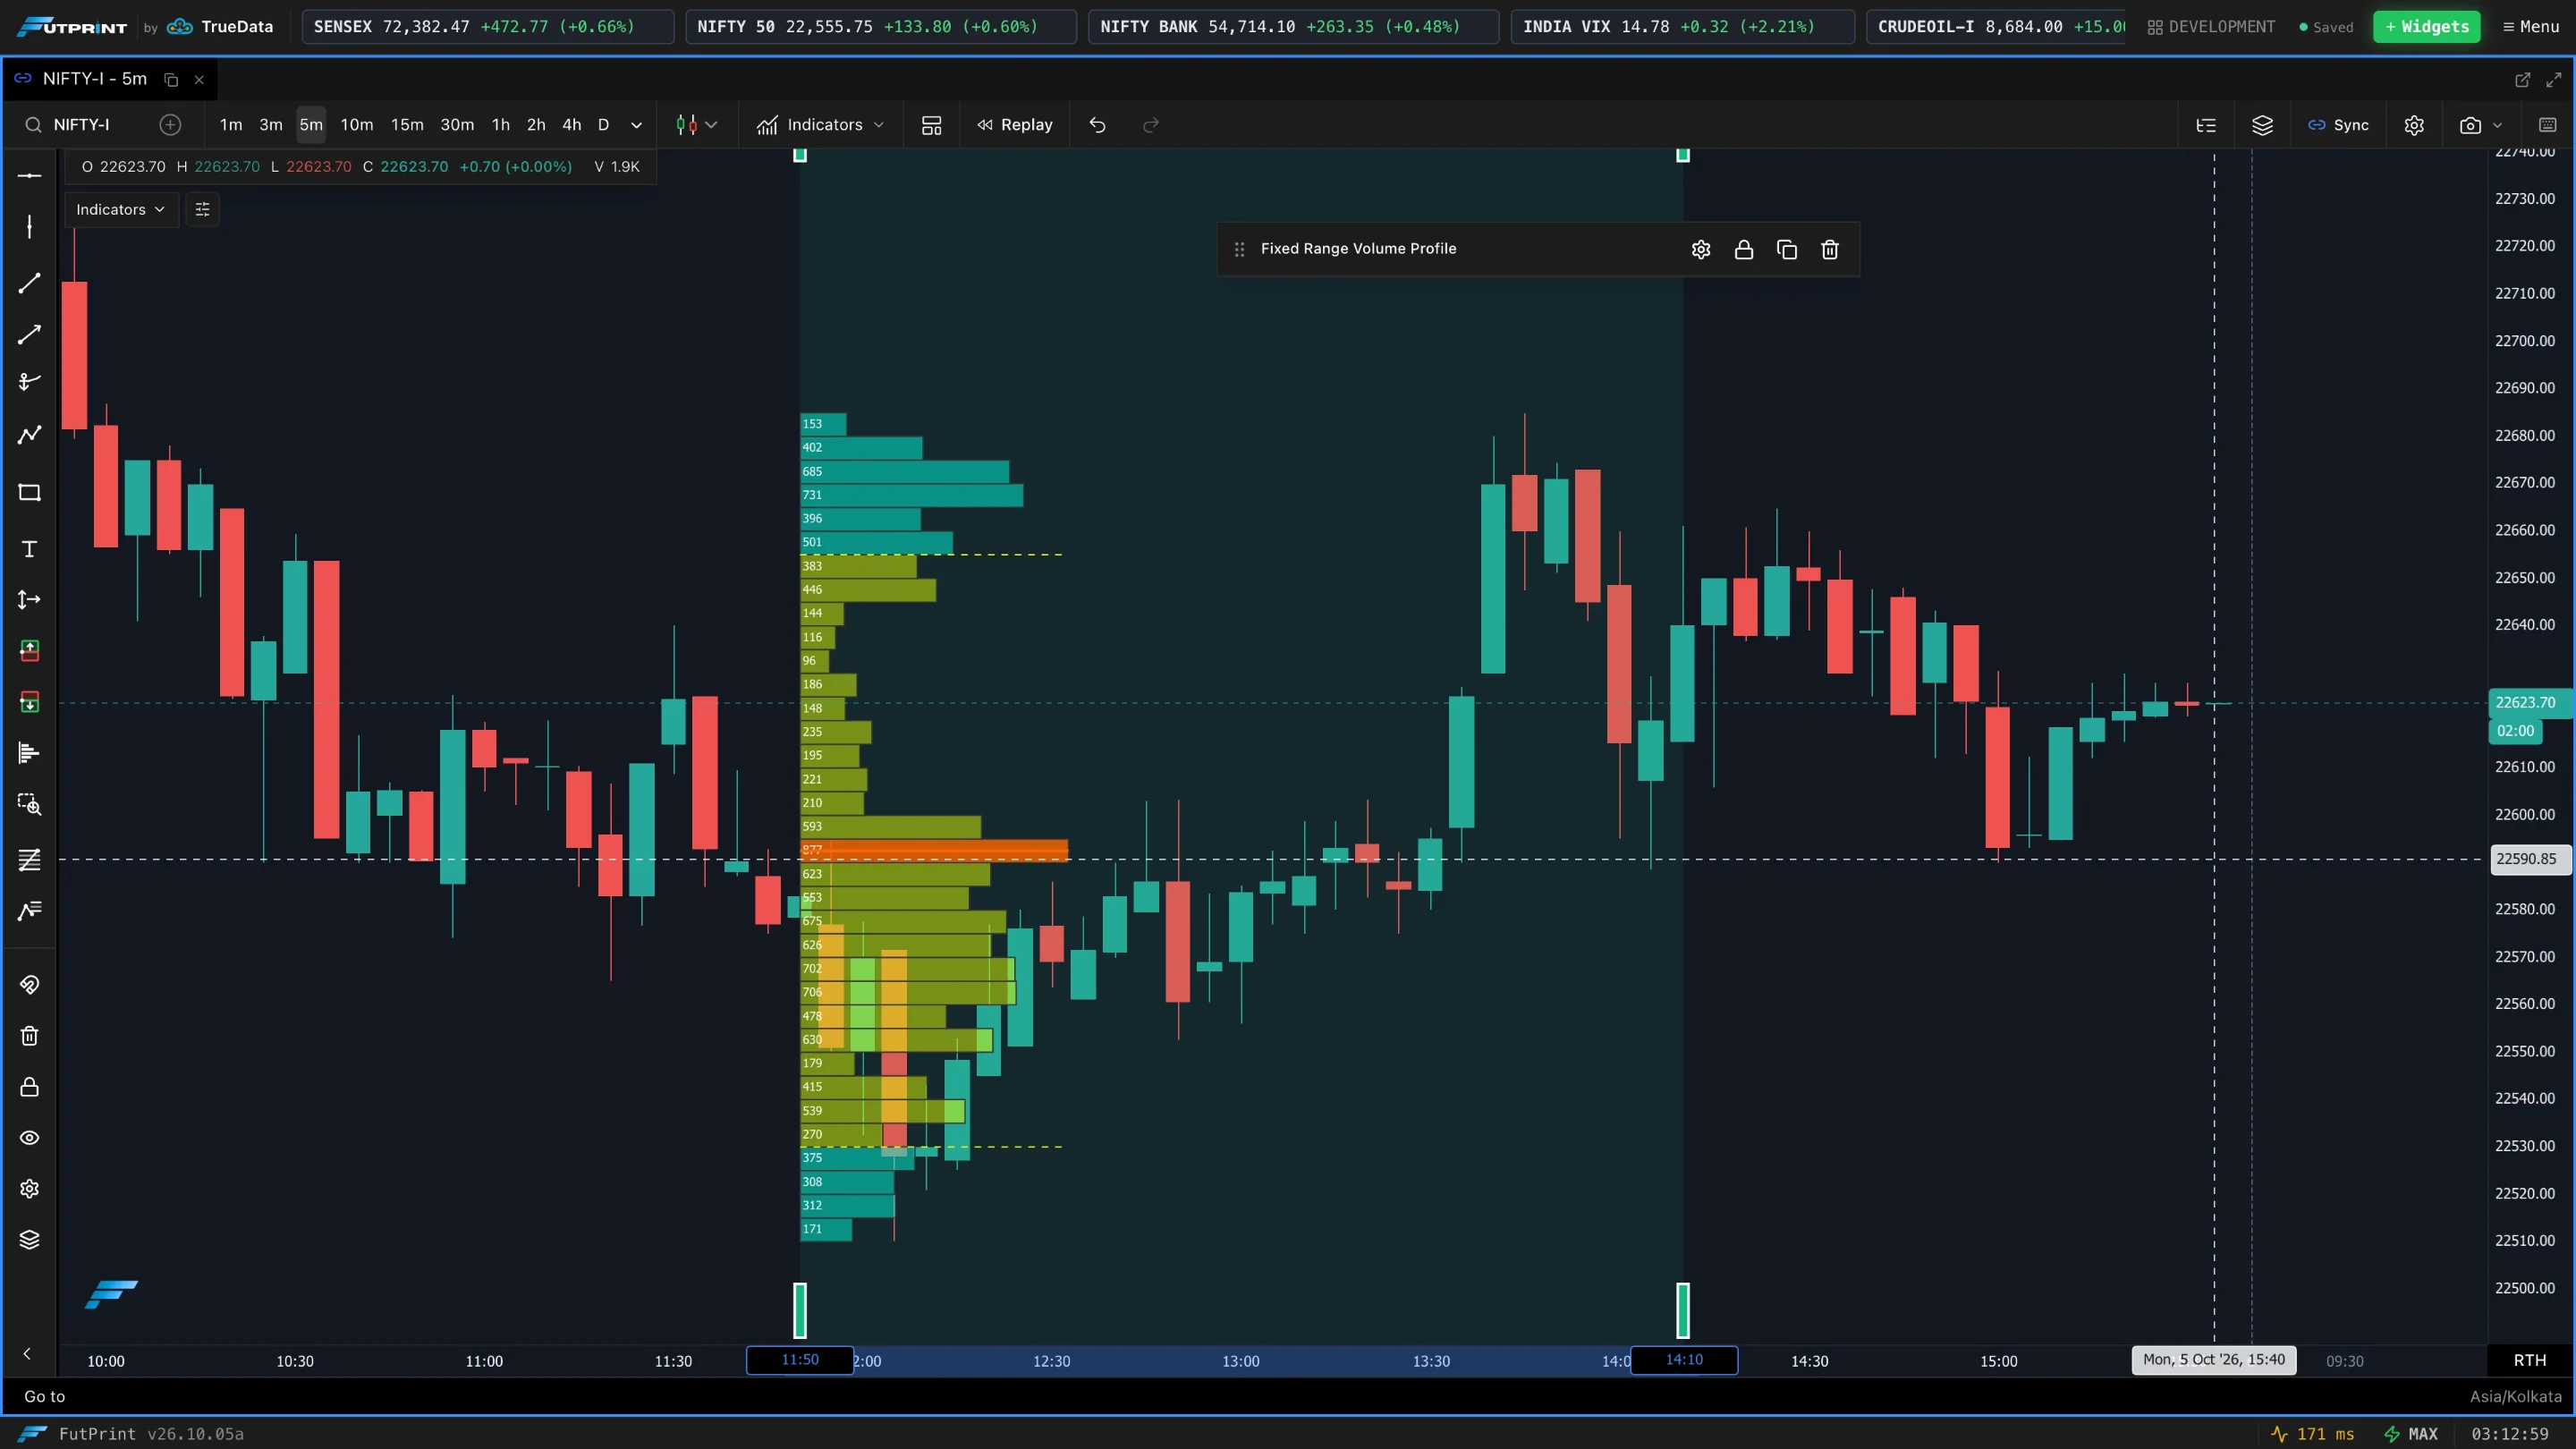
When a drawing is selected, a small toolbar appears at the top of the chart with the tool's name, its colour and line style, and buttons for settings, lock, duplicate and delete. It is visible in every screenshot below.
Lines & measures
| Tool | Use |
|---|---|
| Trend Line | A line between two points — the workhorse for trends and support/resistance. |
| Ray | A line that starts at its anchor and extends infinitely in one direction. |
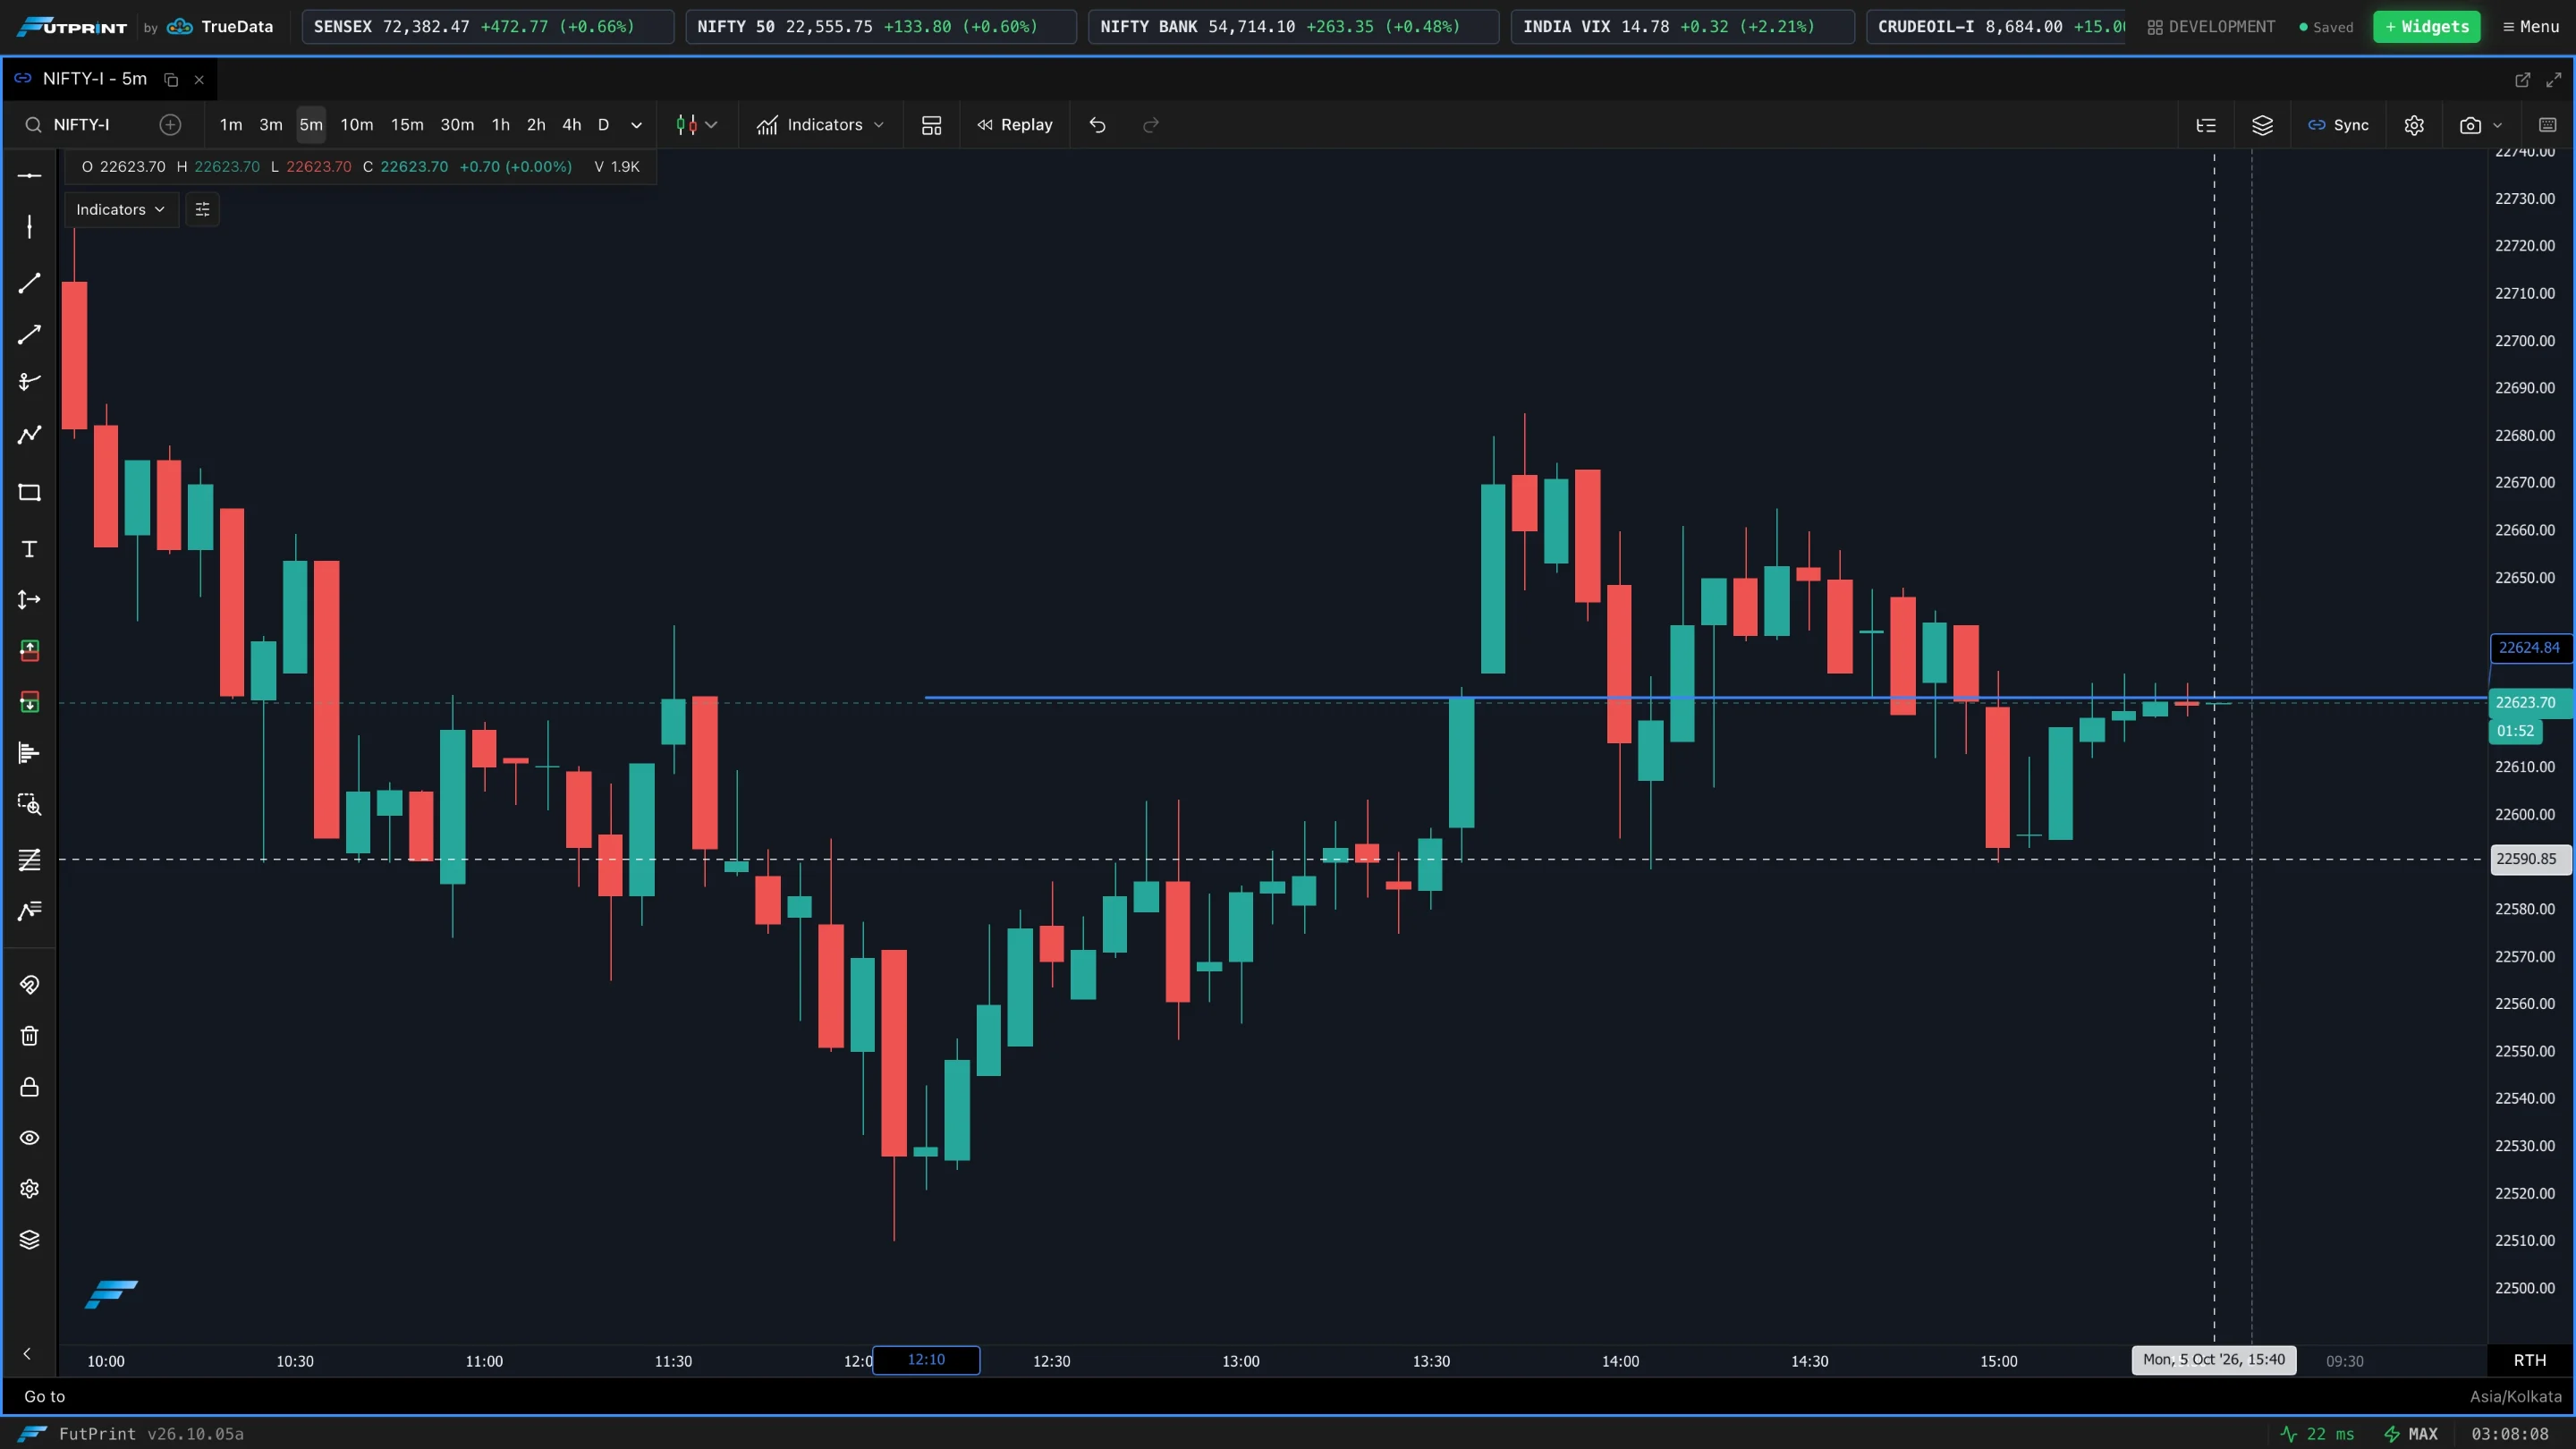
| Horizontal Line | A price level across the whole chart (support, resistance, targets). |
| Vertical Line | A time marker (events, sessions, expiries). |
| Parallel Channel | Two parallel trend lines marking a channel; drag the width to fit. |
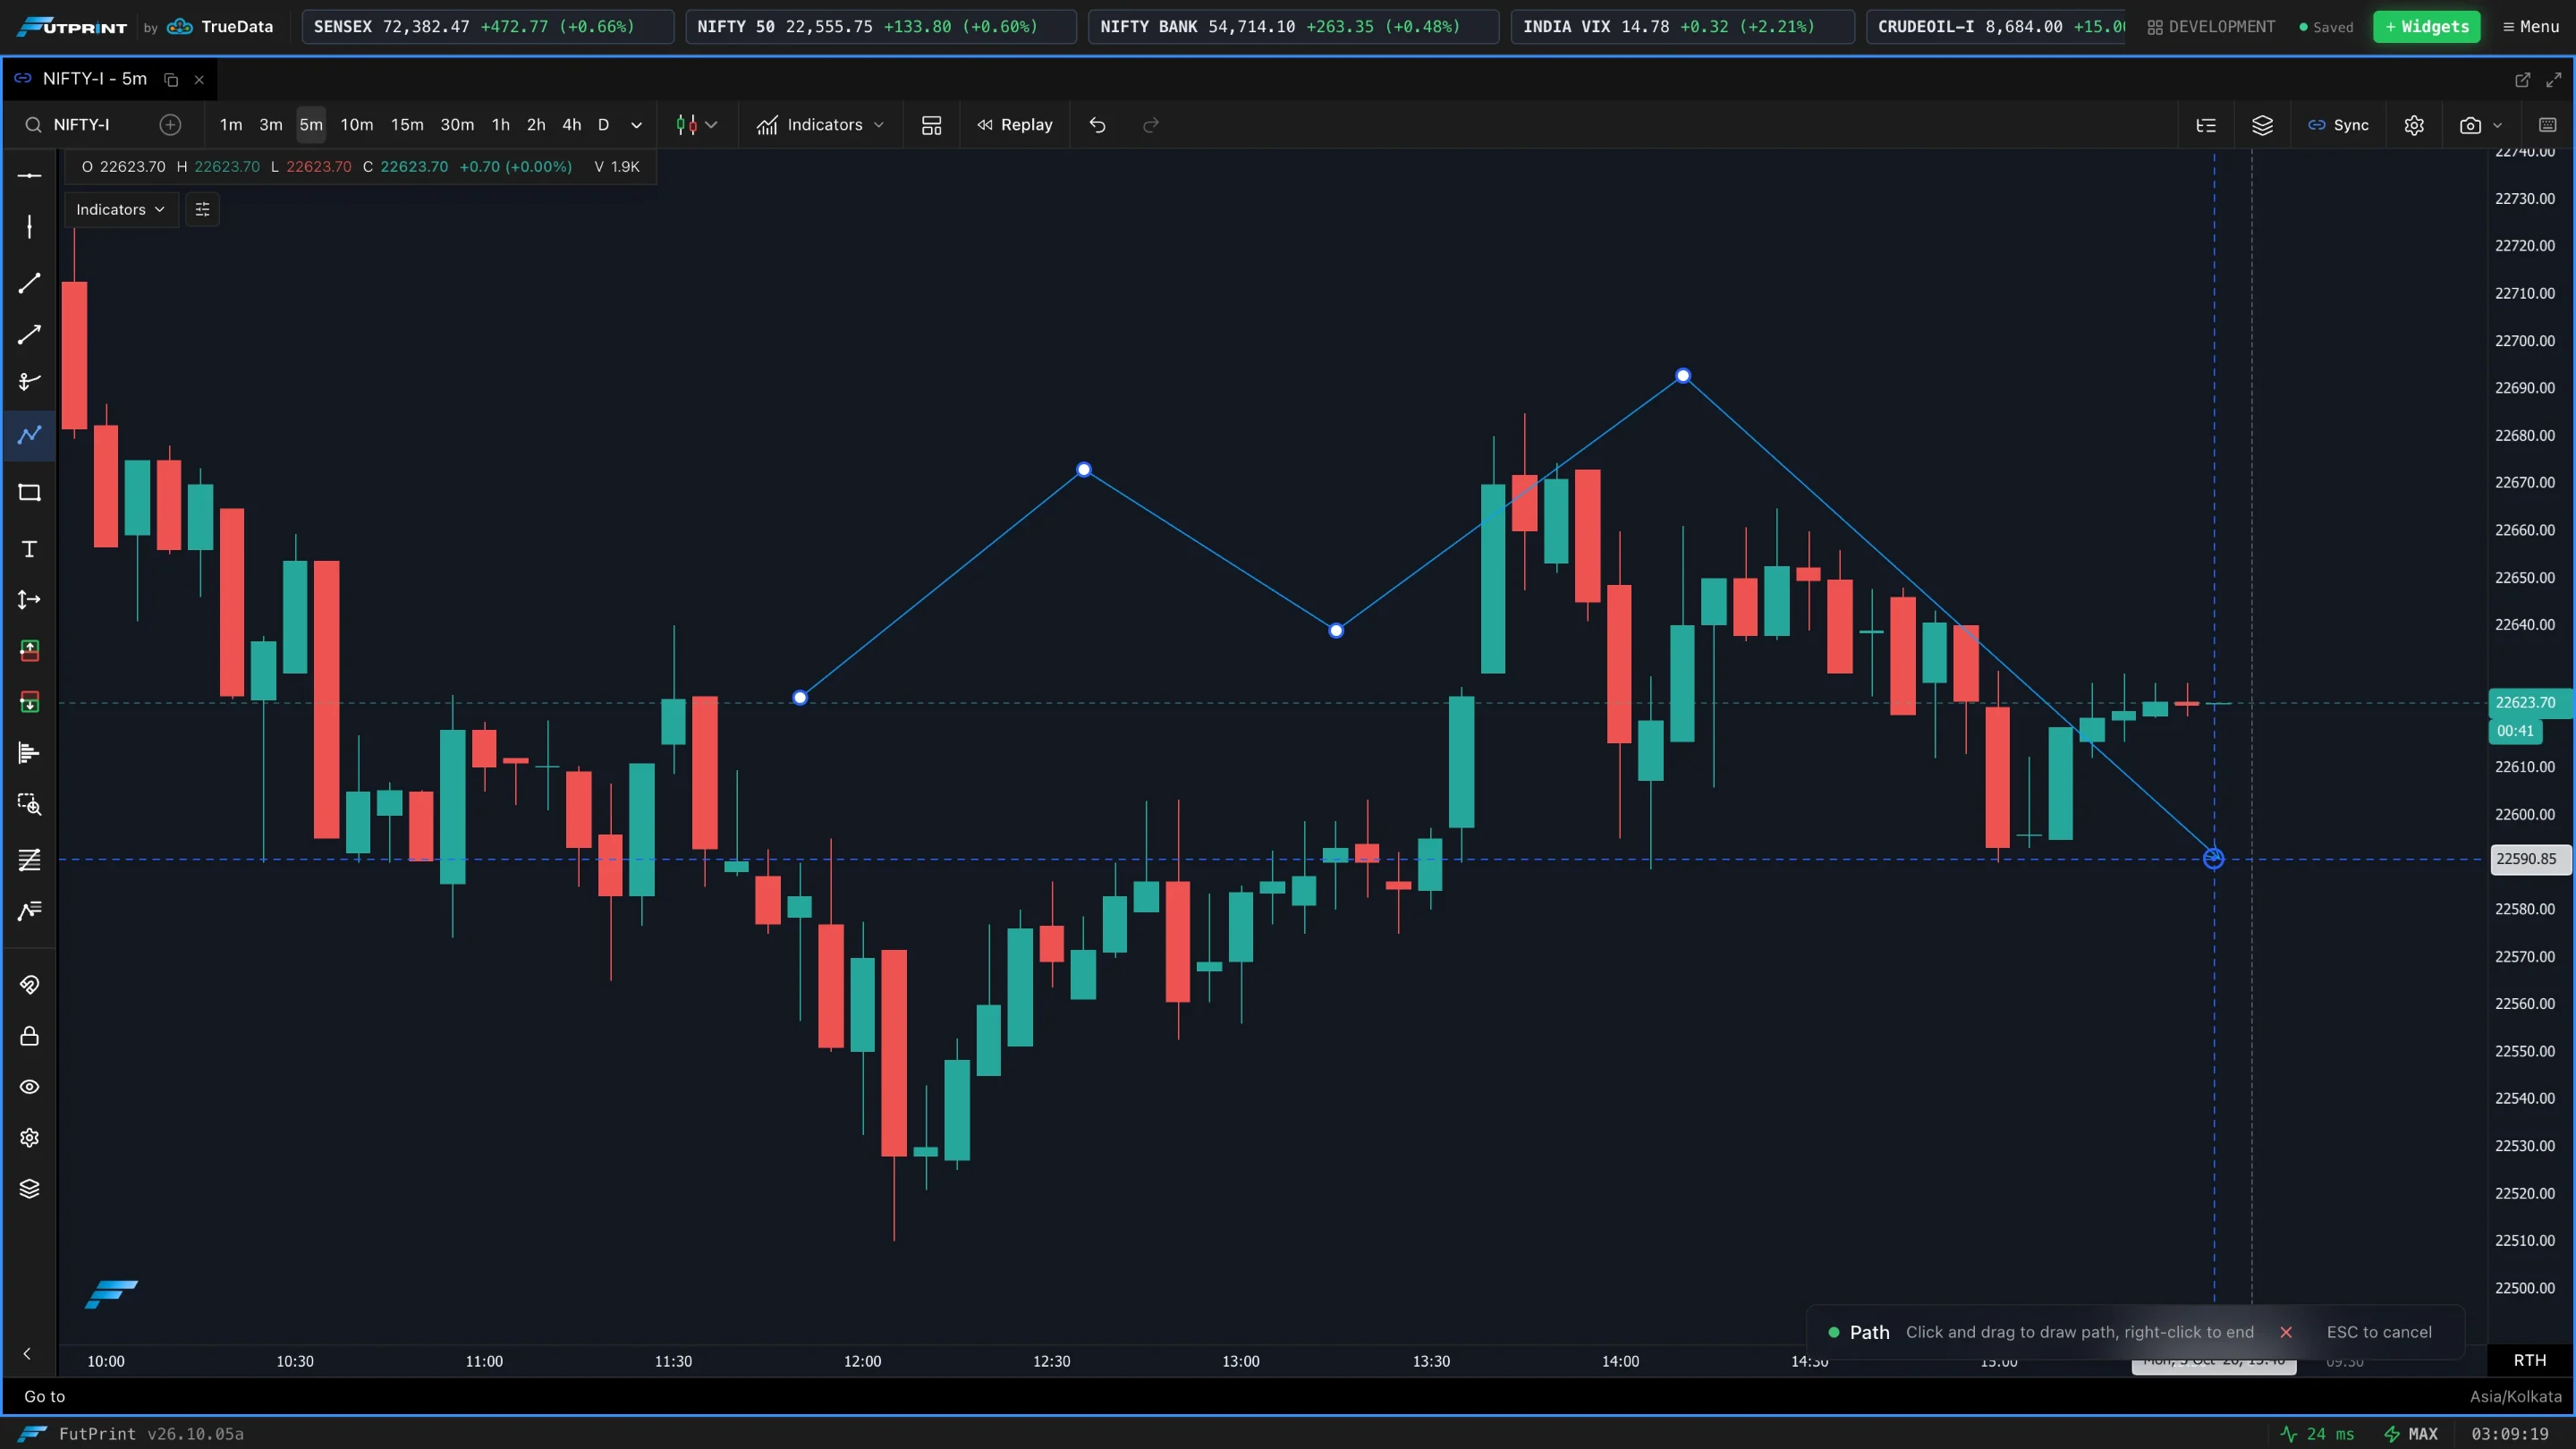
| Path | A multi-segment / freehand line for marking out a route price took or might take. |
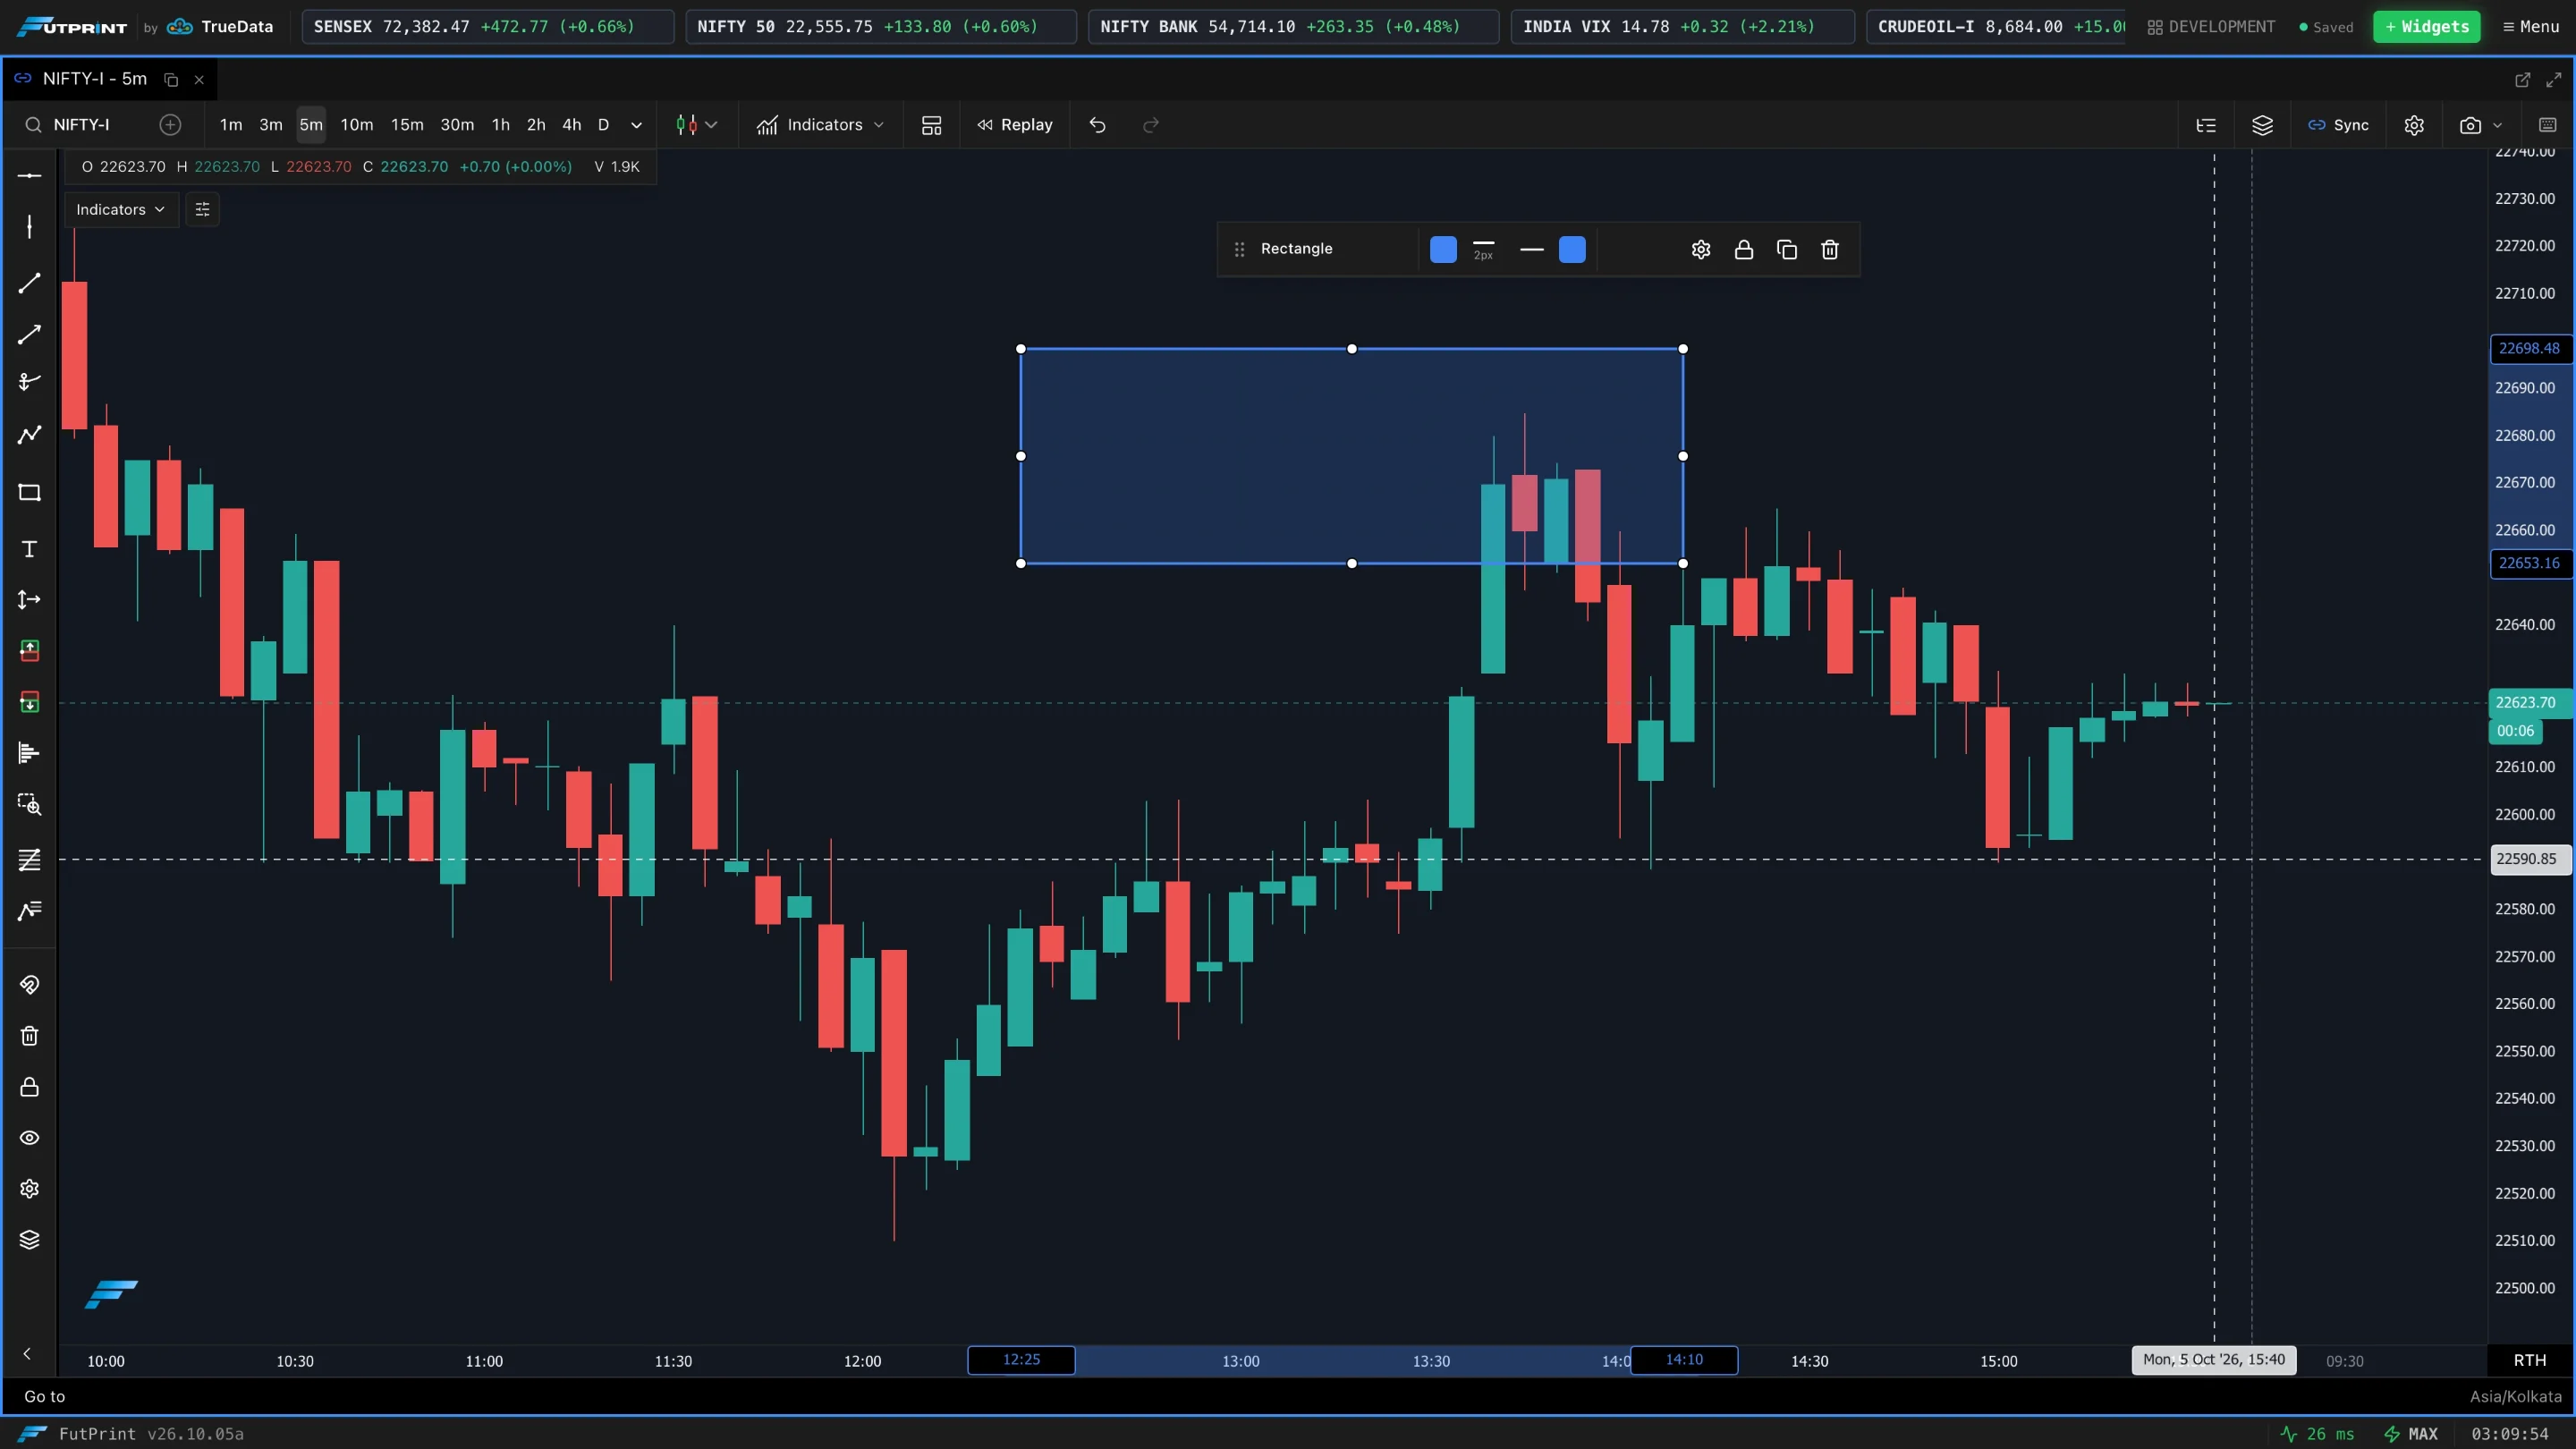
| Rectangle | A box to highlight a zone or consolidation area. |
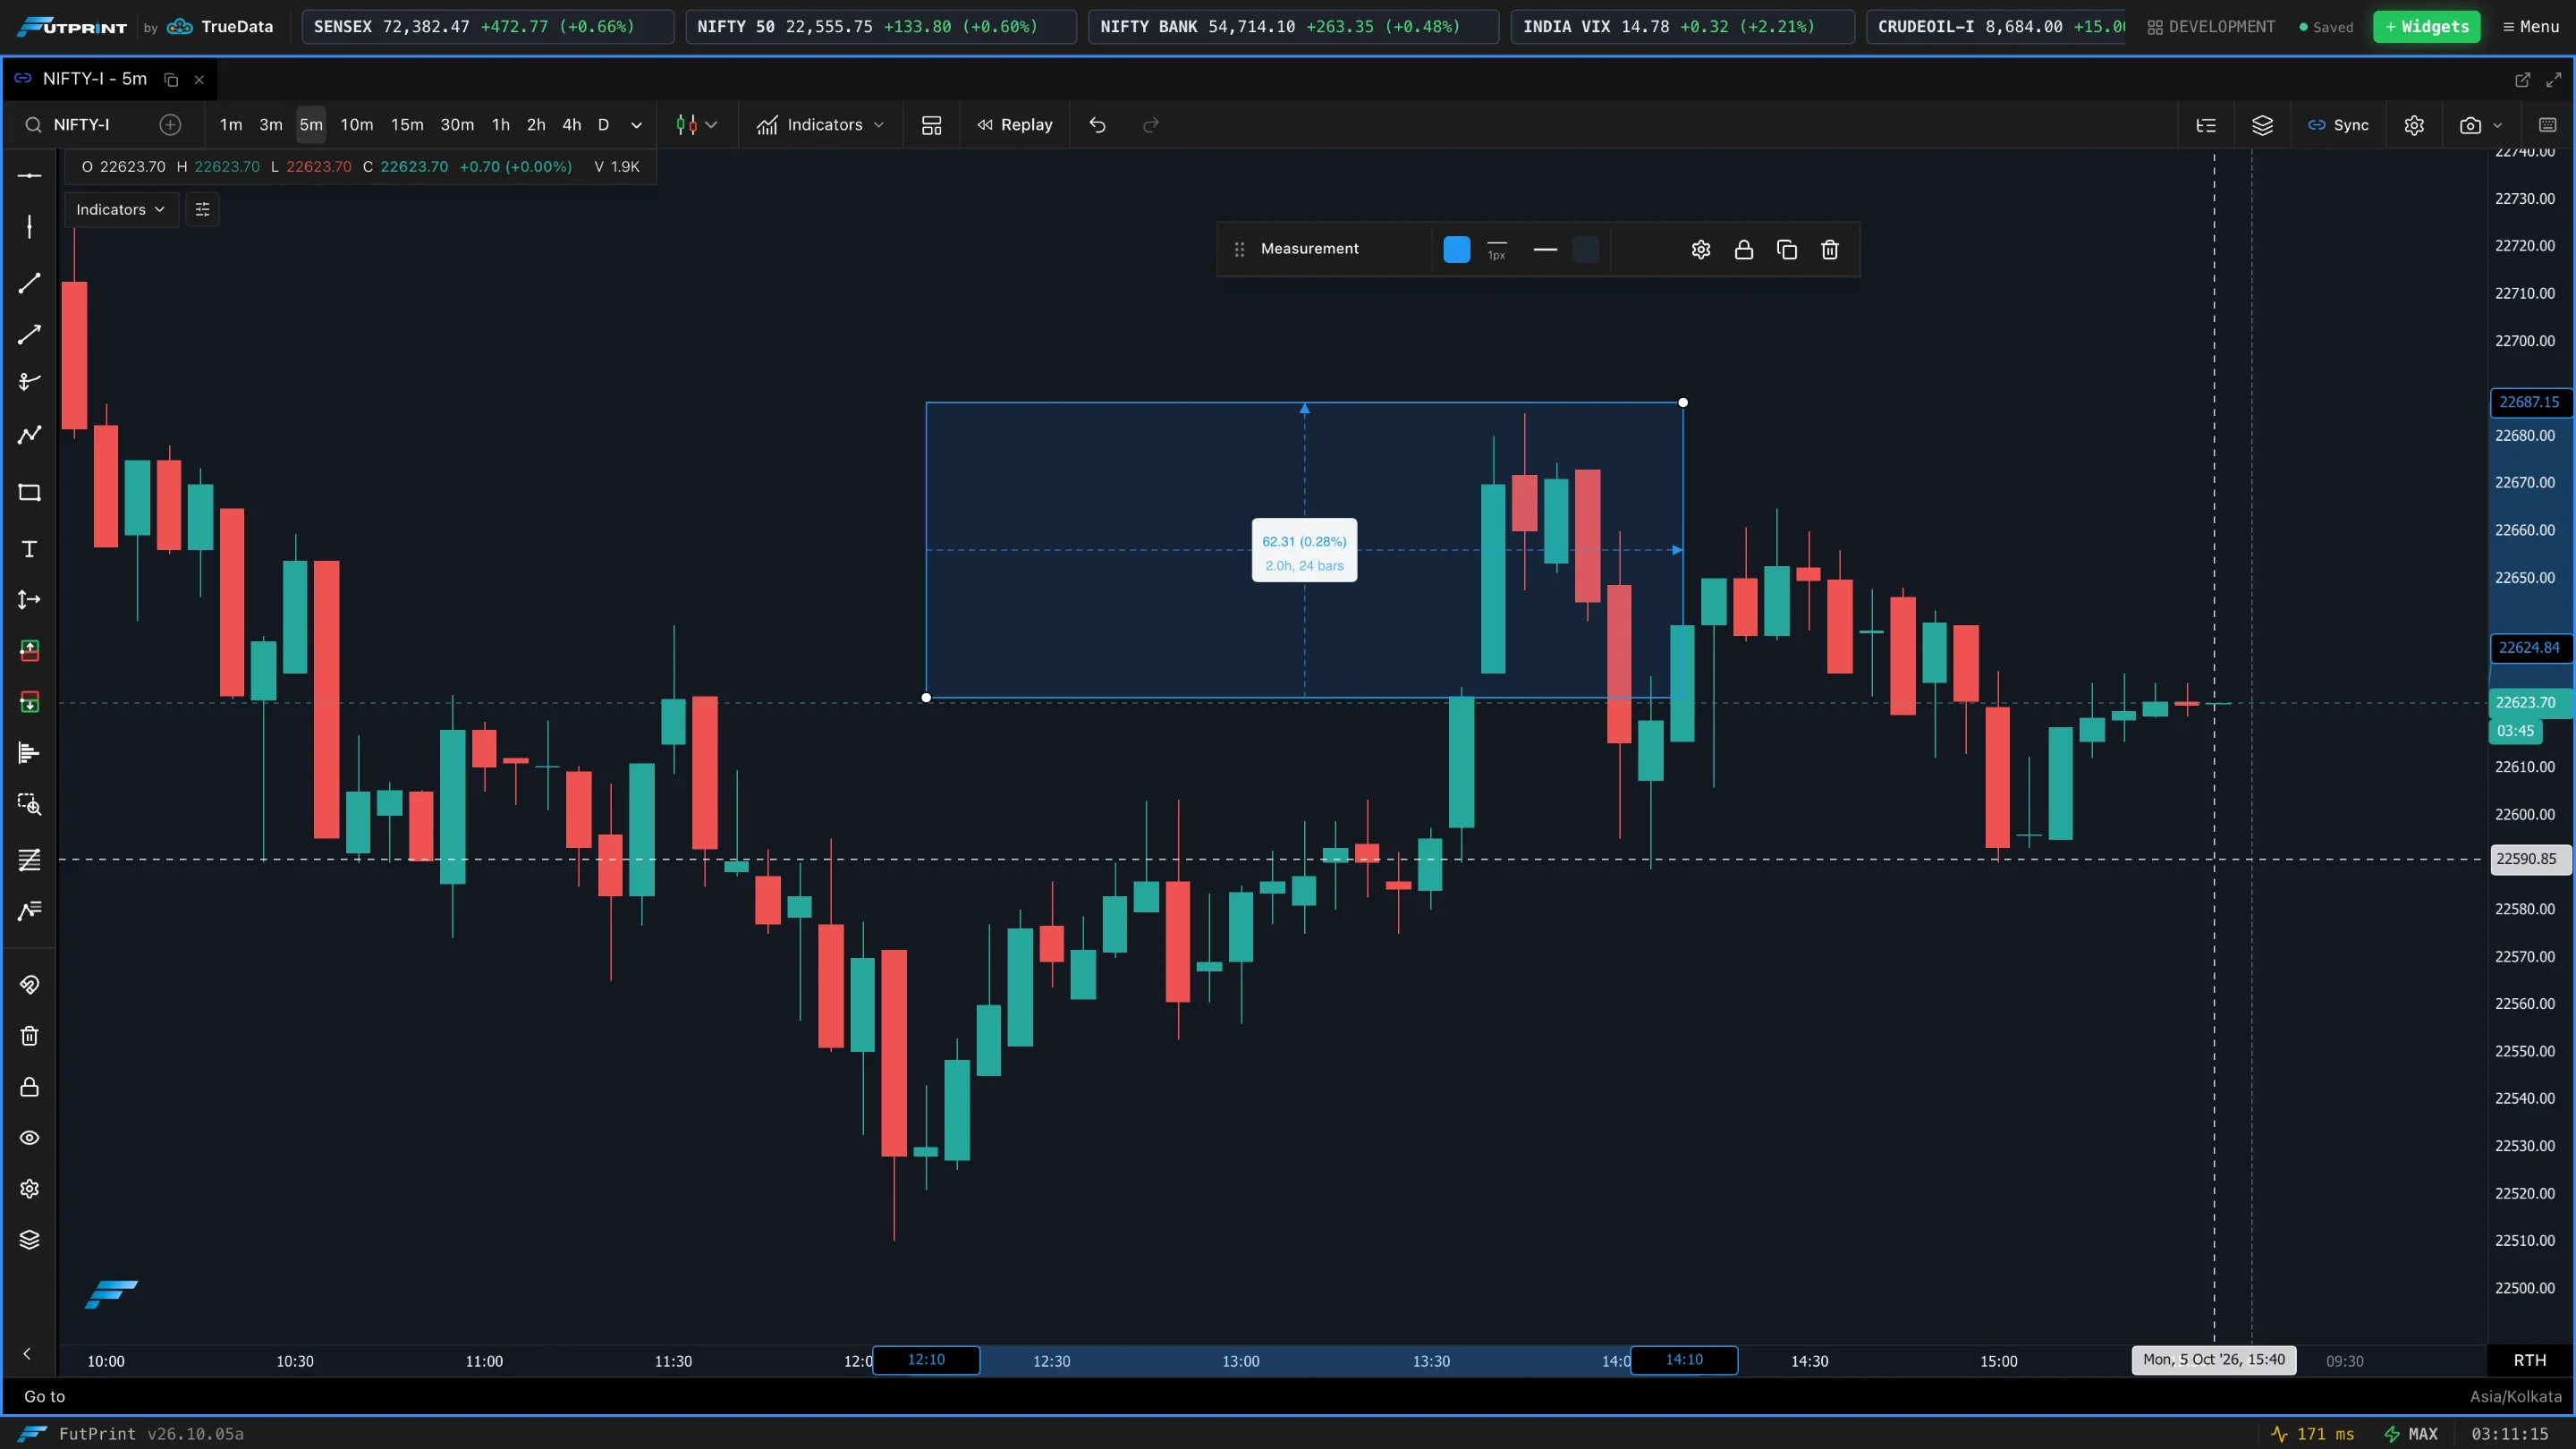
| Measurement | A ruler — drag to read the price change, % move, bars and time between two points. |
| Zoom Rectangle | Drag a box to zoom the view into that exact region. |
Fibonacci
| Tool | Use |
|---|---|
| Fib Retracement | Anchor a swing high→low (or low→high) to plot retracement levels (0–100%) and shaded bands. |
| Fib Extension | Project extension/target levels beyond the move for take-profit planning. |
Trade & position tools
| Tool | Use |
|---|---|
| Long Position | Visualise a long with entry, stop and target — shows risk/reward and distances on the chart. |
| Short Position | The same for a short. |
| Position Line | A horizontal marker for an entry/average price. |
| Order Line | A price level representing a working order. |
| Alert Line | A level that flags when price reaches it. |
/help-assets/chart/draw-long-position.mp4VWAP & volume
| Tool | Use |
|---|---|
| Anchored VWAP | A volume-weighted average price anchored to a point you choose (a swing, the open, an event) — tracks the average paid since that anchor. |
| Fixed Range Volume Profile | Draw a range and get a volume-by-price profile for exactly that span, including its point of control and value area. |
Annotations
| Tool | Use |
|---|---|
| Text | Place a text note anywhere on the chart. |
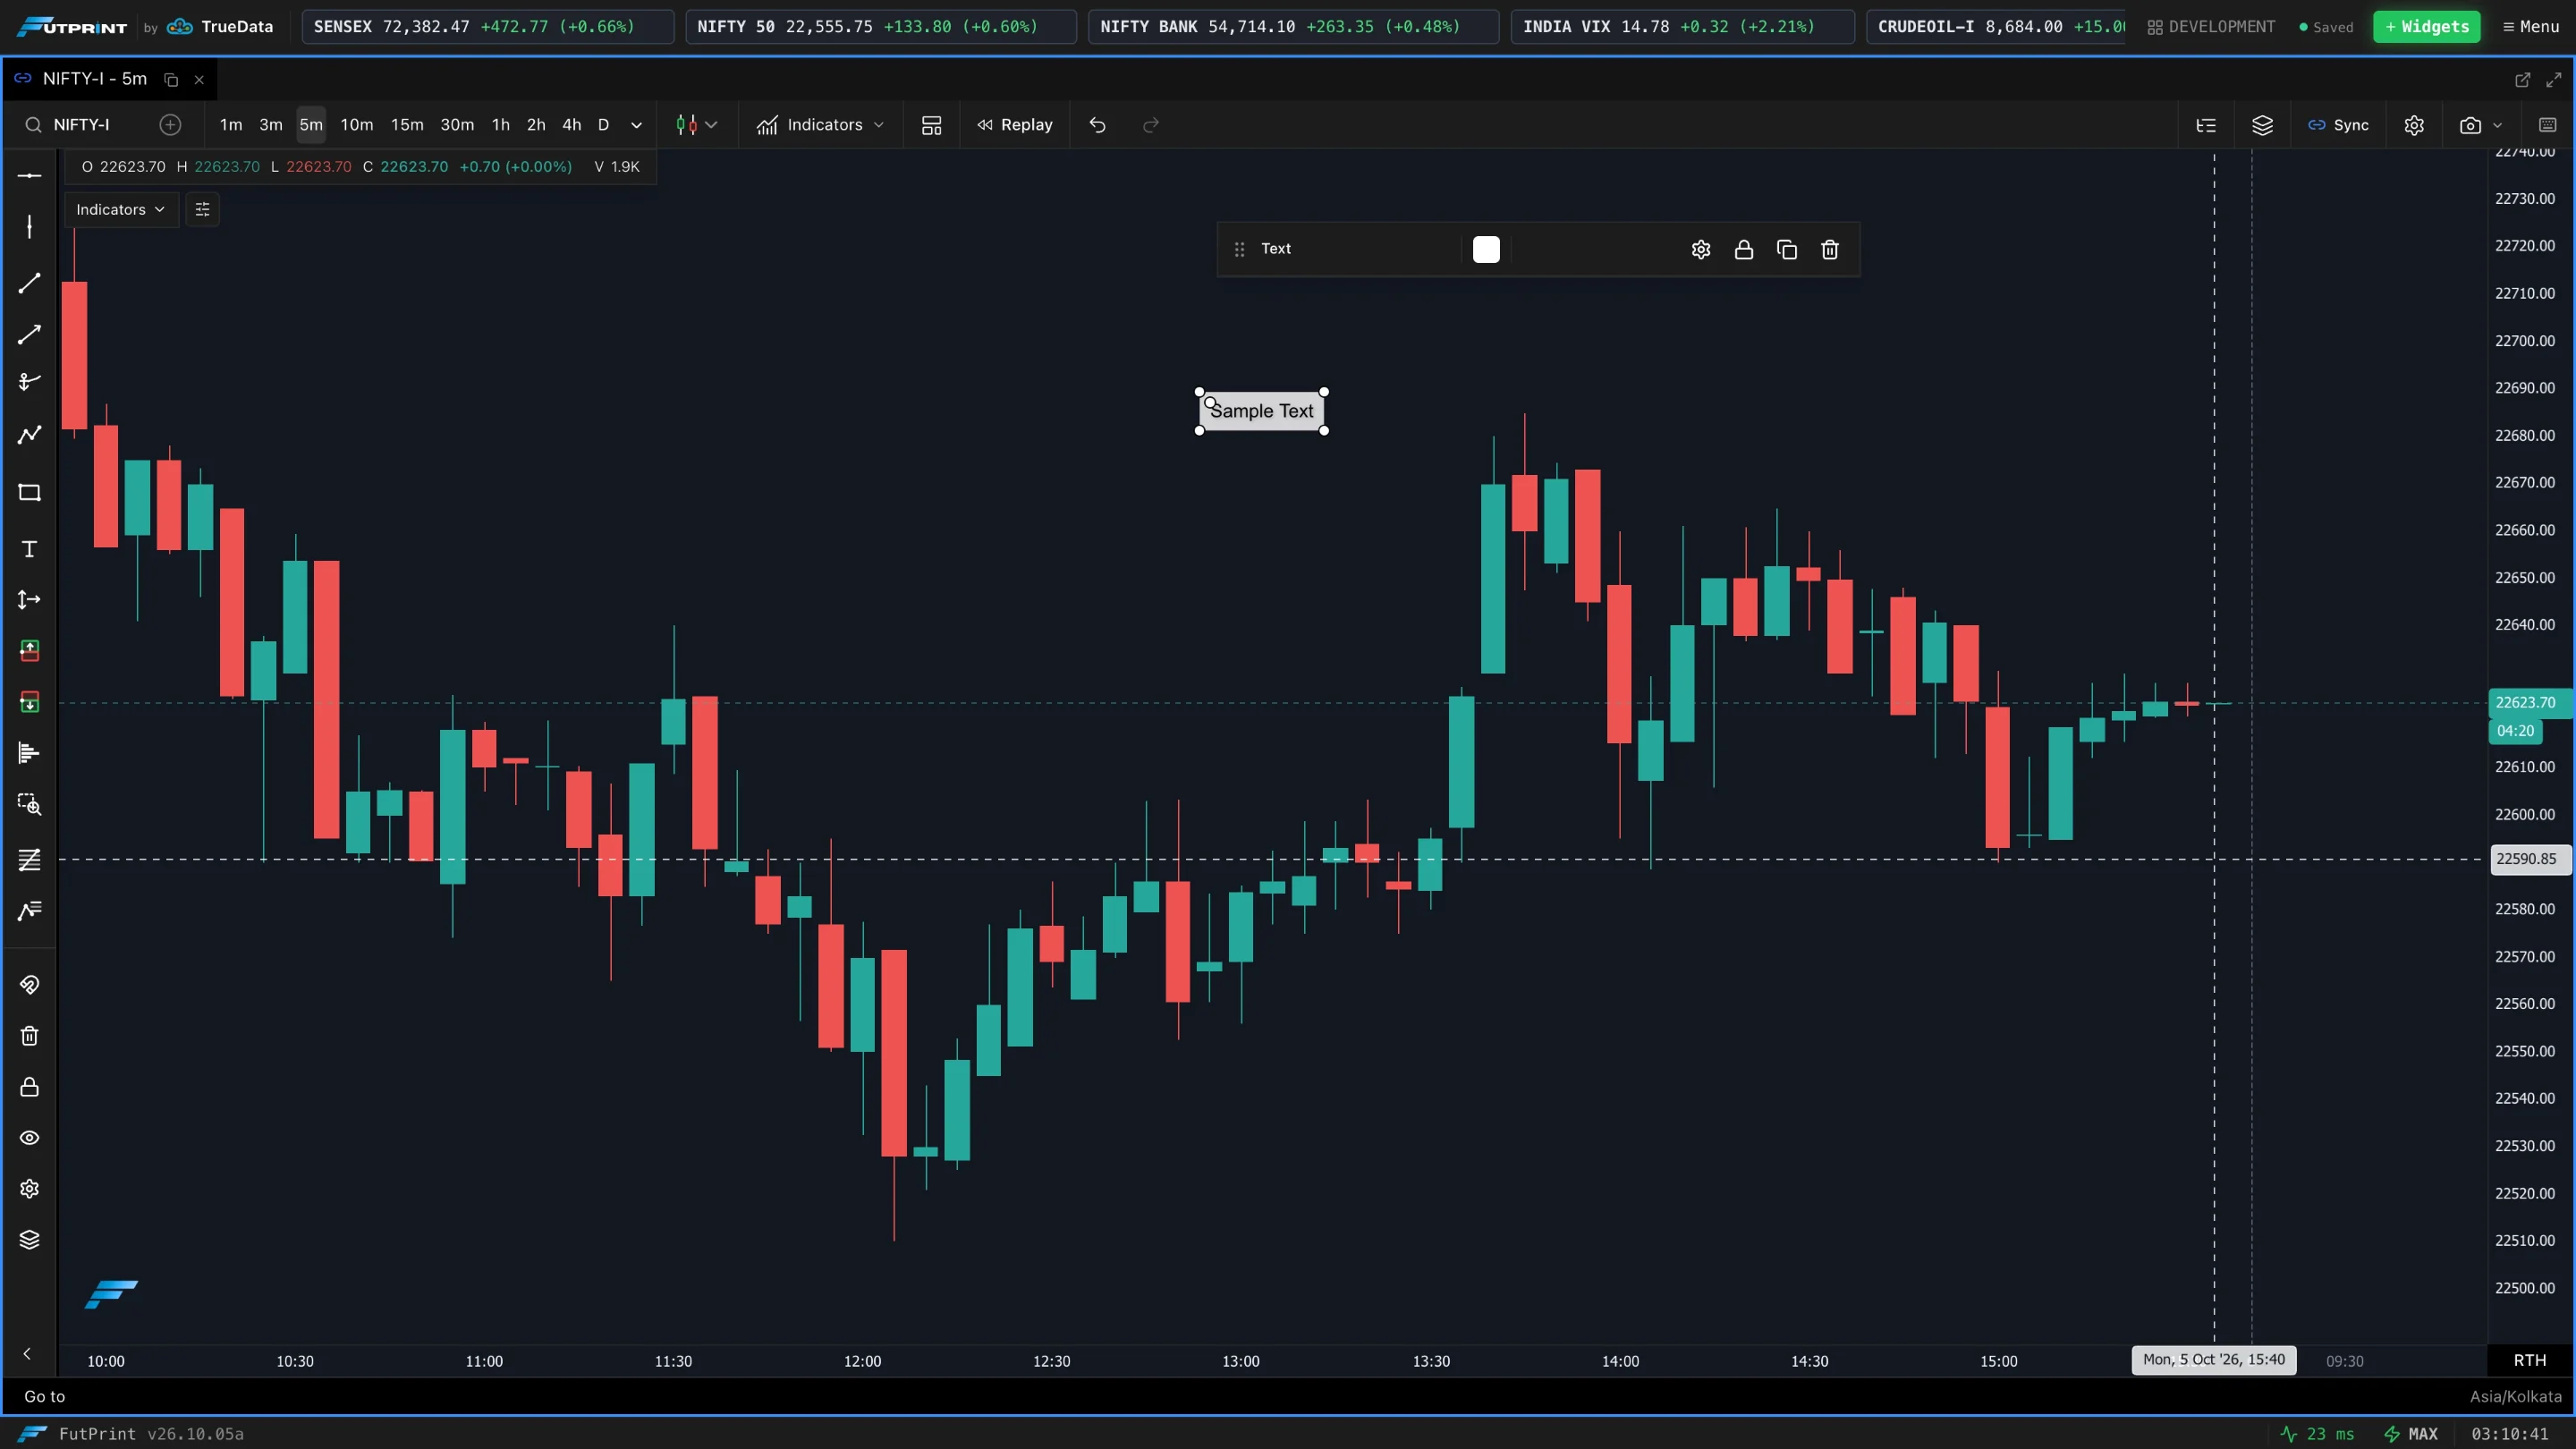
Selected drawings expose line colour, style and width (and a text colour for notes). Every drawing is saved with the chart, so your mark-up is still there when you reopen the workspace.
A few geometric shapes exist in addition to the above; the tools listed here are the primary set on the rail. If a tool you expect isn't visible, widen the panel — the rail scrolls when space is tight.