Option Strategies
Option Strategies is a strategy builder on top of a replayable option chain. Build a multi-leg position, see its payoff, greeks and margin, then step through a past session bar by bar to watch how it would have behaved.
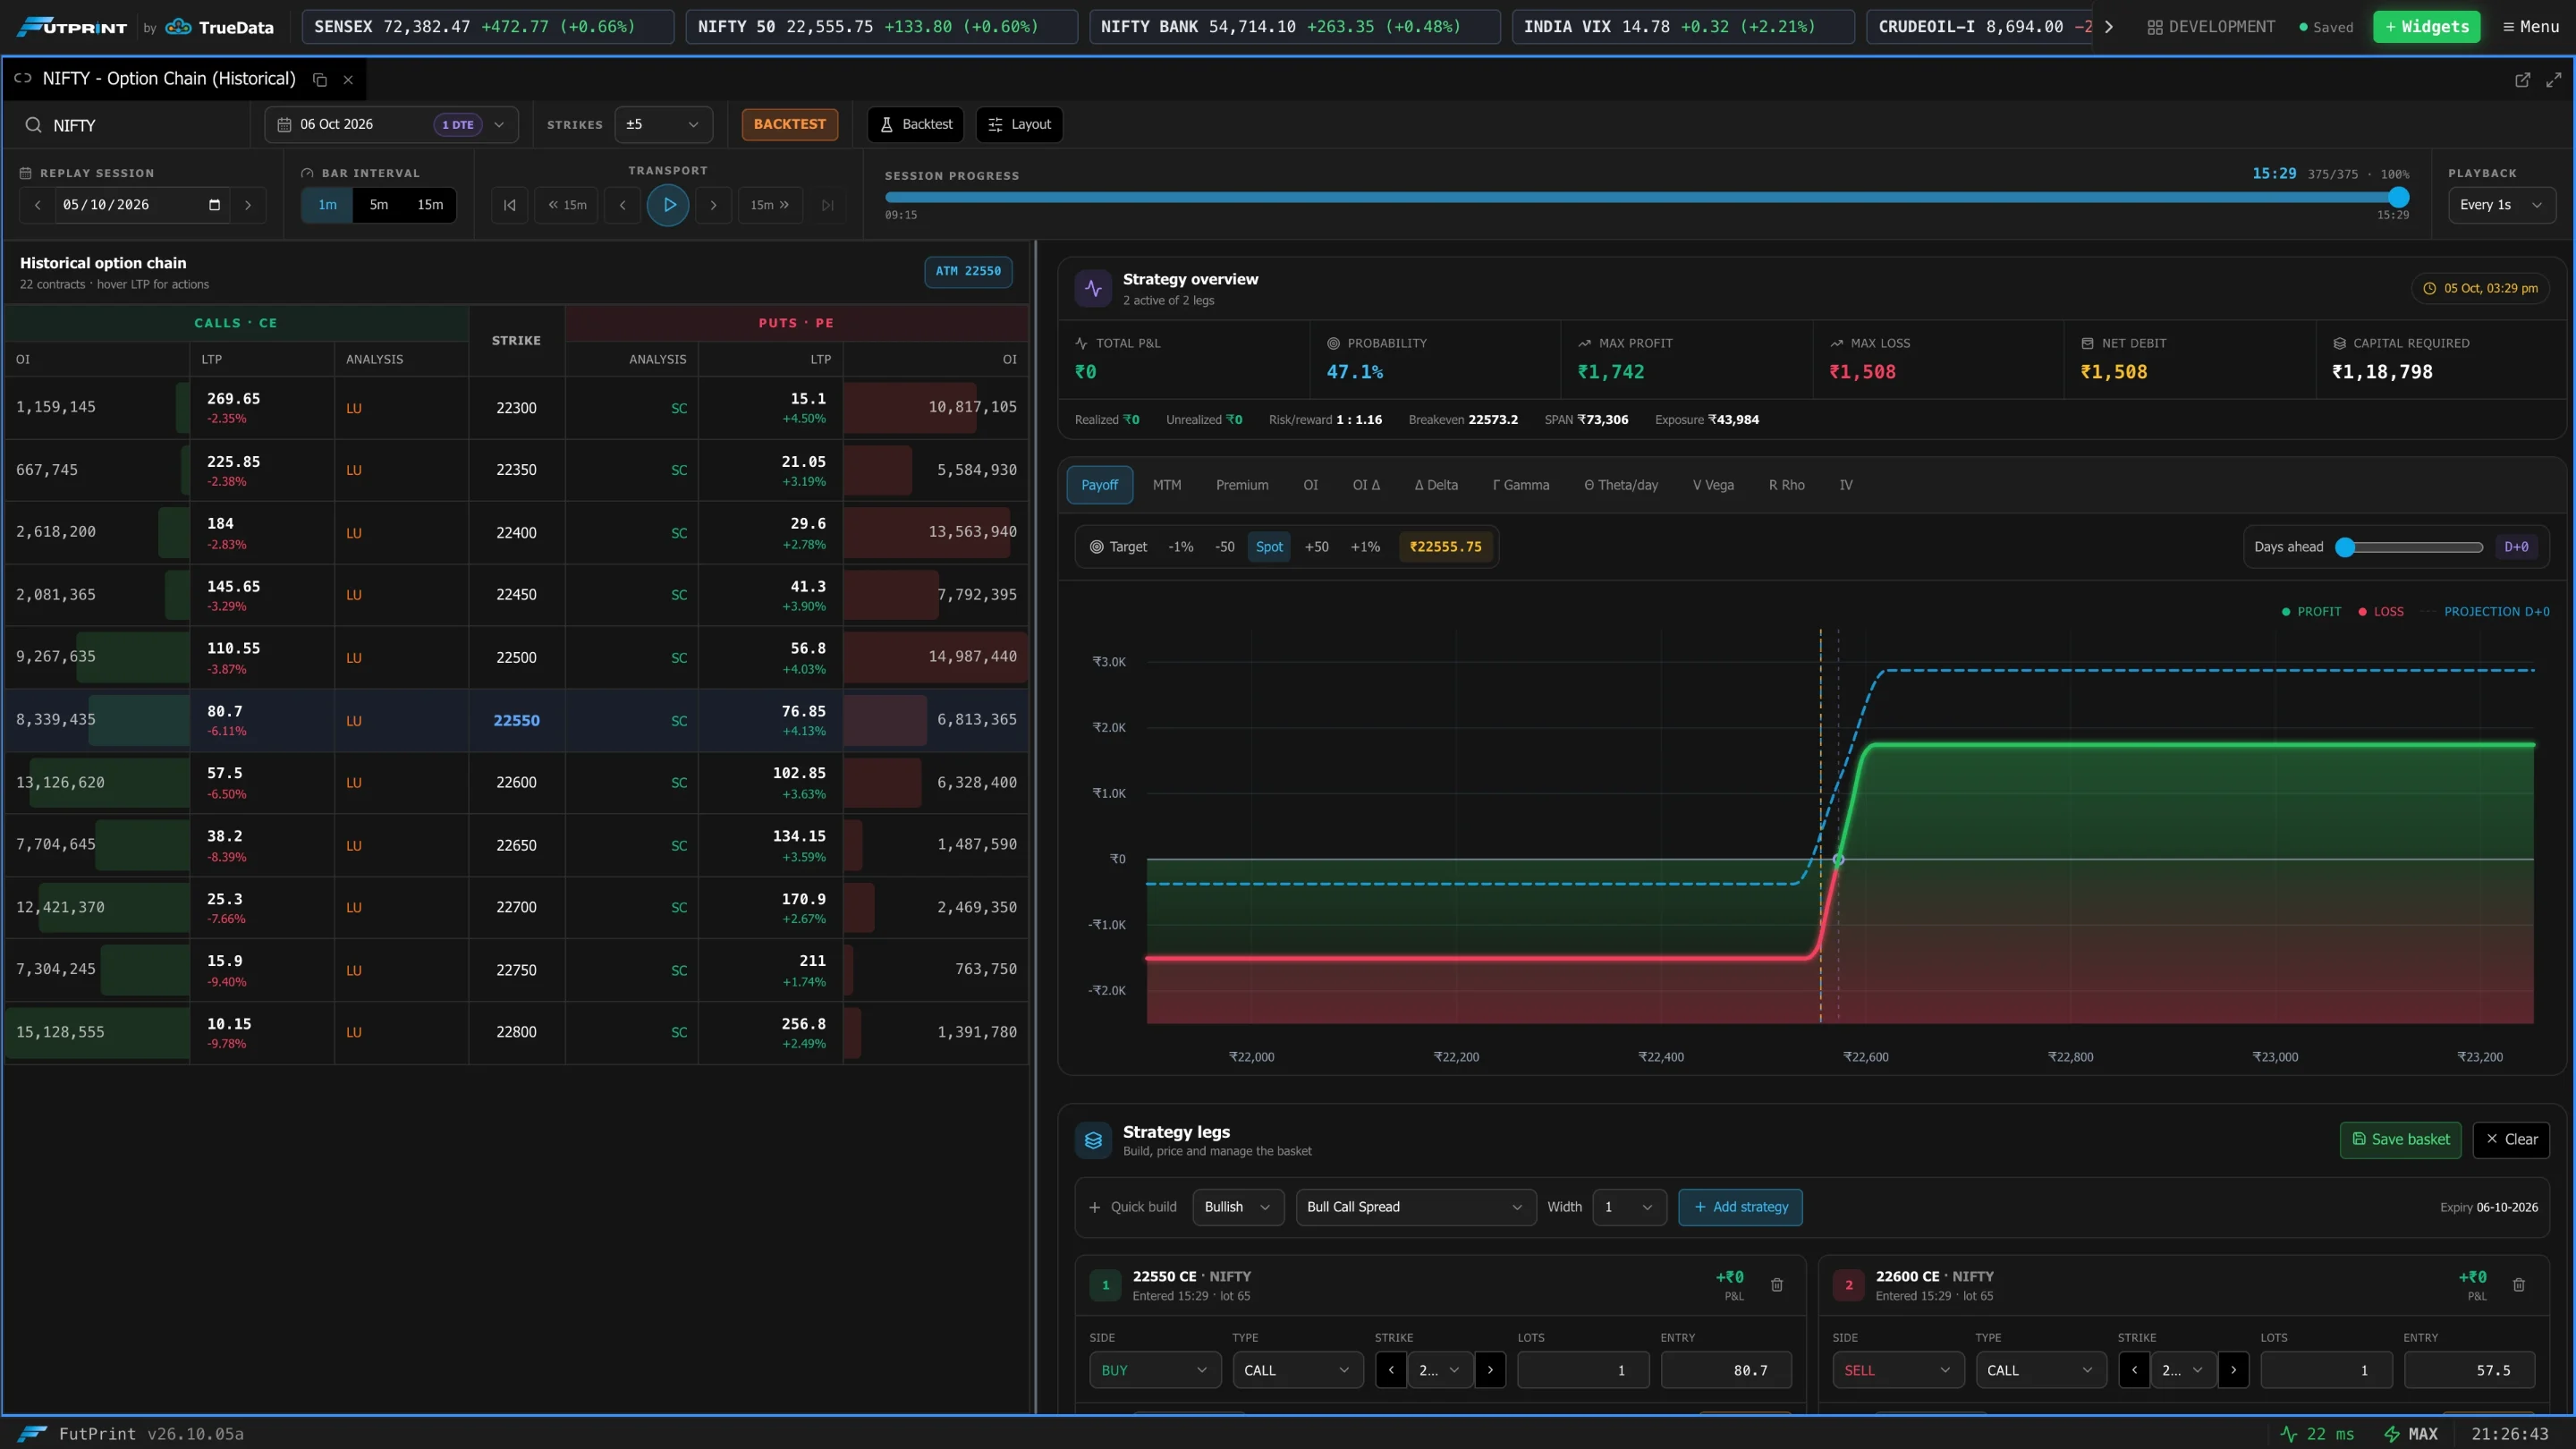
Loading a session
- 1Search an underlying
Search and select the underlying, then choose the expiry and how many strikes to show around the money.
- 2Choose the session
Under Replay session, pick a date or use Previous / Next trading day. Market holidays have no data and show an empty chain.
- 3Choose the bar interval
1m, 5m or 15m.
Replay controls
| Control | What it does |
|---|---|
| Session open / Session close | Jump to the first or last bar. |
| 15 minutes back / forward | Jump by 15 minutes. |
| Previous bar / Next bar | Step one bar. |
| Play replay | Play forward automatically at the Playback speed. |
| Session progress | Drag to any time in the session. |
The chain, the payoff and every figure update to the bar you are on.
The historical option chain
Calls on the left, puts on the right, strikes in the centre, each with OI, LTP and an Analysis tag. Hover an LTP cell for its actions: add a buy leg, add a sell leg, open the contract's chart, or add it to a watchlist.
Building a strategy
Add legs from the chain, or use Quick build:
- Choose a view — Bullish, Bearish, Neutral or Others.
- Choose a strategy. The bullish list, for example, includes Buy Call, Sell Put, Bull Call Spread, Bull Put Spread, Call Ratio Back Spread, Long Calendar with Calls, Bull Condor, Bull Butterfly, Range Forward and Long Synthetic Future.
- Set the Width (strike spacing between legs) and press Add strategy.
Each leg can then be edited: Side (buy/sell), Type (call/put), Strike, Lots and Entry price. Save basket keeps the set of legs; Clear removes them.
Strategy overview
| Figure | Meaning |
|---|---|
| Total P&L | Profit or loss at the current replay bar. |
| Probability | Estimated probability of profit. |
| Max profit / Max loss | The best and worst outcome at expiry. |
| Net debit / credit | Premium paid or received to open the position. |
| Capital required | Estimated margin, with the SPAN and exposure split beneath. |
| Risk/reward, Breakeven | Shown on the line below the cards. |
Analysis tabs
| Tab | Shows |
|---|---|
| Payoff | Profit and loss across underlying prices, with the projection for the selected day. Use the Target chips (−1% … +1%) and the Days ahead slider to move the scenario. |
| MTM | Mark-to-market P&L through the session. |
| Premium | Net premium of the position through the session. |
| OI / OI Δ | Open interest of the legs and its change. |
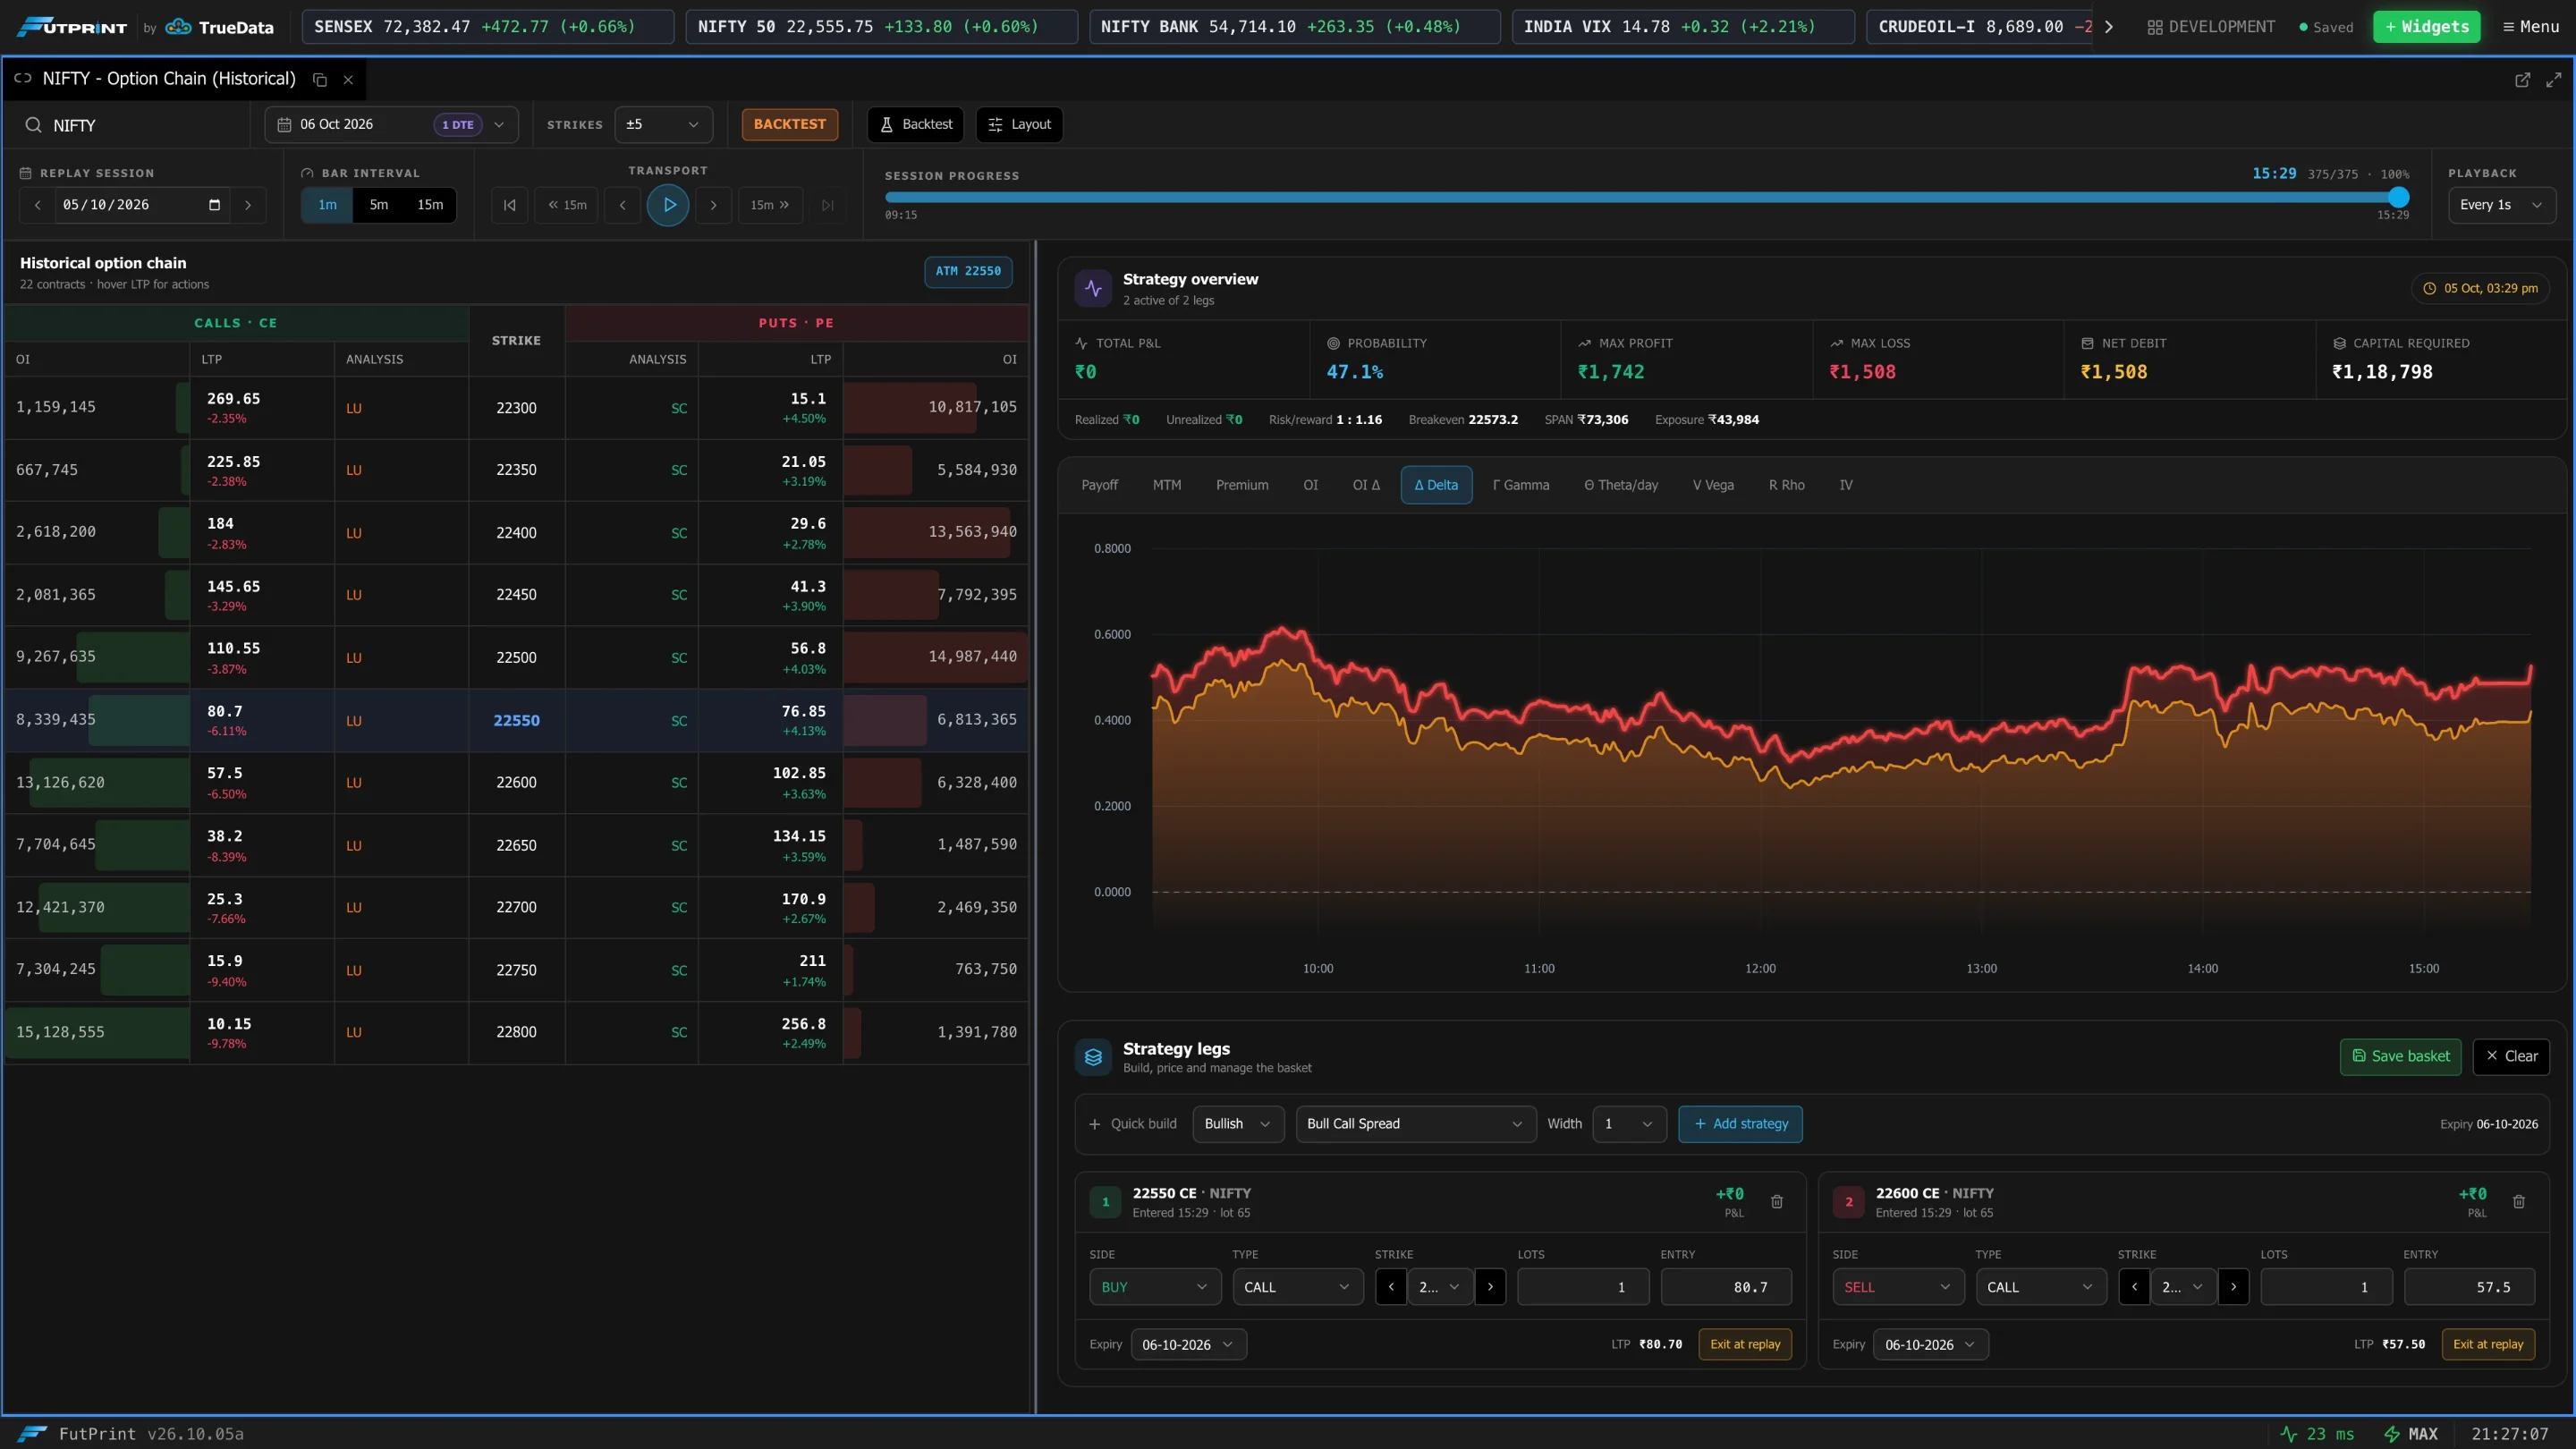
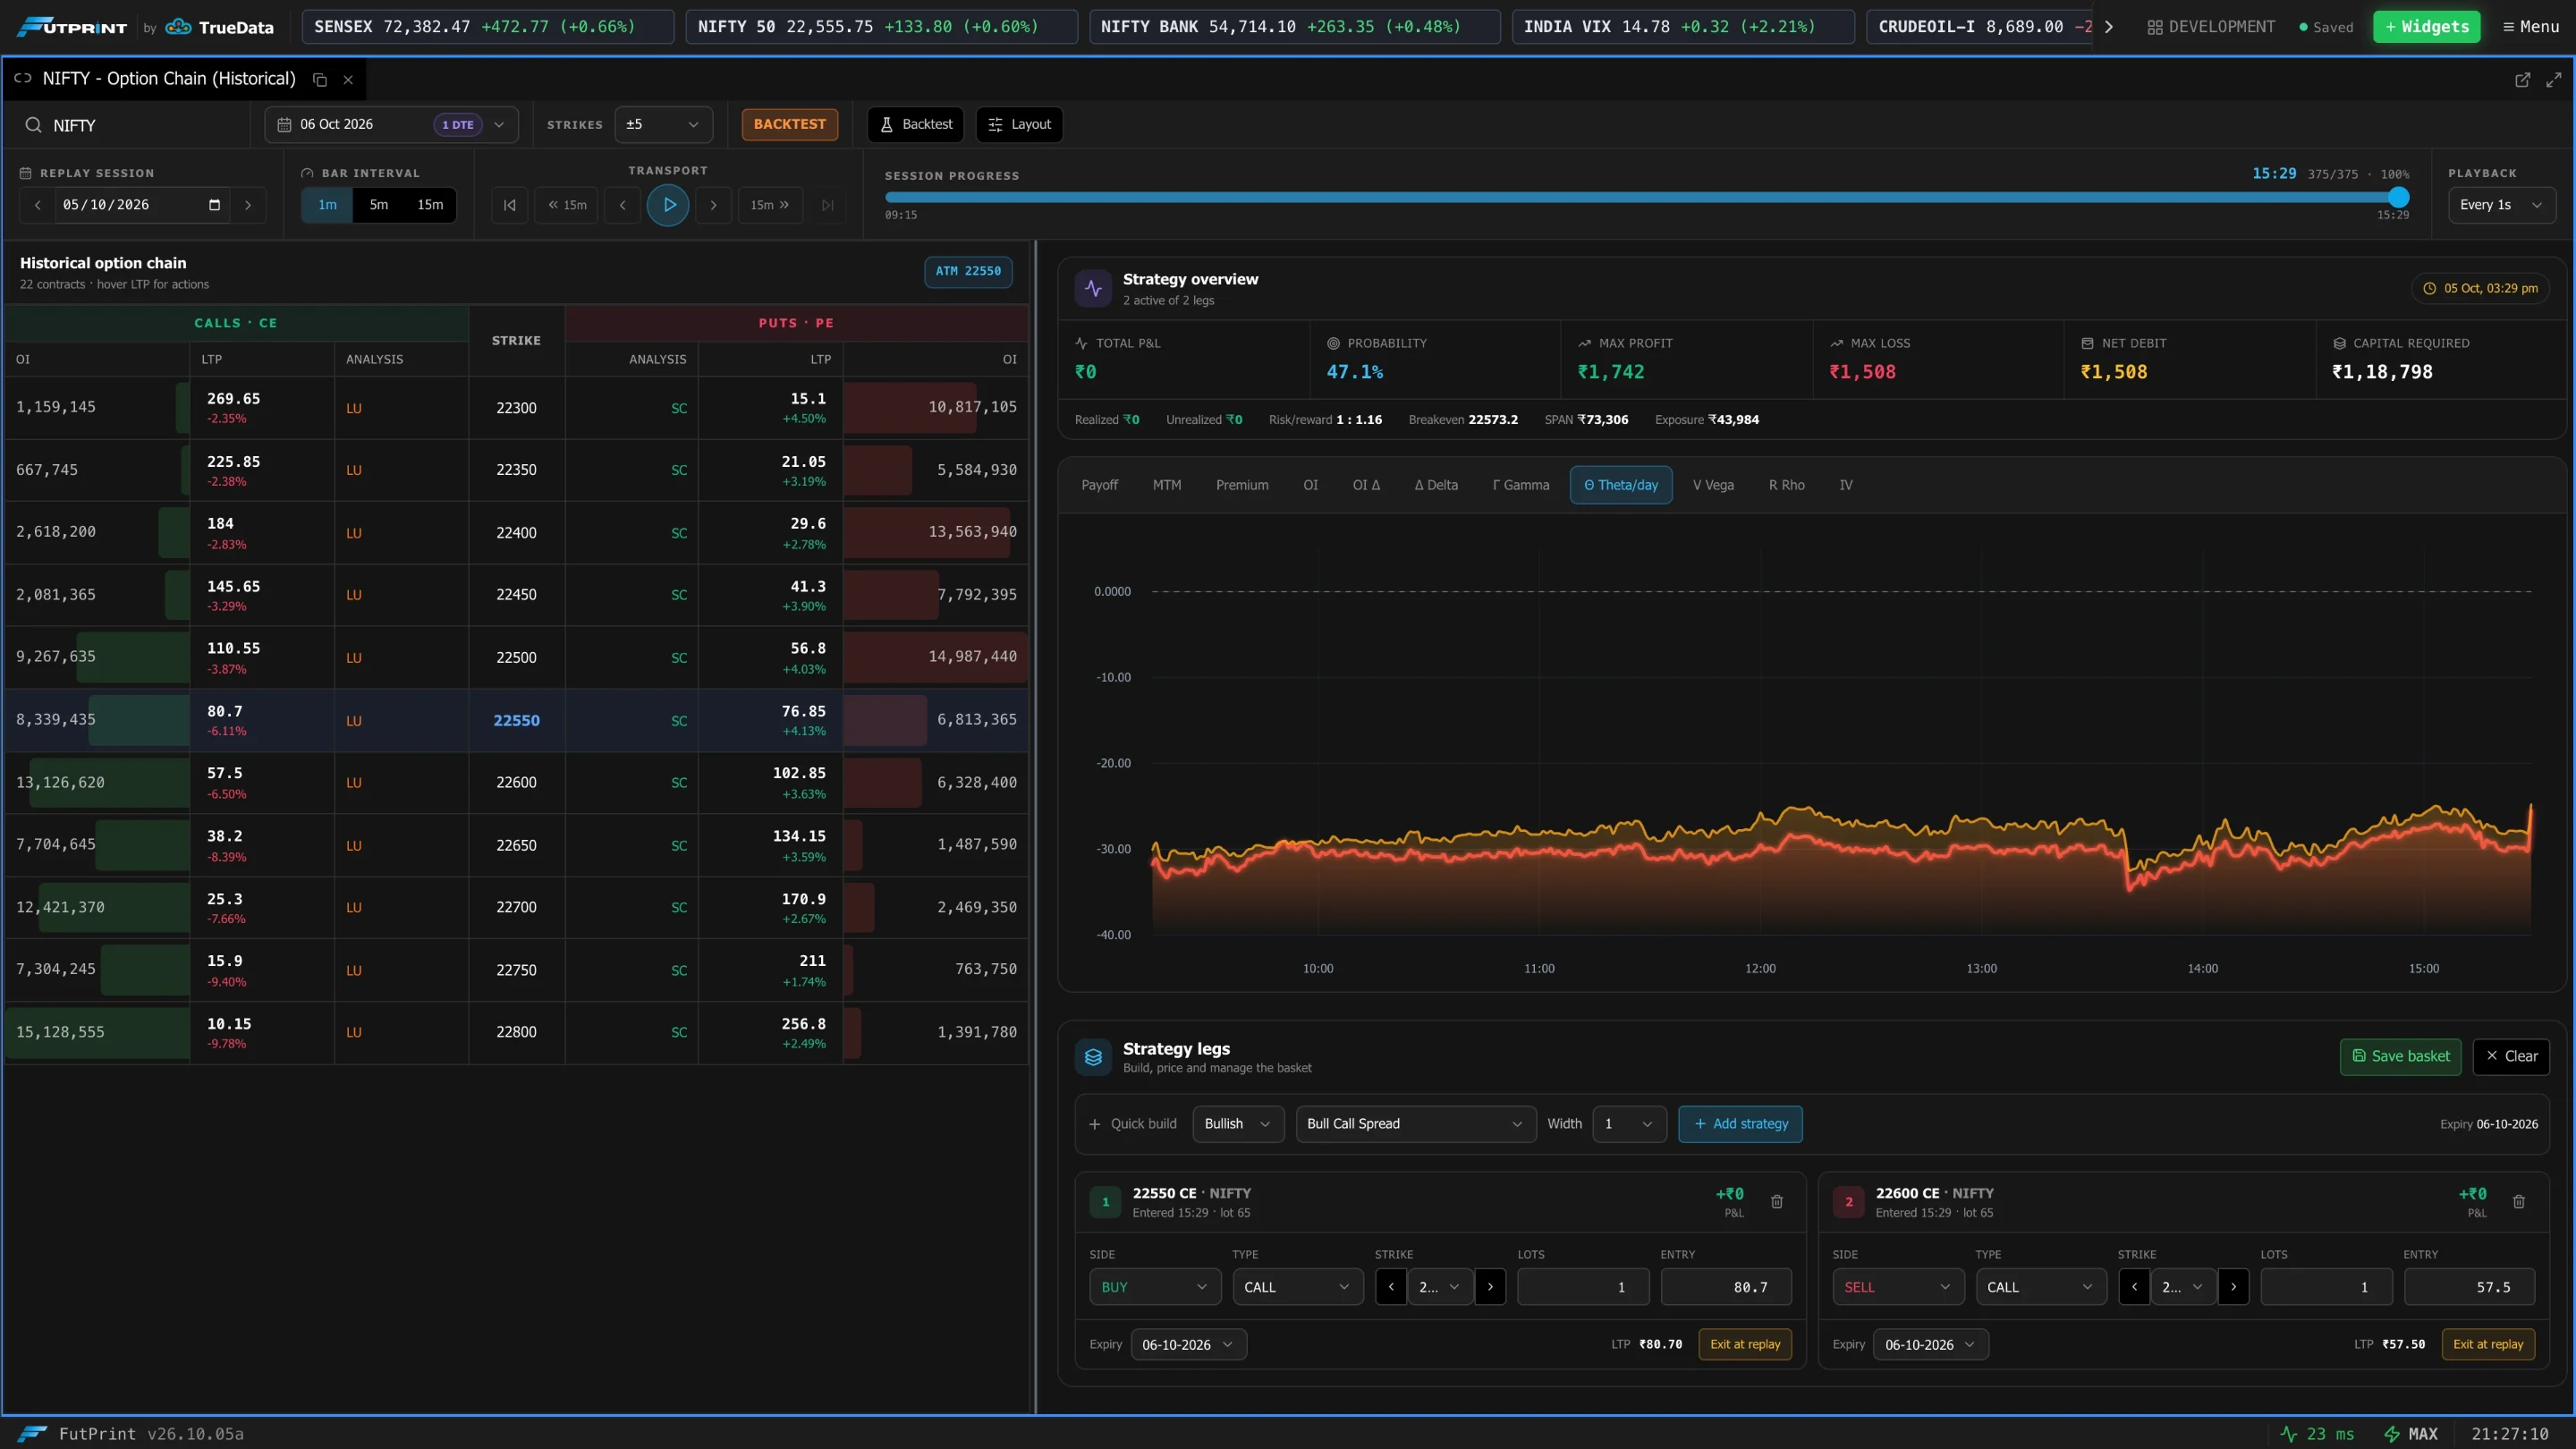
| Δ Delta, Γ Gamma, Θ Theta/day, V Vega, R Rho | The position's greeks through the session. |
| IV | Implied volatility of the legs. |
Backtester
Backtest opens a rule-based backtest of the strategy over a date range. Set the legs relative to ATM, the Entry and Square-off times, the bar Interval, the From / To dates, optional per-leg and MTM stop-loss and target, trailing, Re-entry, and costs (Brkg ₹ and Slip %), then press Run Backtest. Results show net P&L, win rate, profit factor, expectancy per day, maximum drawdown, Sharpe, days traded and costs paid, with an equity curve, daily P&L and a per-day table. Trades CSV downloads the trades.
Days for which the historical contracts cannot be loaded are skipped and listed with the reason, and are excluded from every statistic. Check the number of days actually traded before reading the results.