Chart — Settings
The Settings button in the toolbar (or Ctrl/Cmd S) opens the chart's configuration. Everything you change here applies to the chart you're working in and is saved with it in your workspace.
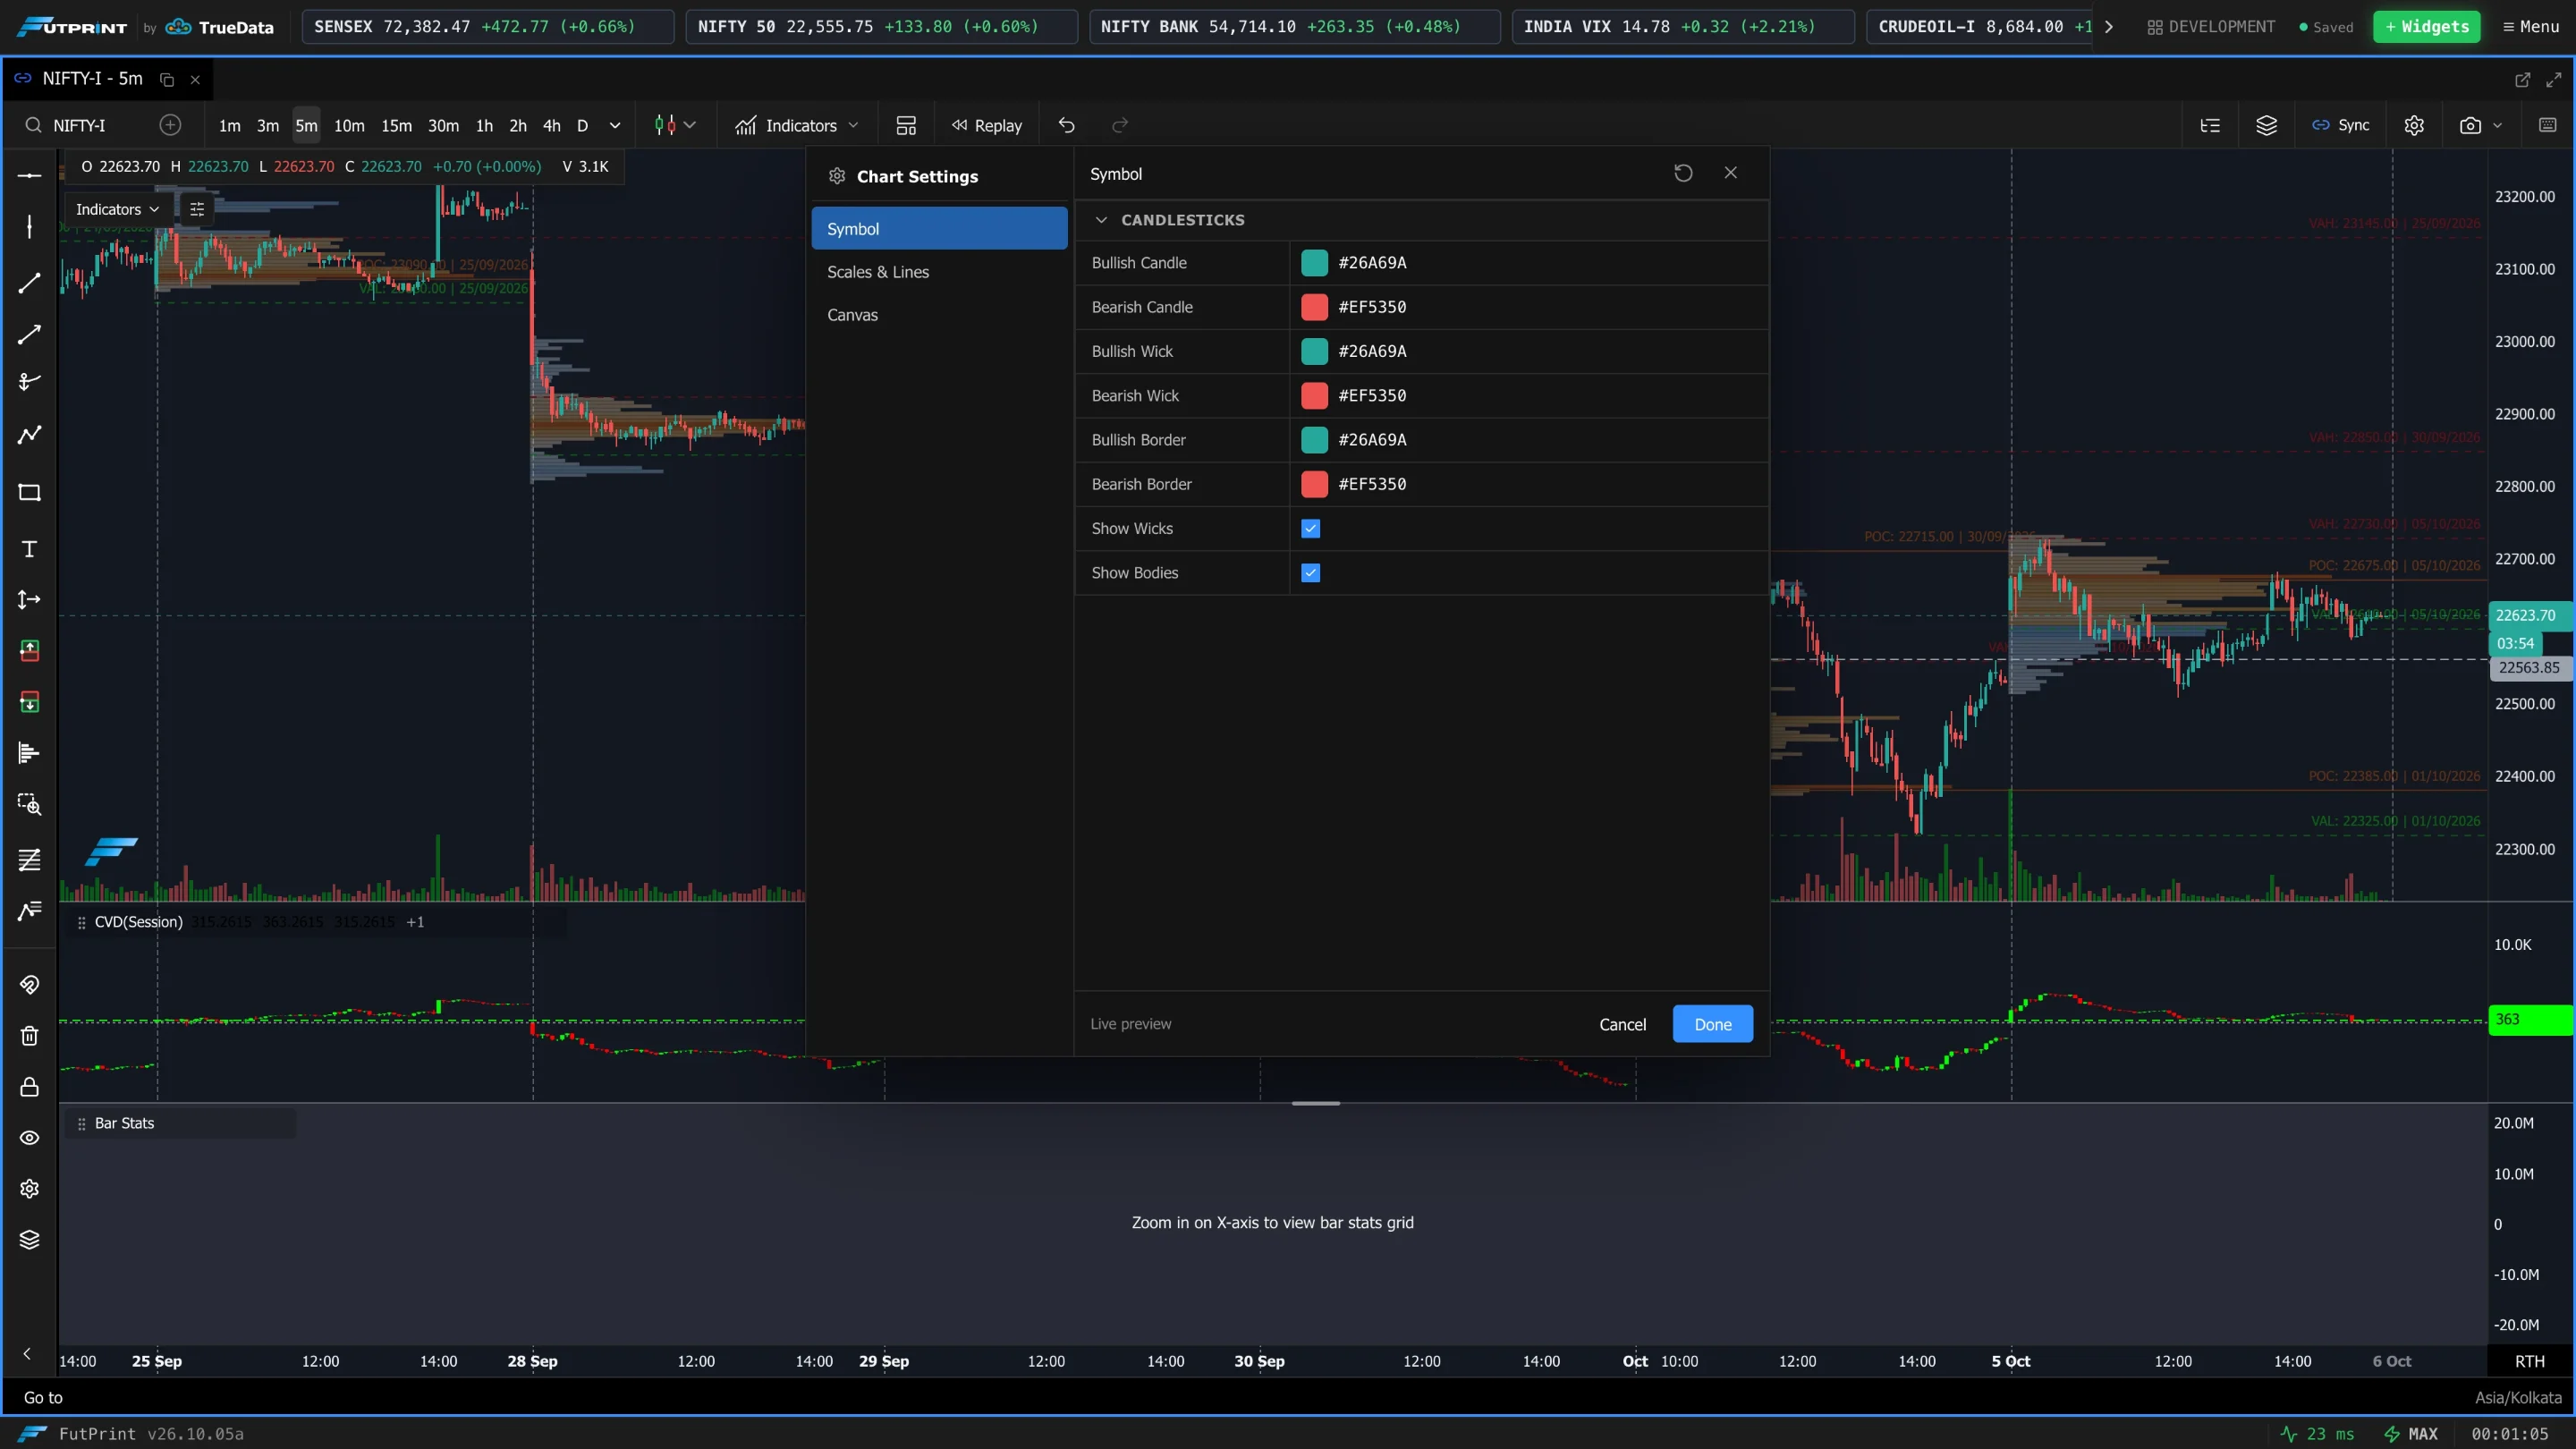
How the dialog is organised
Settings are grouped into tabs. Three tabs are always present, and a fourth appears that matches the current chart mode:
| Tab | Always shown? | Covers |
|---|---|---|
| Symbol | Yes | The price series itself — candle colours, wicks, bodies. |
| Scales & Lines | Yes | Price/time axis behaviour, the last-price line, crosshair snapping, panning and zoom. |
| Canvas | Yes | Background, crosshair colours, grid and day separators. |
| Footprint | Only in Clusters/Footprint mode | The full order-flow configuration → Footprint / Cluster Settings. |
| TPO | Only in TPO mode | The time-price-opportunity profile → TPO Profile Settings. |
When you switch the chart to Clusters (Footprint) or TPO, the dialog jumps to that mode's tab automatically. Each tab is divided into collapsible categories so long lists stay manageable — click a category heading to fold it.
Got a chart configured exactly how you like it? Save the whole setup — type, indicators, colours and settings — with the Templates Manager in the toolbar and apply it to any other chart in one click.
Symbol tab
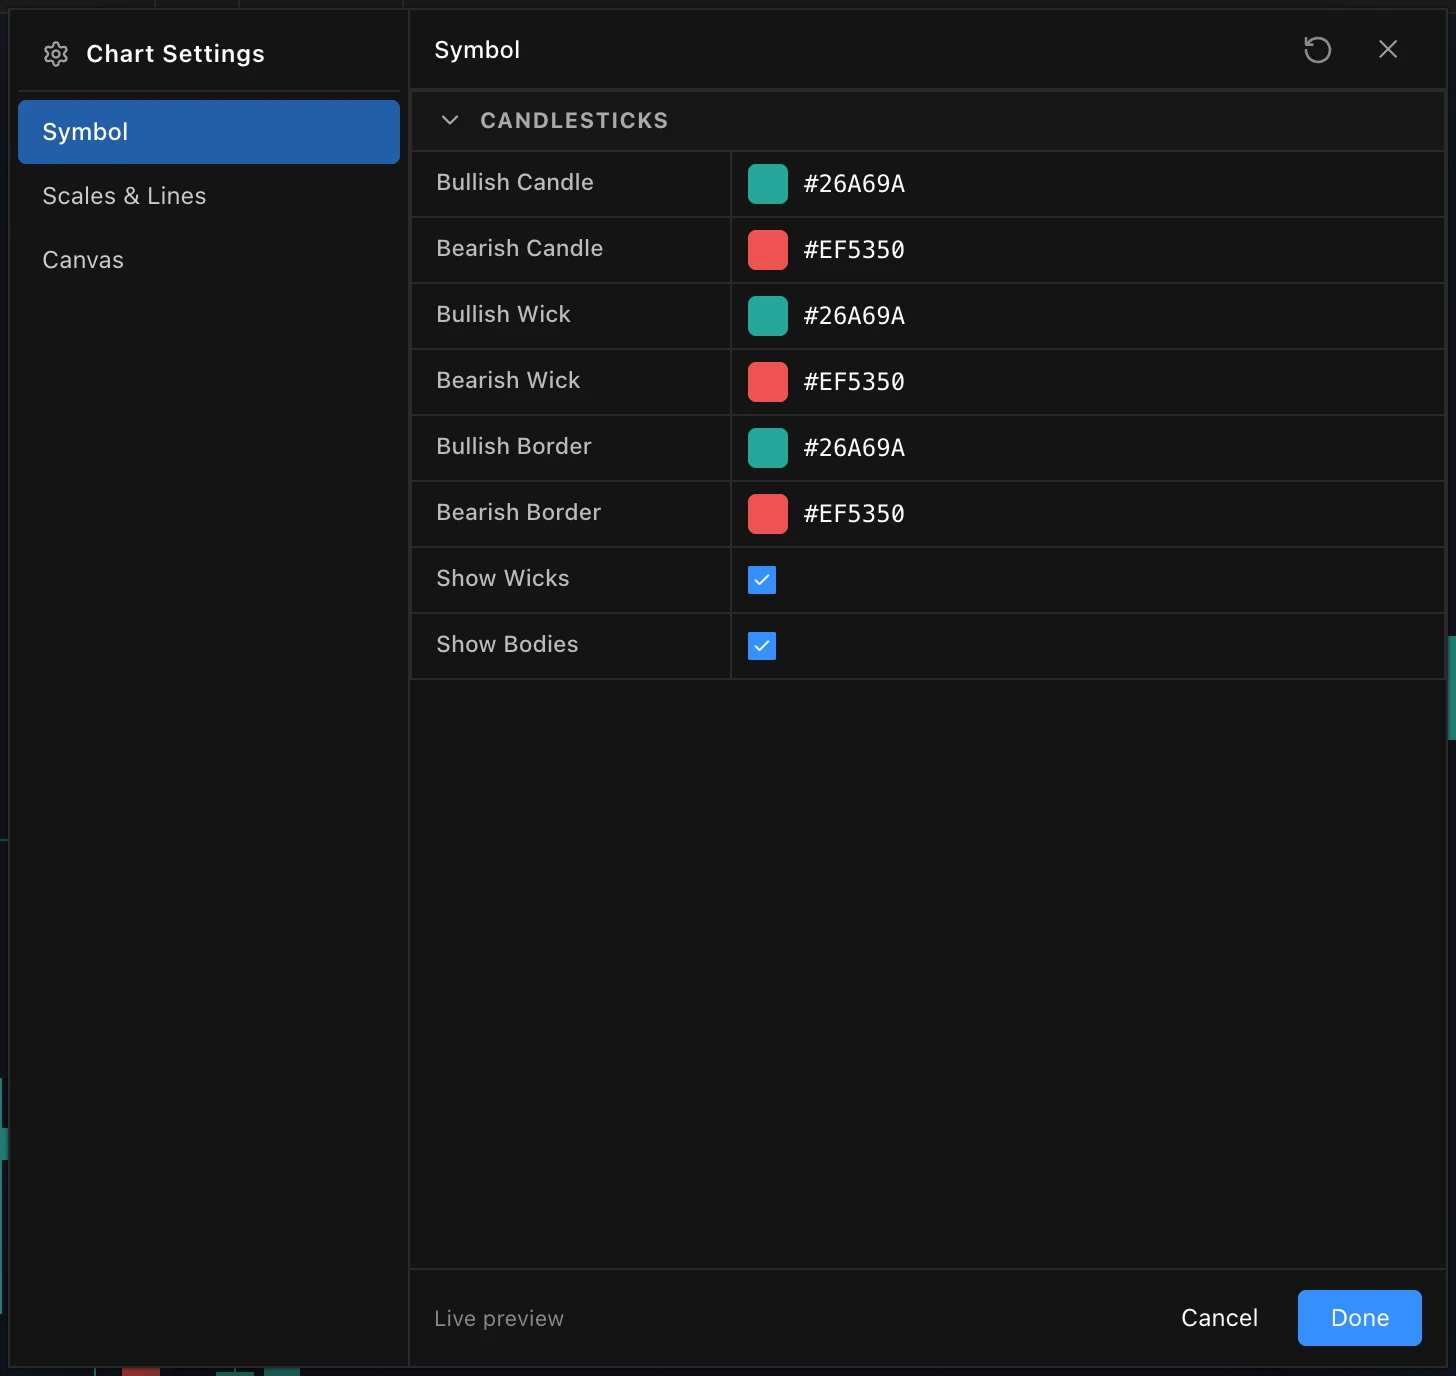
Controls the appearance of the price candles.
| Setting | What it does |
|---|---|
| Bullish Candle | Colour of up candles (close above open). |
| Bearish Candle | Colour of down candles (close below open). |
| Bullish Wick | Colour of the wicks (high/low shadows) on up candles. |
| Bearish Wick | Colour of the wicks on down candles. |
| Bullish Border | Outline colour of up-candle bodies. |
| Bearish Border | Outline colour of down-candle bodies. |
| Show Wicks | Toggle the high/low shadows. Off = bodies only, for a cleaner look. |
| Show Bodies | Toggle the open/close bodies. Off = wicks only, for a line-like look. |
Scales & Lines tab
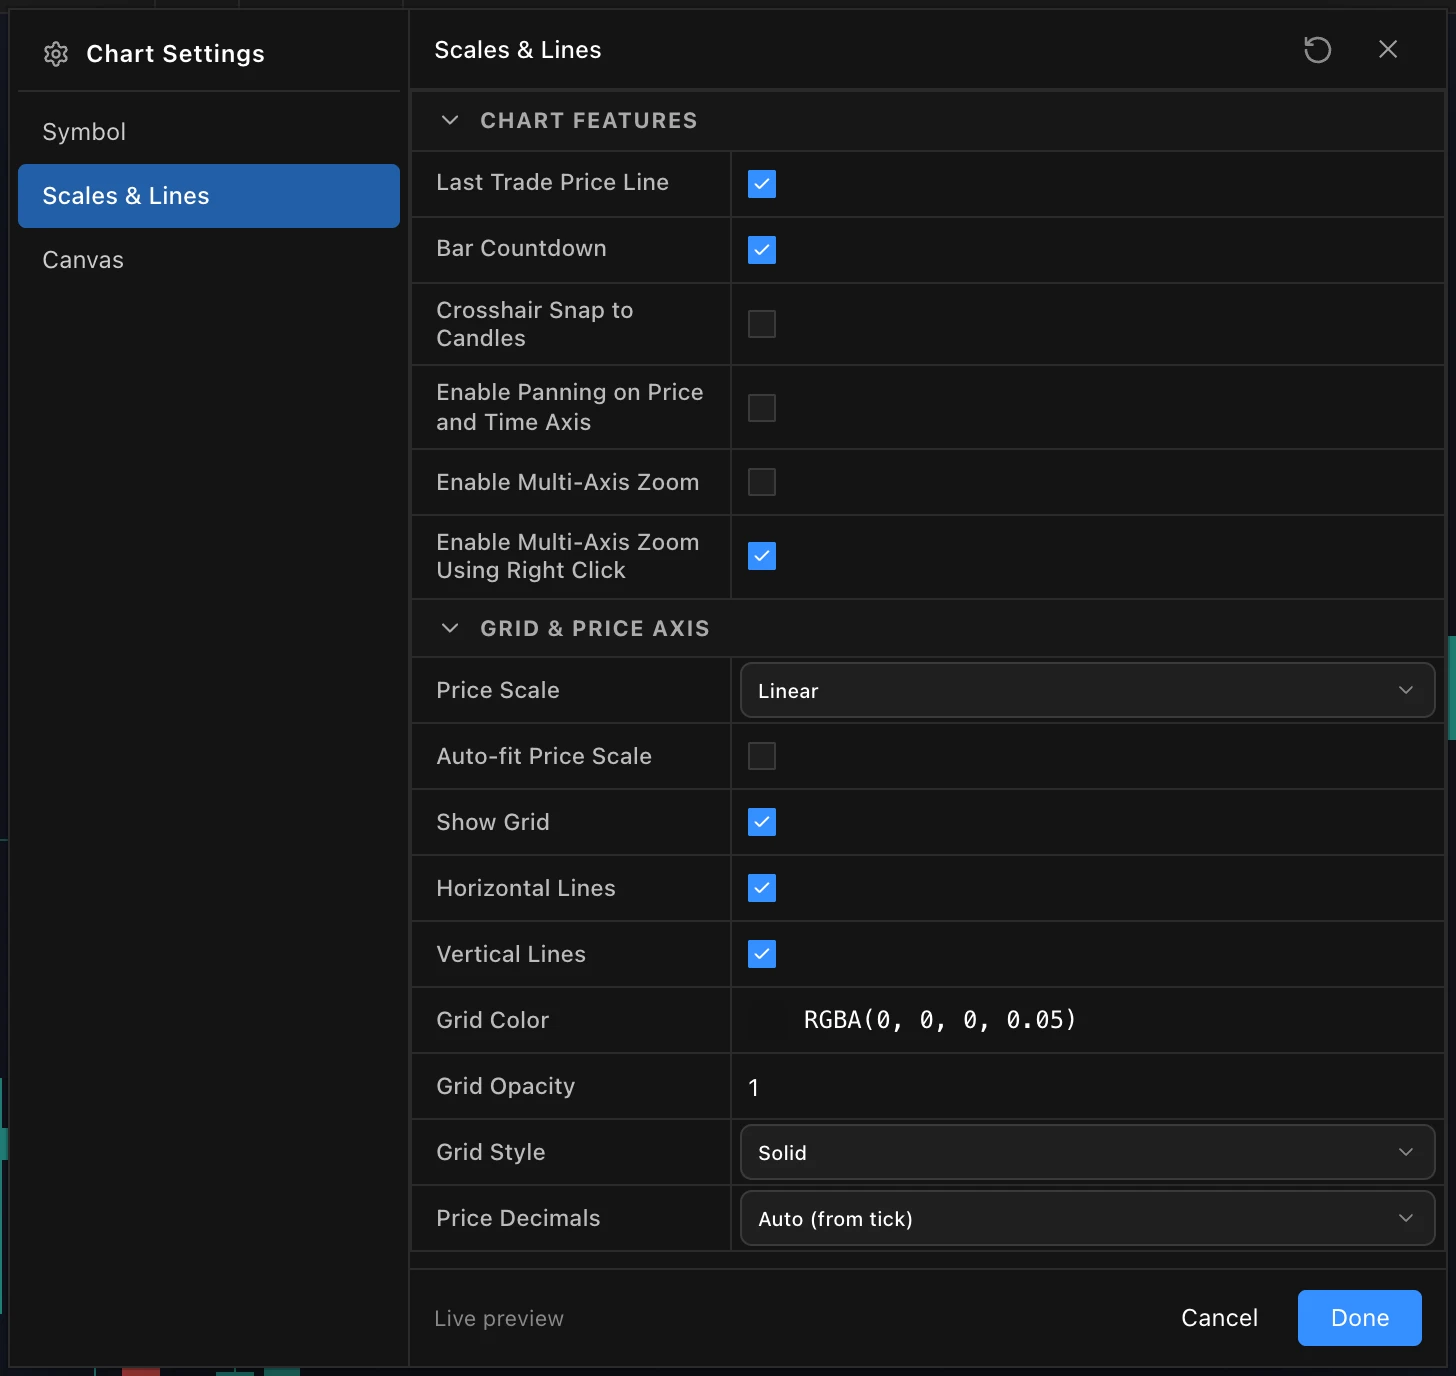
Controls axis interaction and a few on-chart aids.
| Setting | What it does |
|---|---|
| Last Trade Price Line | Draws a horizontal line at the most recent trade price; updates live as a reference for entries/exits. |
| Bar Countdown | Shows a timer counting down to when the current time-based bar closes — useful for timing around bar closures. |
| Crosshair Snap to Candles | Snaps the crosshair to the nearest candle instead of moving smoothly, for precise reads on specific bars. |
| Enable Panning on Price and Time Axis | Allows dragging the price and time axes to pan. |
| Enable Multi-Axis Zoom | Allows zooming the price and time axes independently. |
| Enable Multi-Axis Zoom Using Right Click | Enables the right-click drag gesture for multi-axis zoom. |
Canvas tab
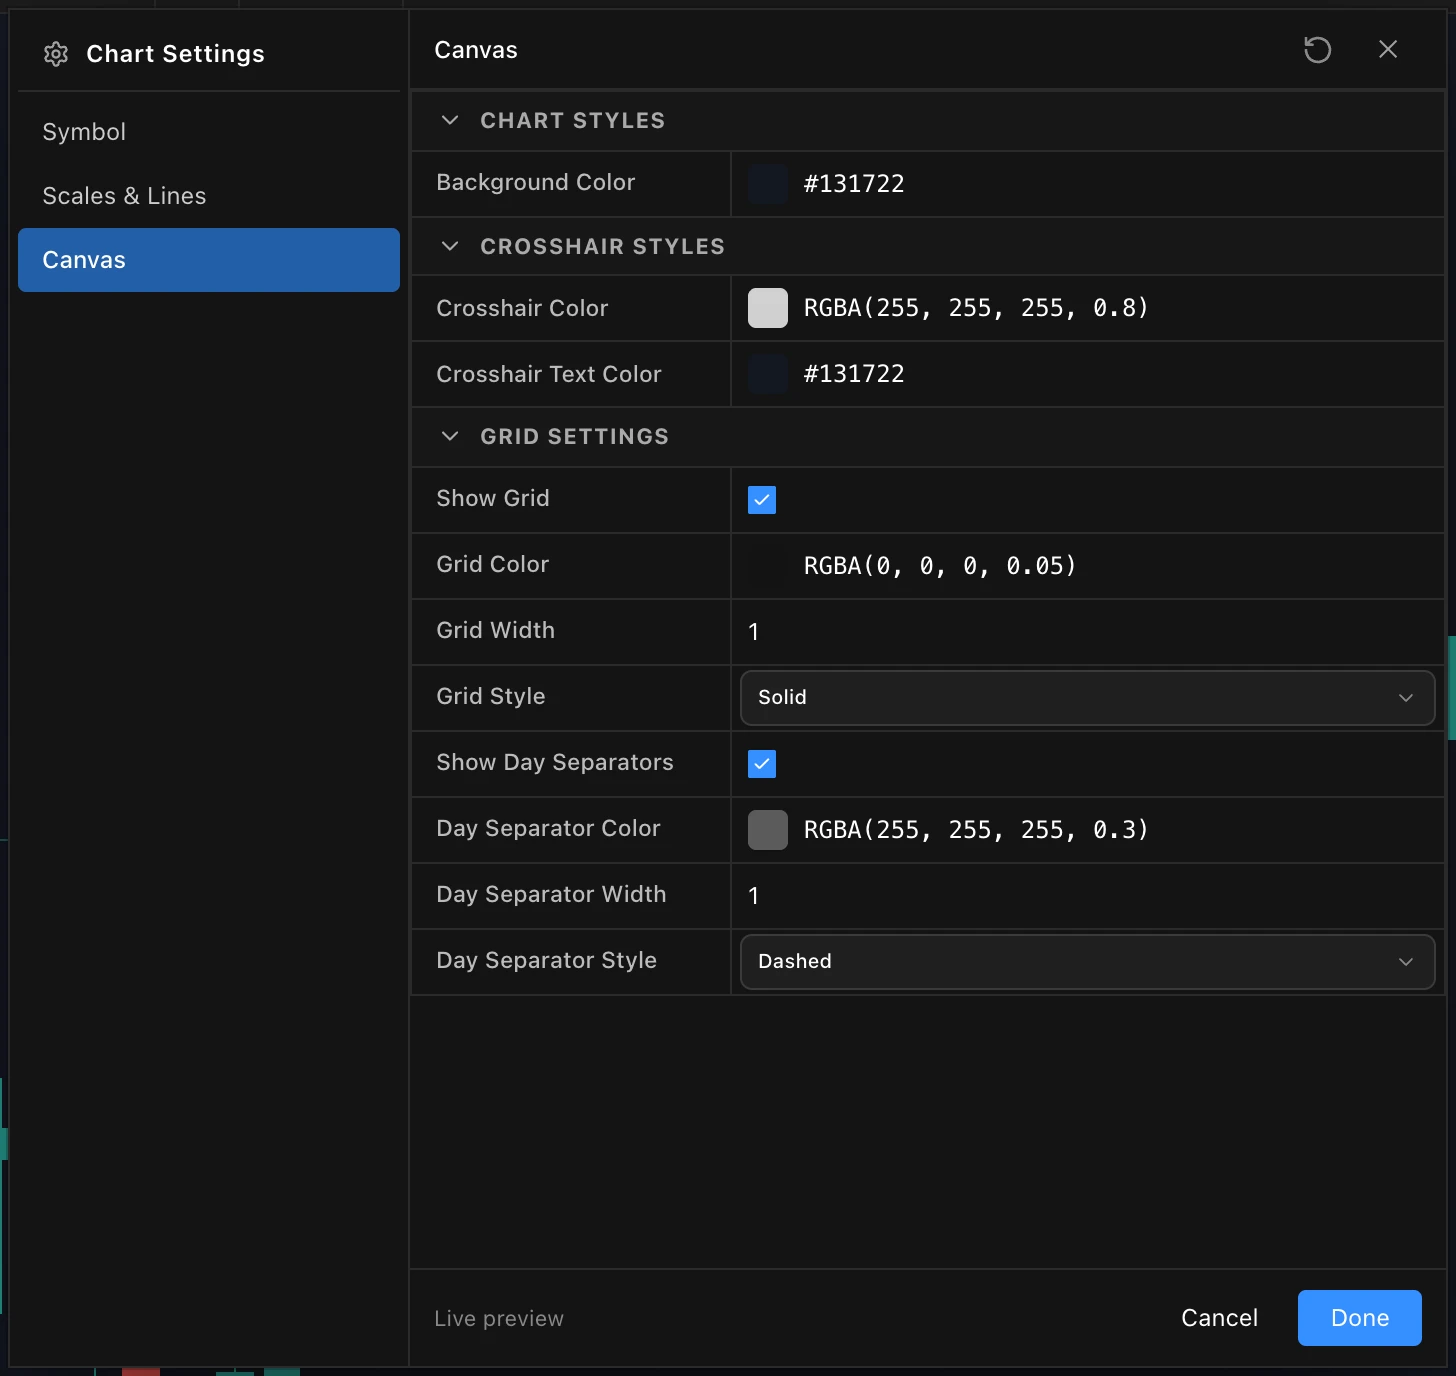
Controls the chart surface — background, crosshair and the two line grids.
Background & crosshair
| Setting | What it does |
|---|---|
| Background Color | The chart area background. Darker tones suit long sessions. |
| Crosshair Color | Colour of the crosshair lines (use some transparency for visibility over data). |
| Crosshair Text Color | Colour of the price/time labels the crosshair shows. |
Grid
| Setting | What it does |
|---|---|
| Show Grid | Toggle the horizontal/vertical reference grid. |
| Grid Color | Grid line colour — keep it subtle so it doesn't fight the price action. |
| Grid Width | Grid line thickness. |
| Grid Style | Solid, Dashed or Dotted. |
Day separators
| Setting | What it does |
|---|---|
| Show Day Separators | Vertical lines marking the boundary between trading days — handy for reading intraday structure and sessions. |
| Day Separator Color | Their colour. |
| Day Separator Width | Their thickness. |
| Day Separator Style | Solid, Dashed or Dotted. |
Mode-specific settings
The order-flow and profile modes have extensive configuration of their own — documented on dedicated pages:
- Footprint / Cluster Settings — bin sizing, display style, data types, colour grading, POC/vPOC, value area, candle statistics, delta divergence, Big Trades and imbalances.
- TPO Profile Settings — anchoring, value area, single prints, initial balance, colouring modes and POC/VA lines.