Advanced features built for every trader
From professional charting and order flow to options analytics, replay and smart alerts — explore the full toolkit, organised by what you trade.
FutPrint is a cloud-based order flow charting platform built for Indian futures and options traders. It combines a professional charting engine with a complete order flow toolkit, a multi-panel workspace and a dedicated options module covering the NSE and BSE. Pick a capability below to dive in.
Built for everyone, everywhere
Sub-50ms data
Institutional TrueData feed, near real-time.
Runs in the browser
No install — desktop, laptop, multi-monitor.
100k+ instruments
NSE + BSE F&O, equities and indices.
Secure cloud sync
Layouts and templates saved to your account.
Four capabilities, one terminal
A quick tour of what each module does — open any of them for the full breakdown.
A charting engine built for speed and depth
Everything you need to read price, on a WebGL canvas that stays smooth on the busiest expiry days.
- 9 chart types incl. Footprint & TPO
- Tick, range and fully custom bars
- Full drawing & indicator toolkit
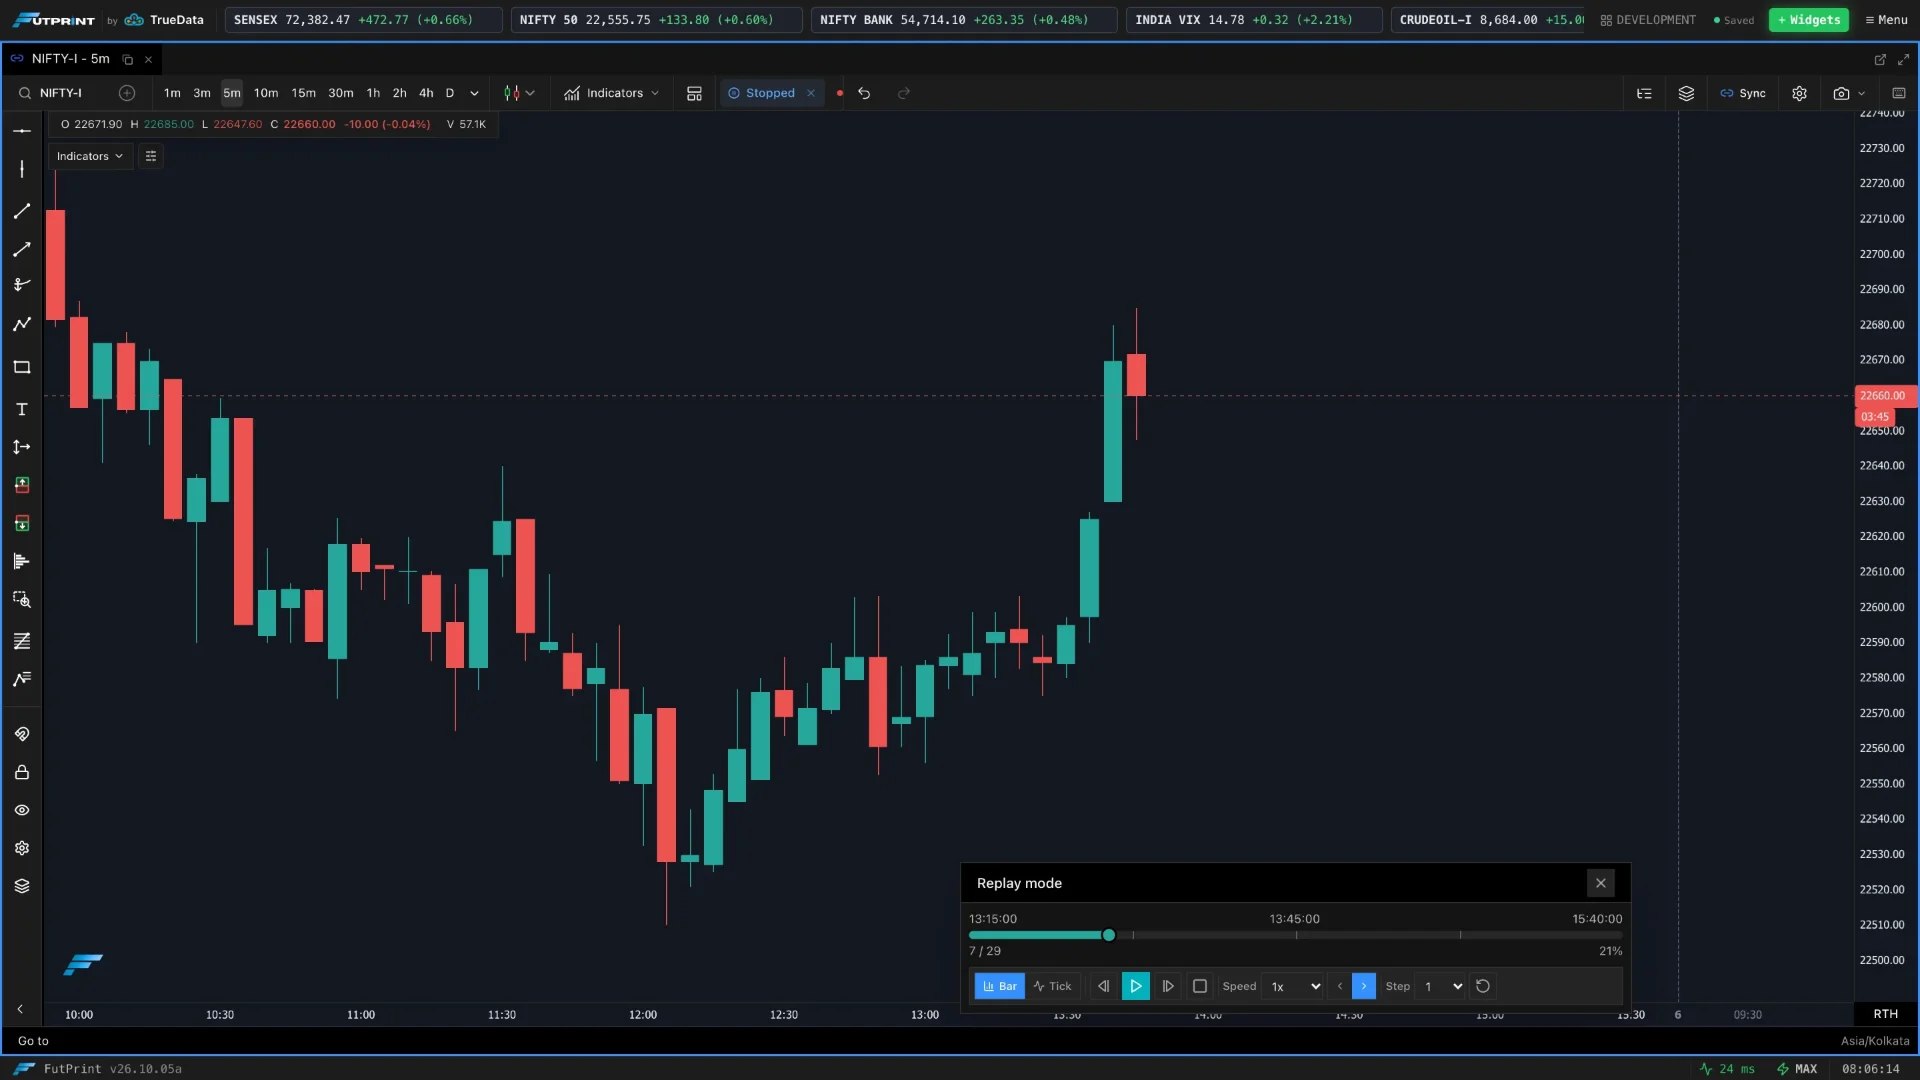
- Tick-by-tick and bar replay
- Multi-axis price & time scales
- Cloud-saved charts & smart alerts

See aggression and absorption as it prints
FutPrint exposes the market's microstructure — footprint, profiles, delta and the tape — so you act on what's happening, not what already happened.
- Footprint / cluster charts
- Delta and cumulative delta (CVD)
- Imbalance & absorption zones
- Volume profile (POC / VAH / VAL)
- Market profile (TPO) letters
- VWAP and time & sales tape

Read the chain and backtest the idea
From open-interest buildup to a full strategy backtester — built for Indian index and stock options.
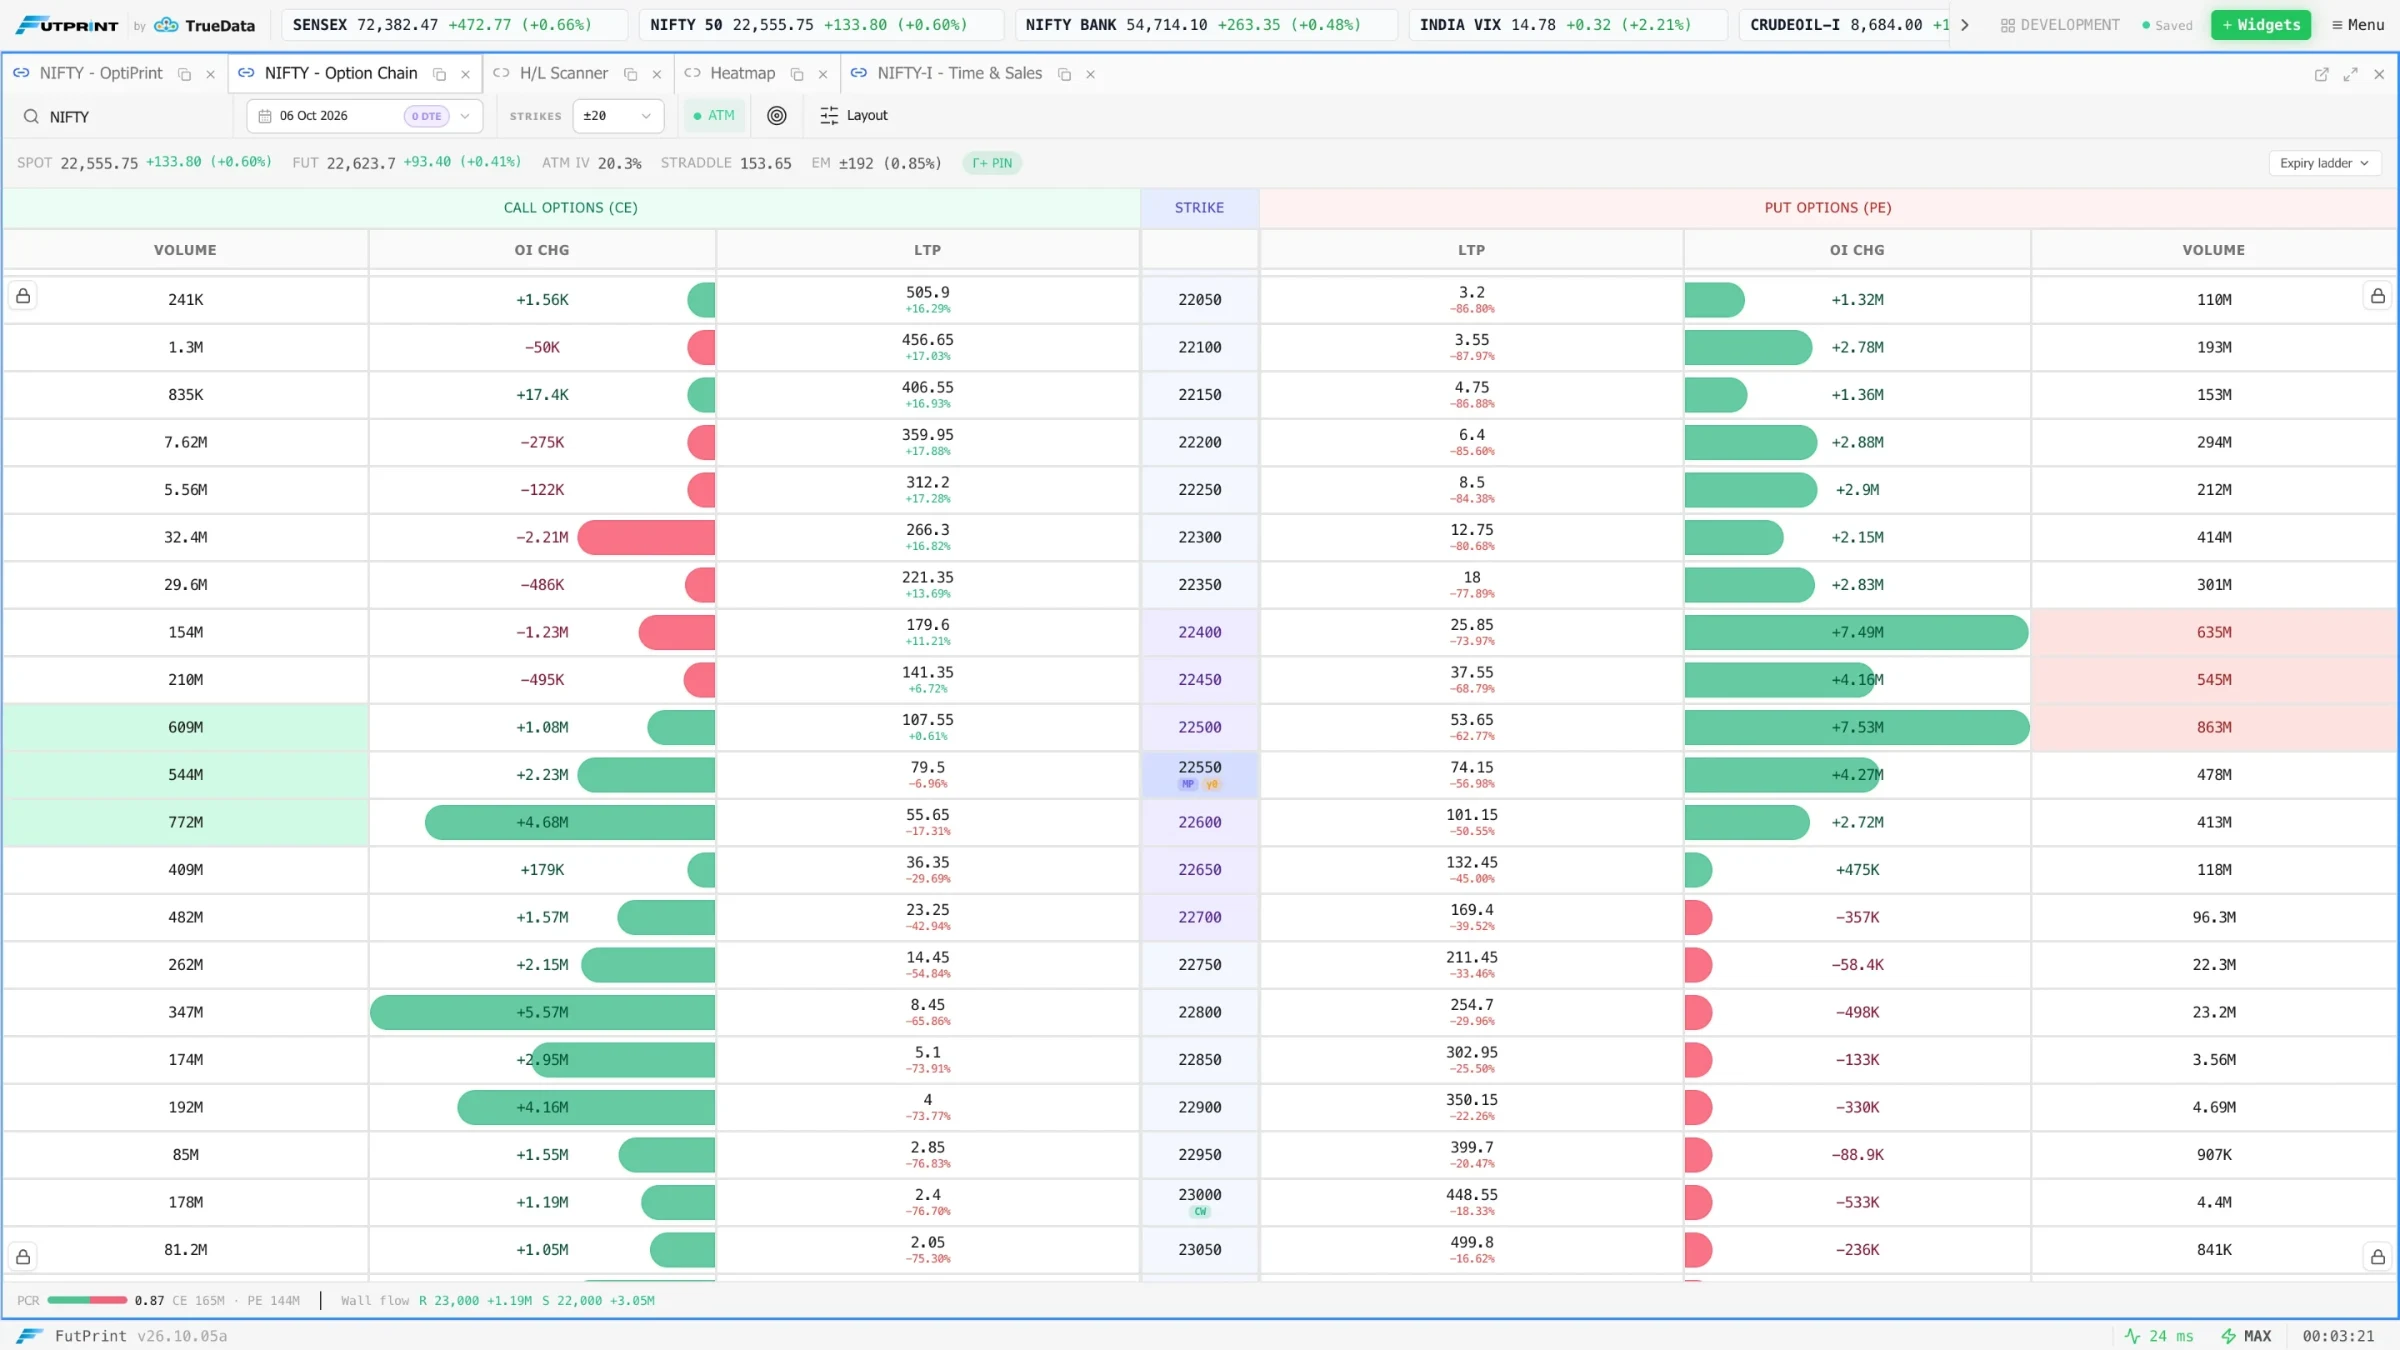
- Option chain with OI buildup
- PCR and OI change analysis
- Live straddle & strangle charts
- Multi-leg strategy backtester
- Greeks at a glance
- Instant search across every expiry

One docked workspace, your way
Arrange charts, tape, watchlists and the option chain across monitors — then save it and pick up anywhere.
- Dockable, resizable panels
- Up to 16 chart widgets
- Saved templates & layouts
- Bar-by-bar market replay
- Live time & sales tape
- Light & dark themes

Every chart type and study you reach for
Switch chart type in a click and stack the studies that matter.
Chart types
50+ indicators
- TrendEMA, SMA, VWAP, Supertrend
- MomentumRSI, MACD, Stochastic
- VolatilityBollinger Bands, ATR
- VolumeOBV, Volume, CVD
- Order flowDelta, Imbalance, POC
Never miss a move
Get notified, act instantly — on price, indicators or your own automations.
Price alerts
Cross, above or below any level.
Indicator alerts
Trigger on RSI, MACD, delta and more.
Webhooks
POST to your bot or automation.
Push & email
Get notified wherever you are.
Indices, F&O and equities — one feed
A glimpse of the data powering every chart, profile and alert.
| Symbol | Open | High | Low | LTP | Chg% |
|---|---|---|---|---|---|
| NIFTY | 22,290.10 | 22,455.80 | 22,261.55 | 22,419.95 | +0.62% |
| BANKNIFTY | 48,010.00 | 48,320.45 | 47,955.20 | 48,210.30 | +0.41% |
| SENSEX | 73,440.20 | 73,901.10 | 73,388.70 | 73,852.94 | +0.55% |
| RELIANCE | 2,951.00 | 2,968.40 | 2,938.05 | 2,945.10 | -0.18% |
| INFY | 1,624.00 | 1,649.90 | 1,620.10 | 1,642.85 | +1.12% |
Good to know
See the whole toolkit in action
Open the terminal free and try charting, order flow, profiles and replay in minutes.