Chart — TPO Profile Settings
When the chart is in TPO mode, a TPO tab appears in Chart Settings. TPO (Time-Price-Opportunity) builds a market profile: for each period it stacks a lettered block at every price the market traded, so the shape shows where price spent the most time — the value area, the point of control, and structural features like single prints and poor highs/lows.
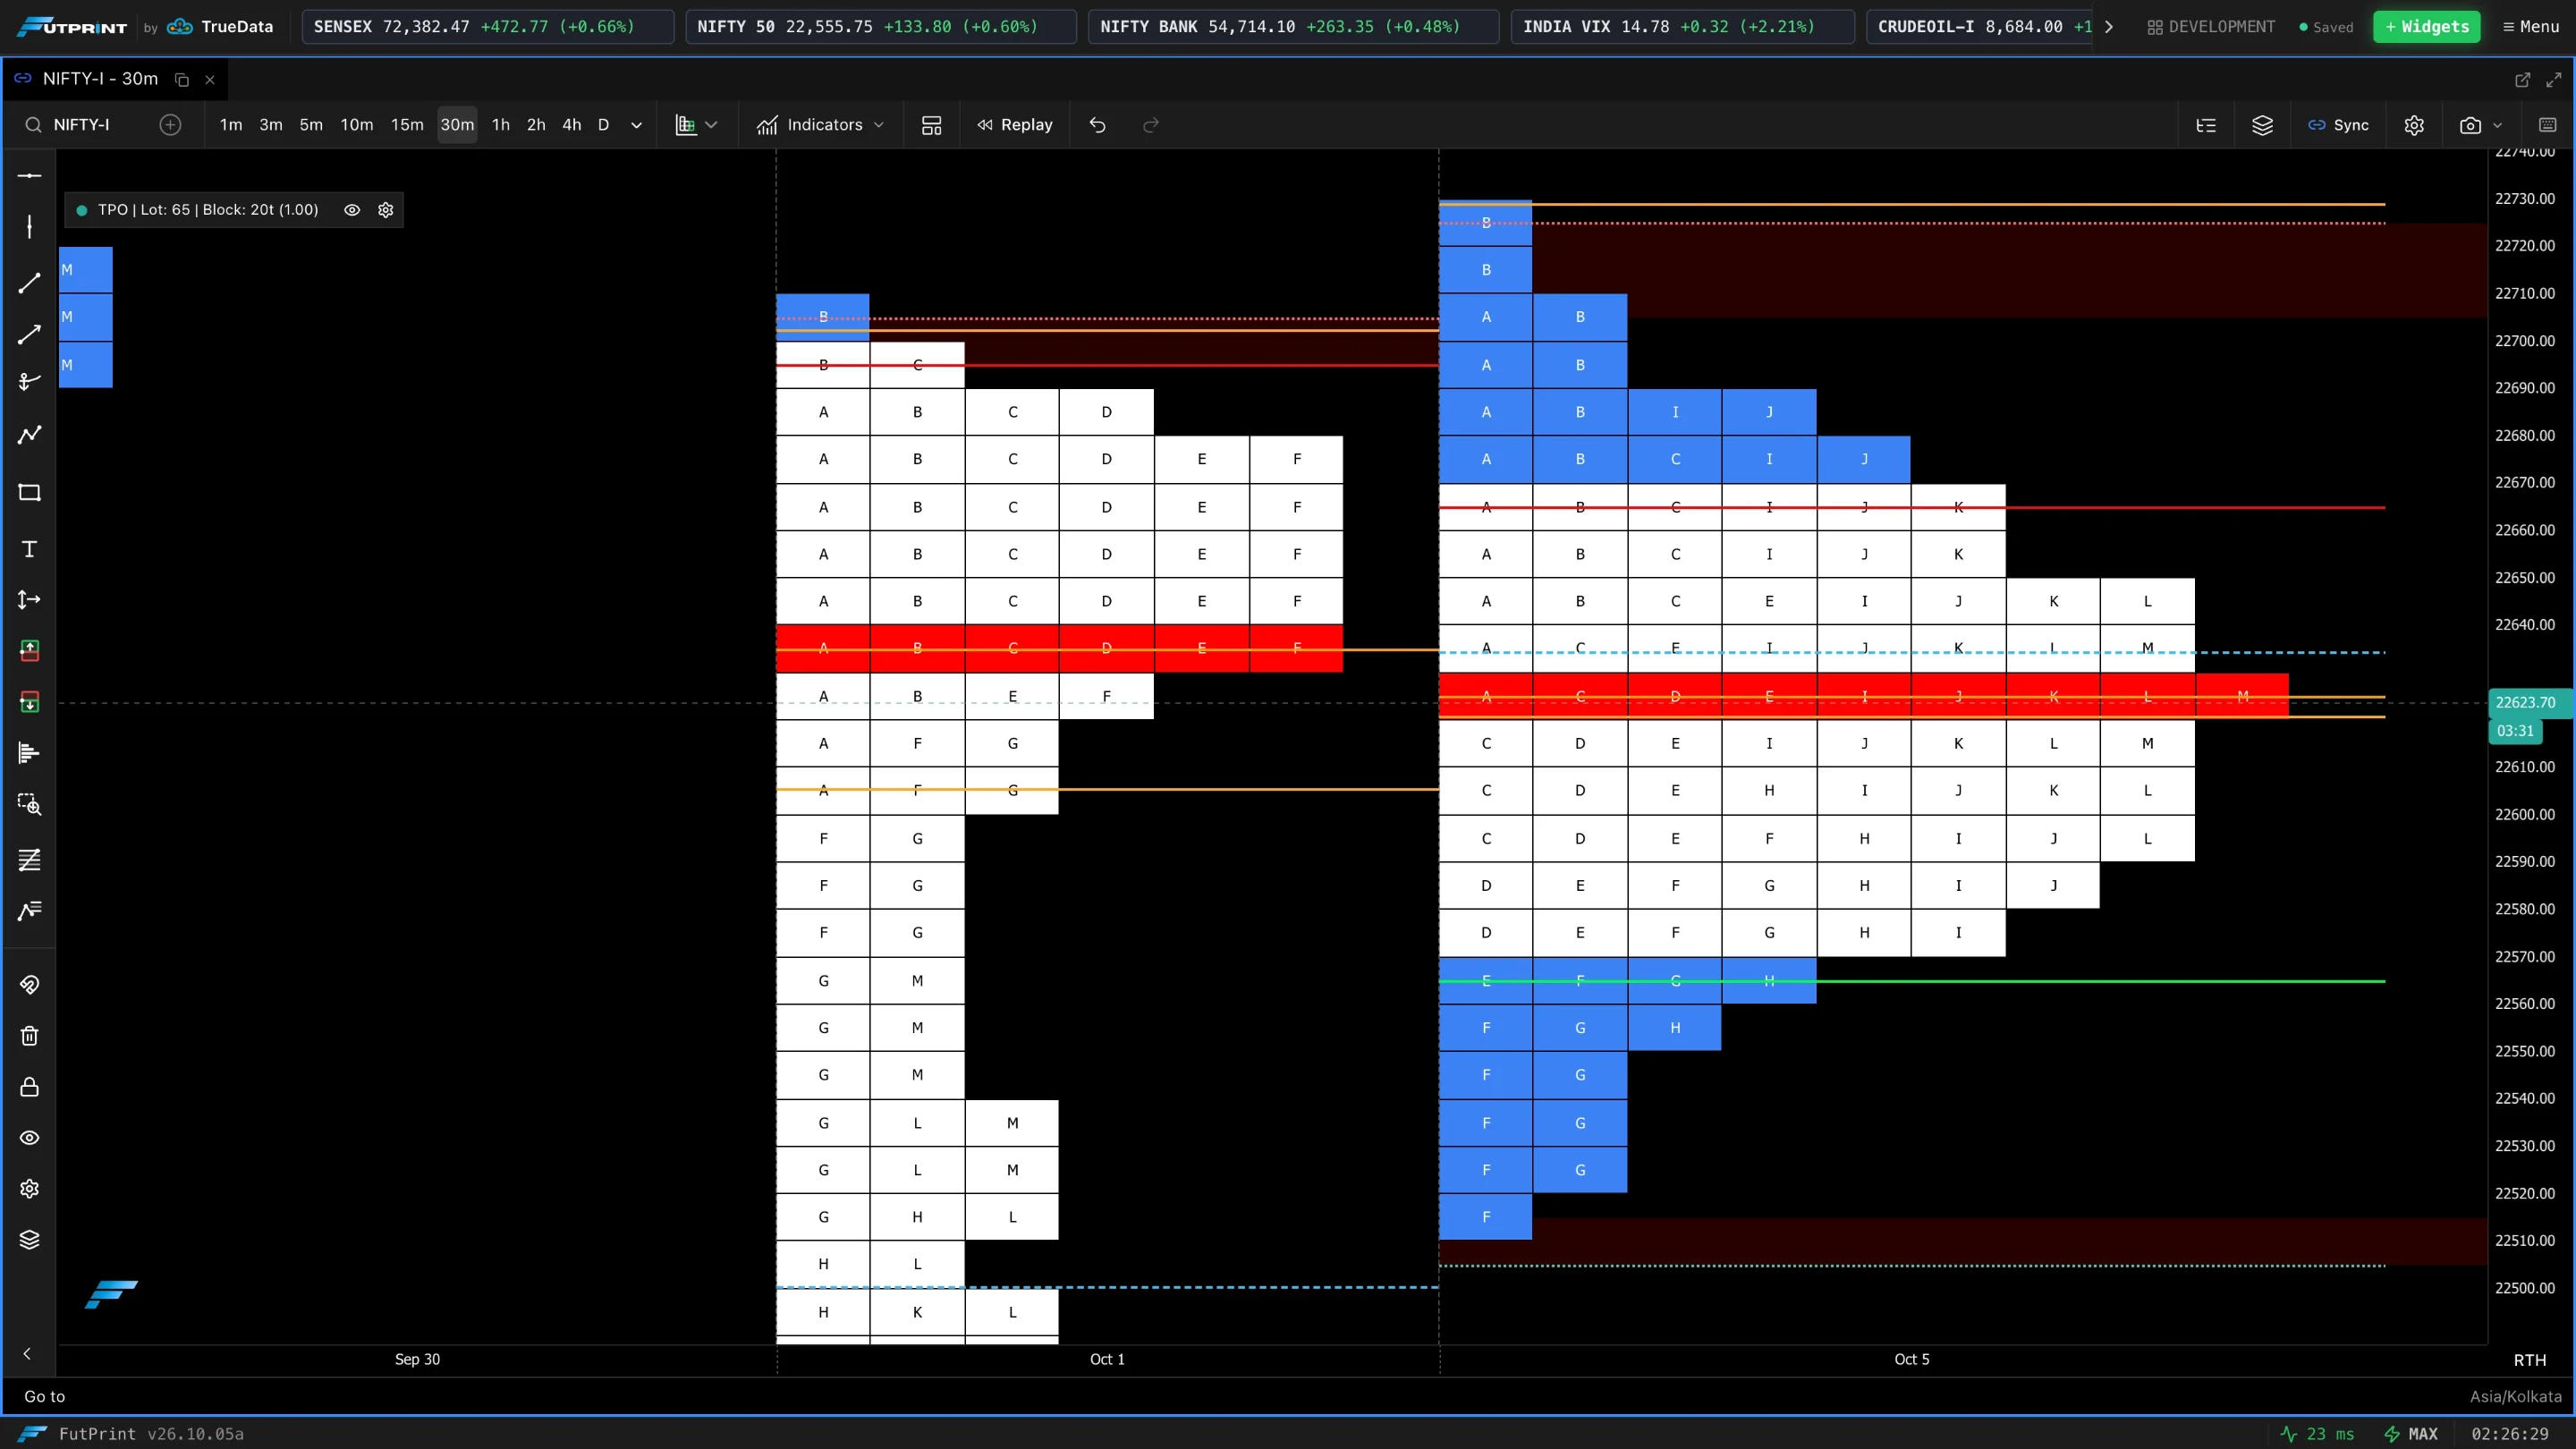
Every screenshot on this page starts from the same clean profile — daily anchor, 30-minute letters, 200-tick bins, every marker and line off — and changes only the setting being described. Use the Dark / Light switch above any image, and click an image to open it full size.
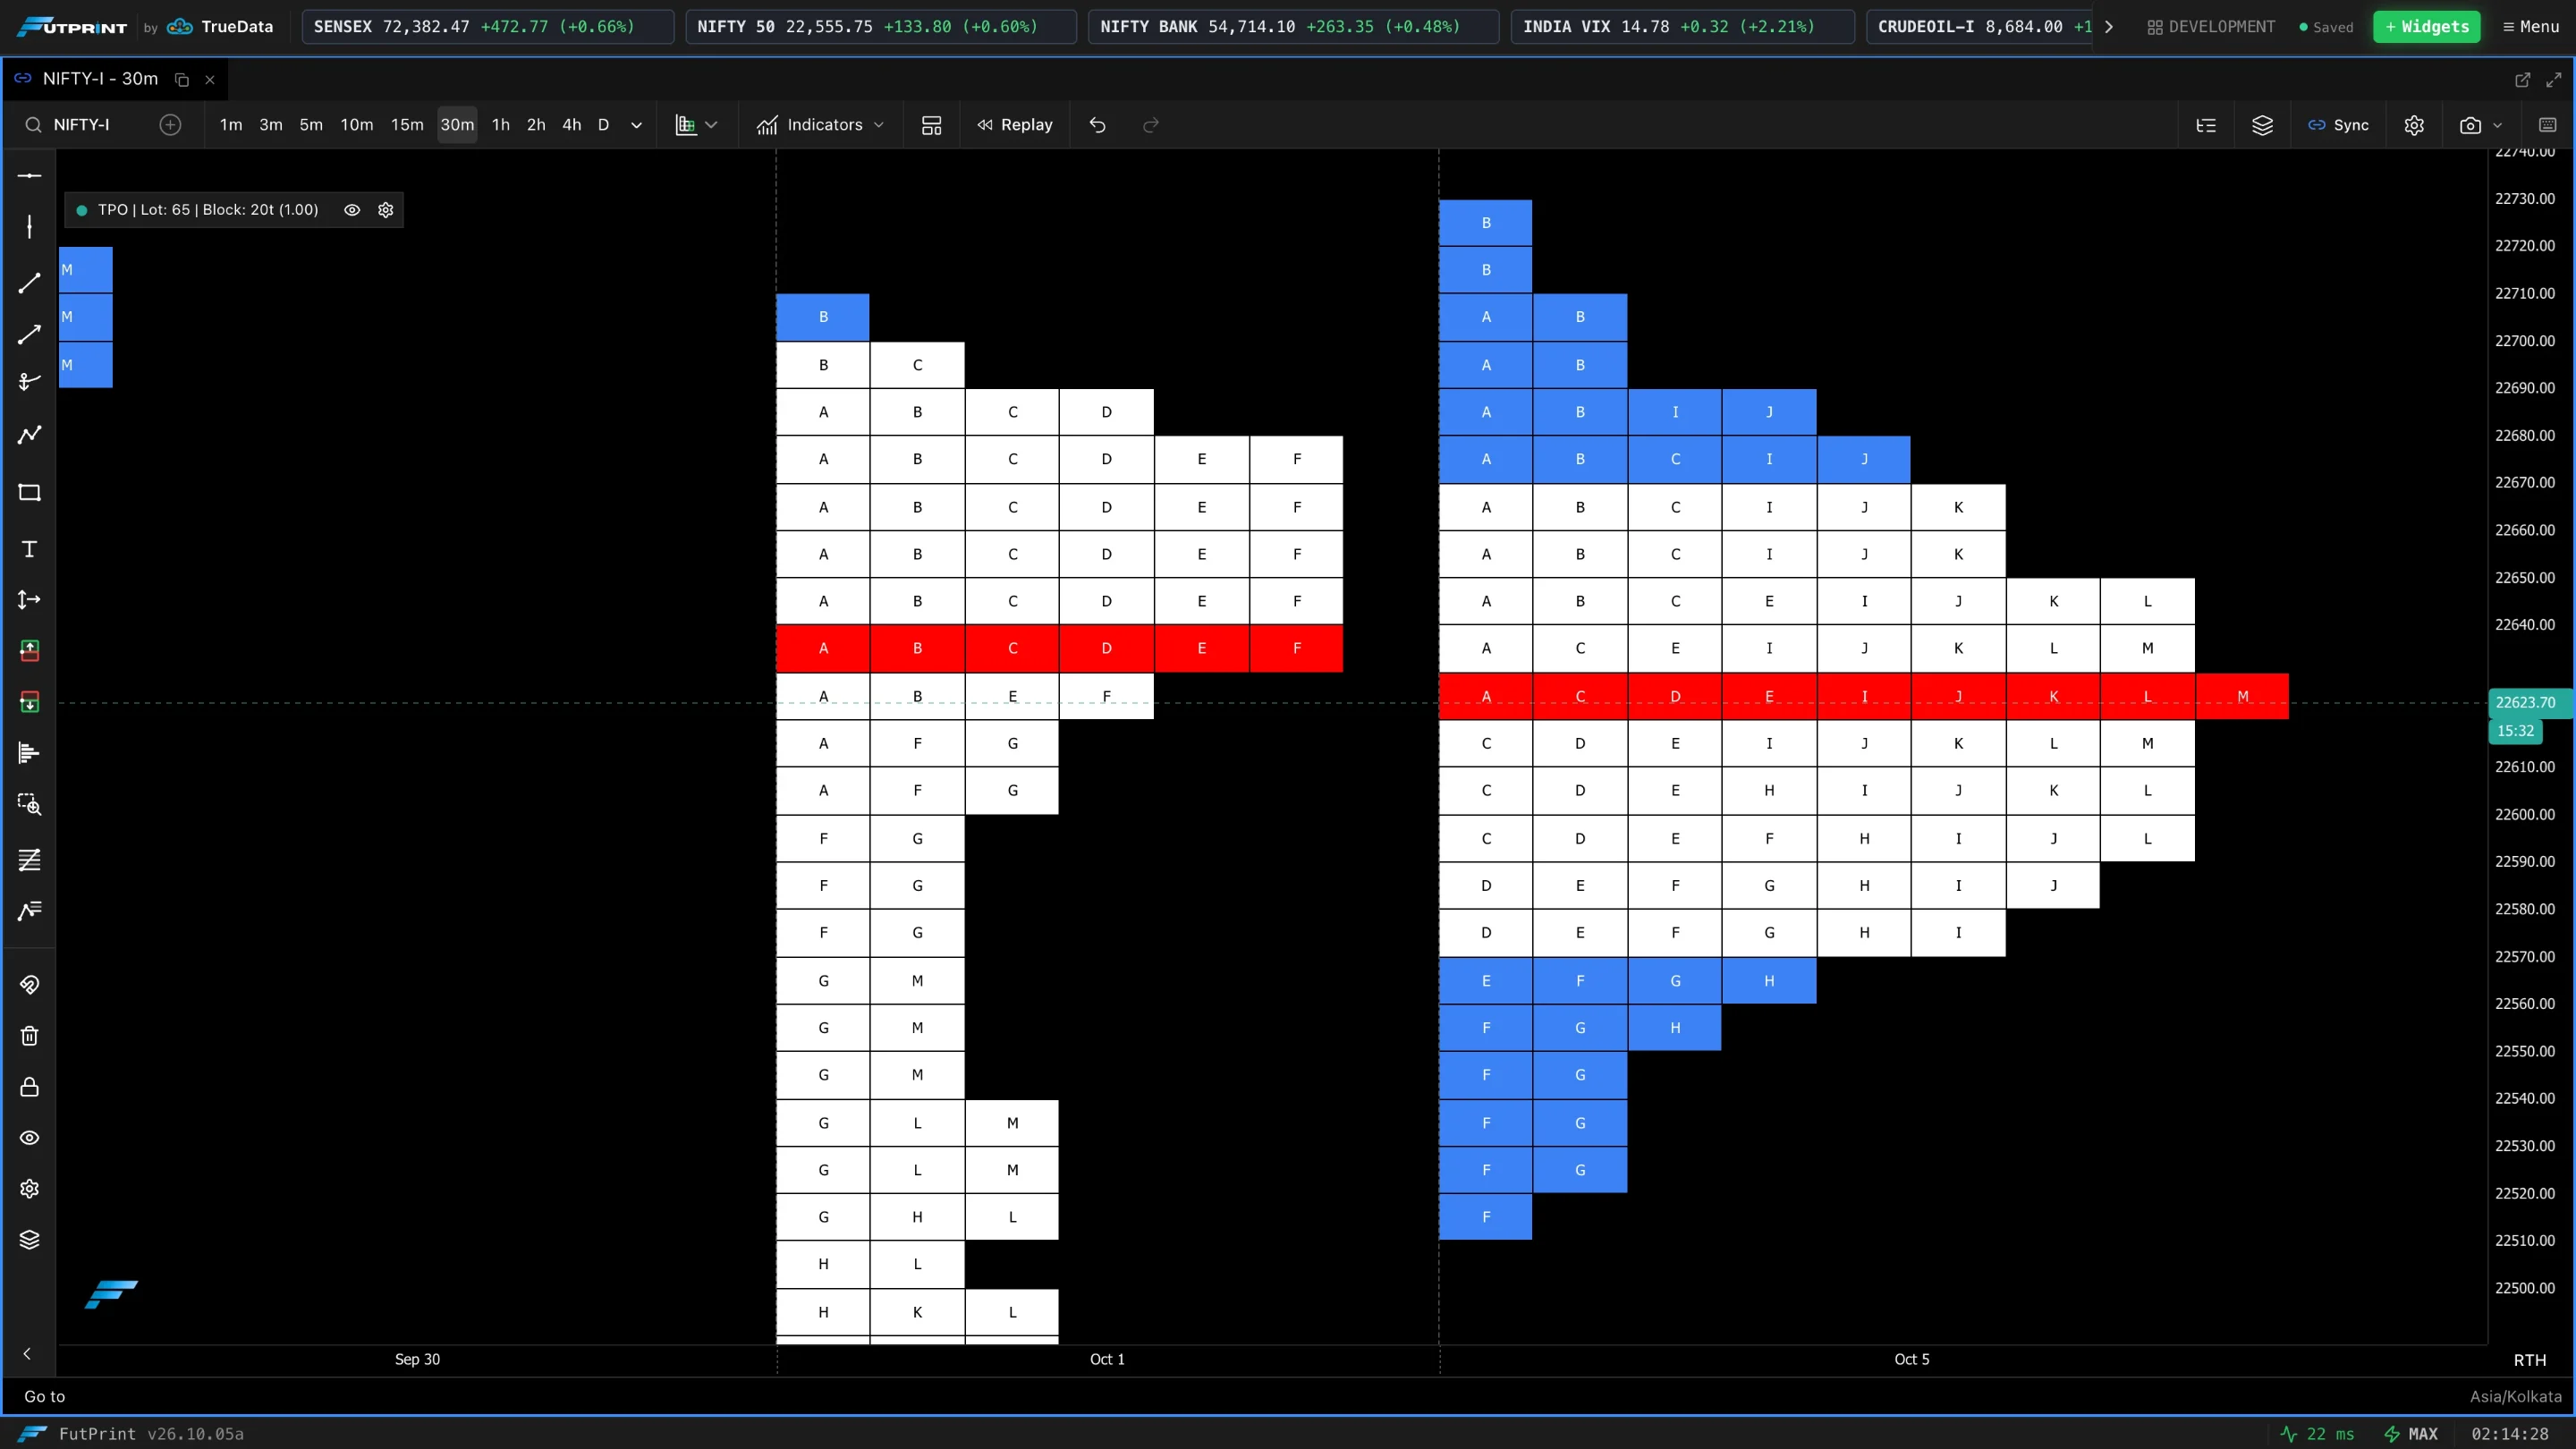
Reading a TPO profile
- Letters — each letter is one TPO period. A is the first period of the profile, B the second, and so on. A row with many letters is a price the market kept returning to.
- Point of Control (POC) — the row with the most letters: where the market spent the most time.
- Value Area — the rows around the POC that hold a set share of the activity (70% by default), bounded by the Value Area High (VAH) and Value Area Low (VAL).
- Single prints — rows with only one letter: price moved through too fast to build any acceptance.
- Initial Balance — the range of the opening window, a reference for the rest of the day.
Profile Setup
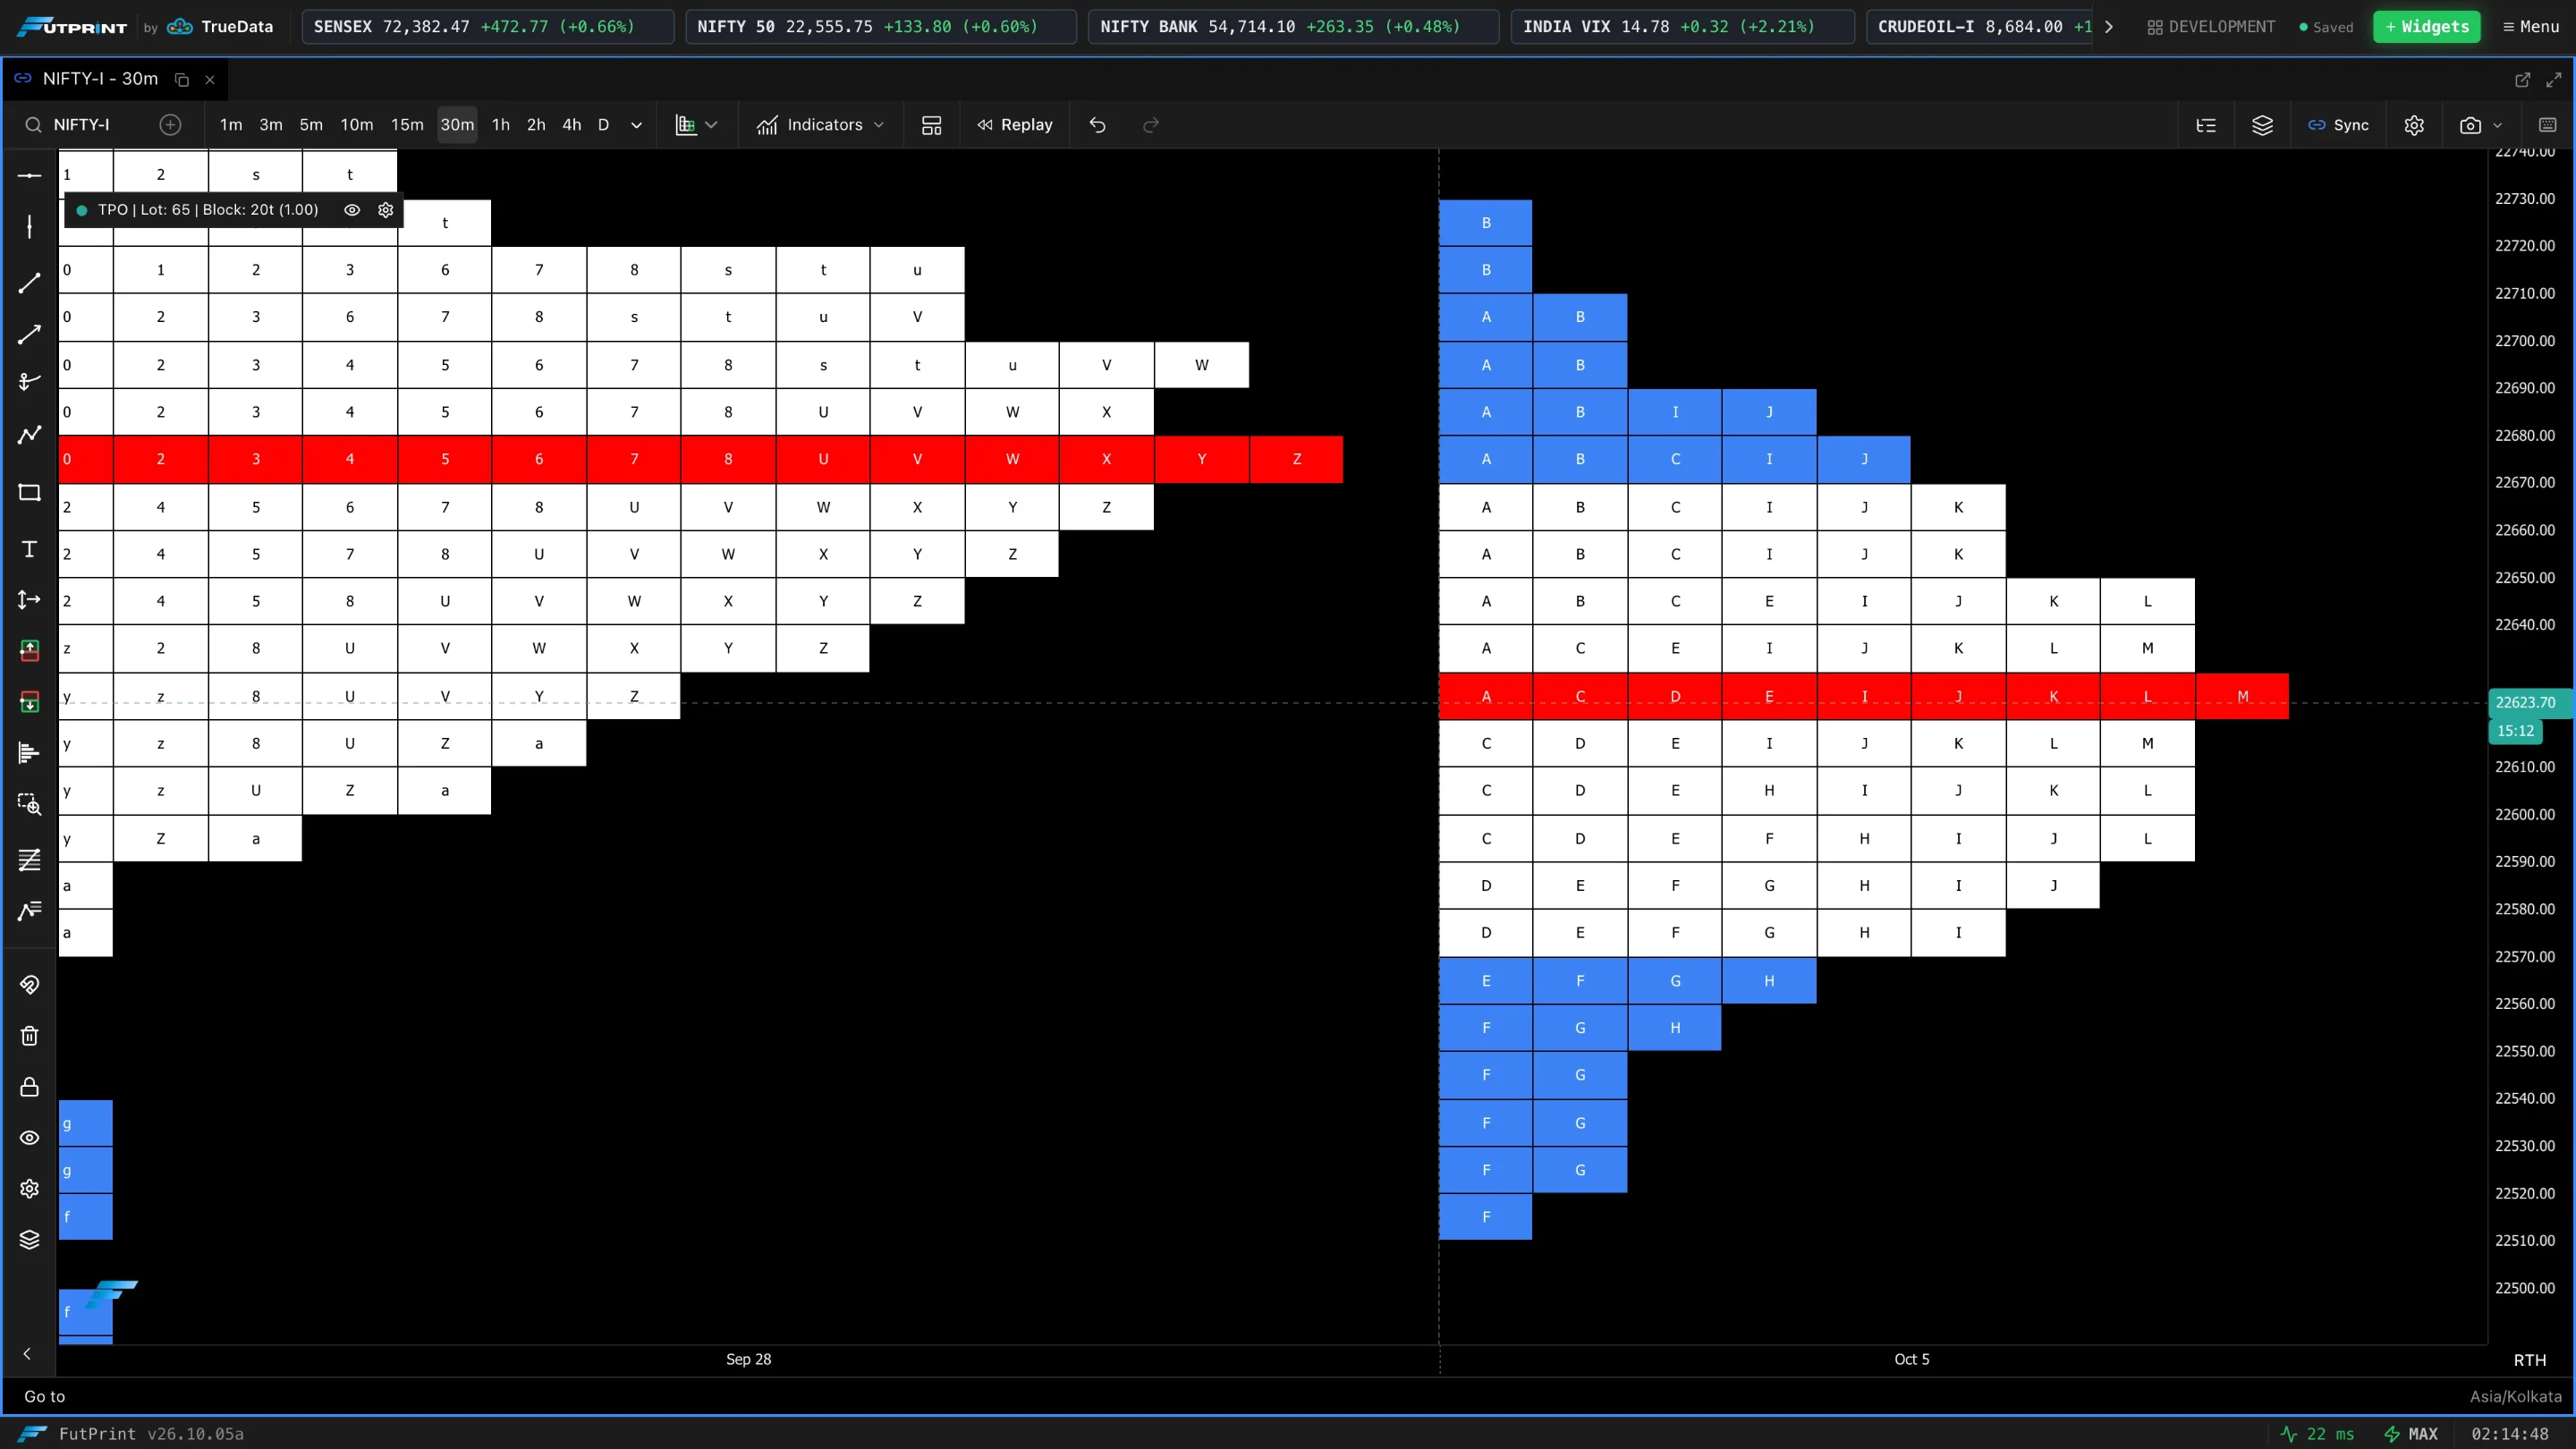
Anchor Point
How candles are grouped into profiles: Day, Week, Month or Session. Day groups by trading day; Session groups by market session.
- Session Start (UTC) (Session) — session anchors roll at this UTC minute, keeping overnight trading in one profile.
- Week Starts (Week) — the first day used for weekly profiles: Sunday, Monday or Saturday.
- Month Starts On (Month) — the calendar day used to roll monthly profiles.
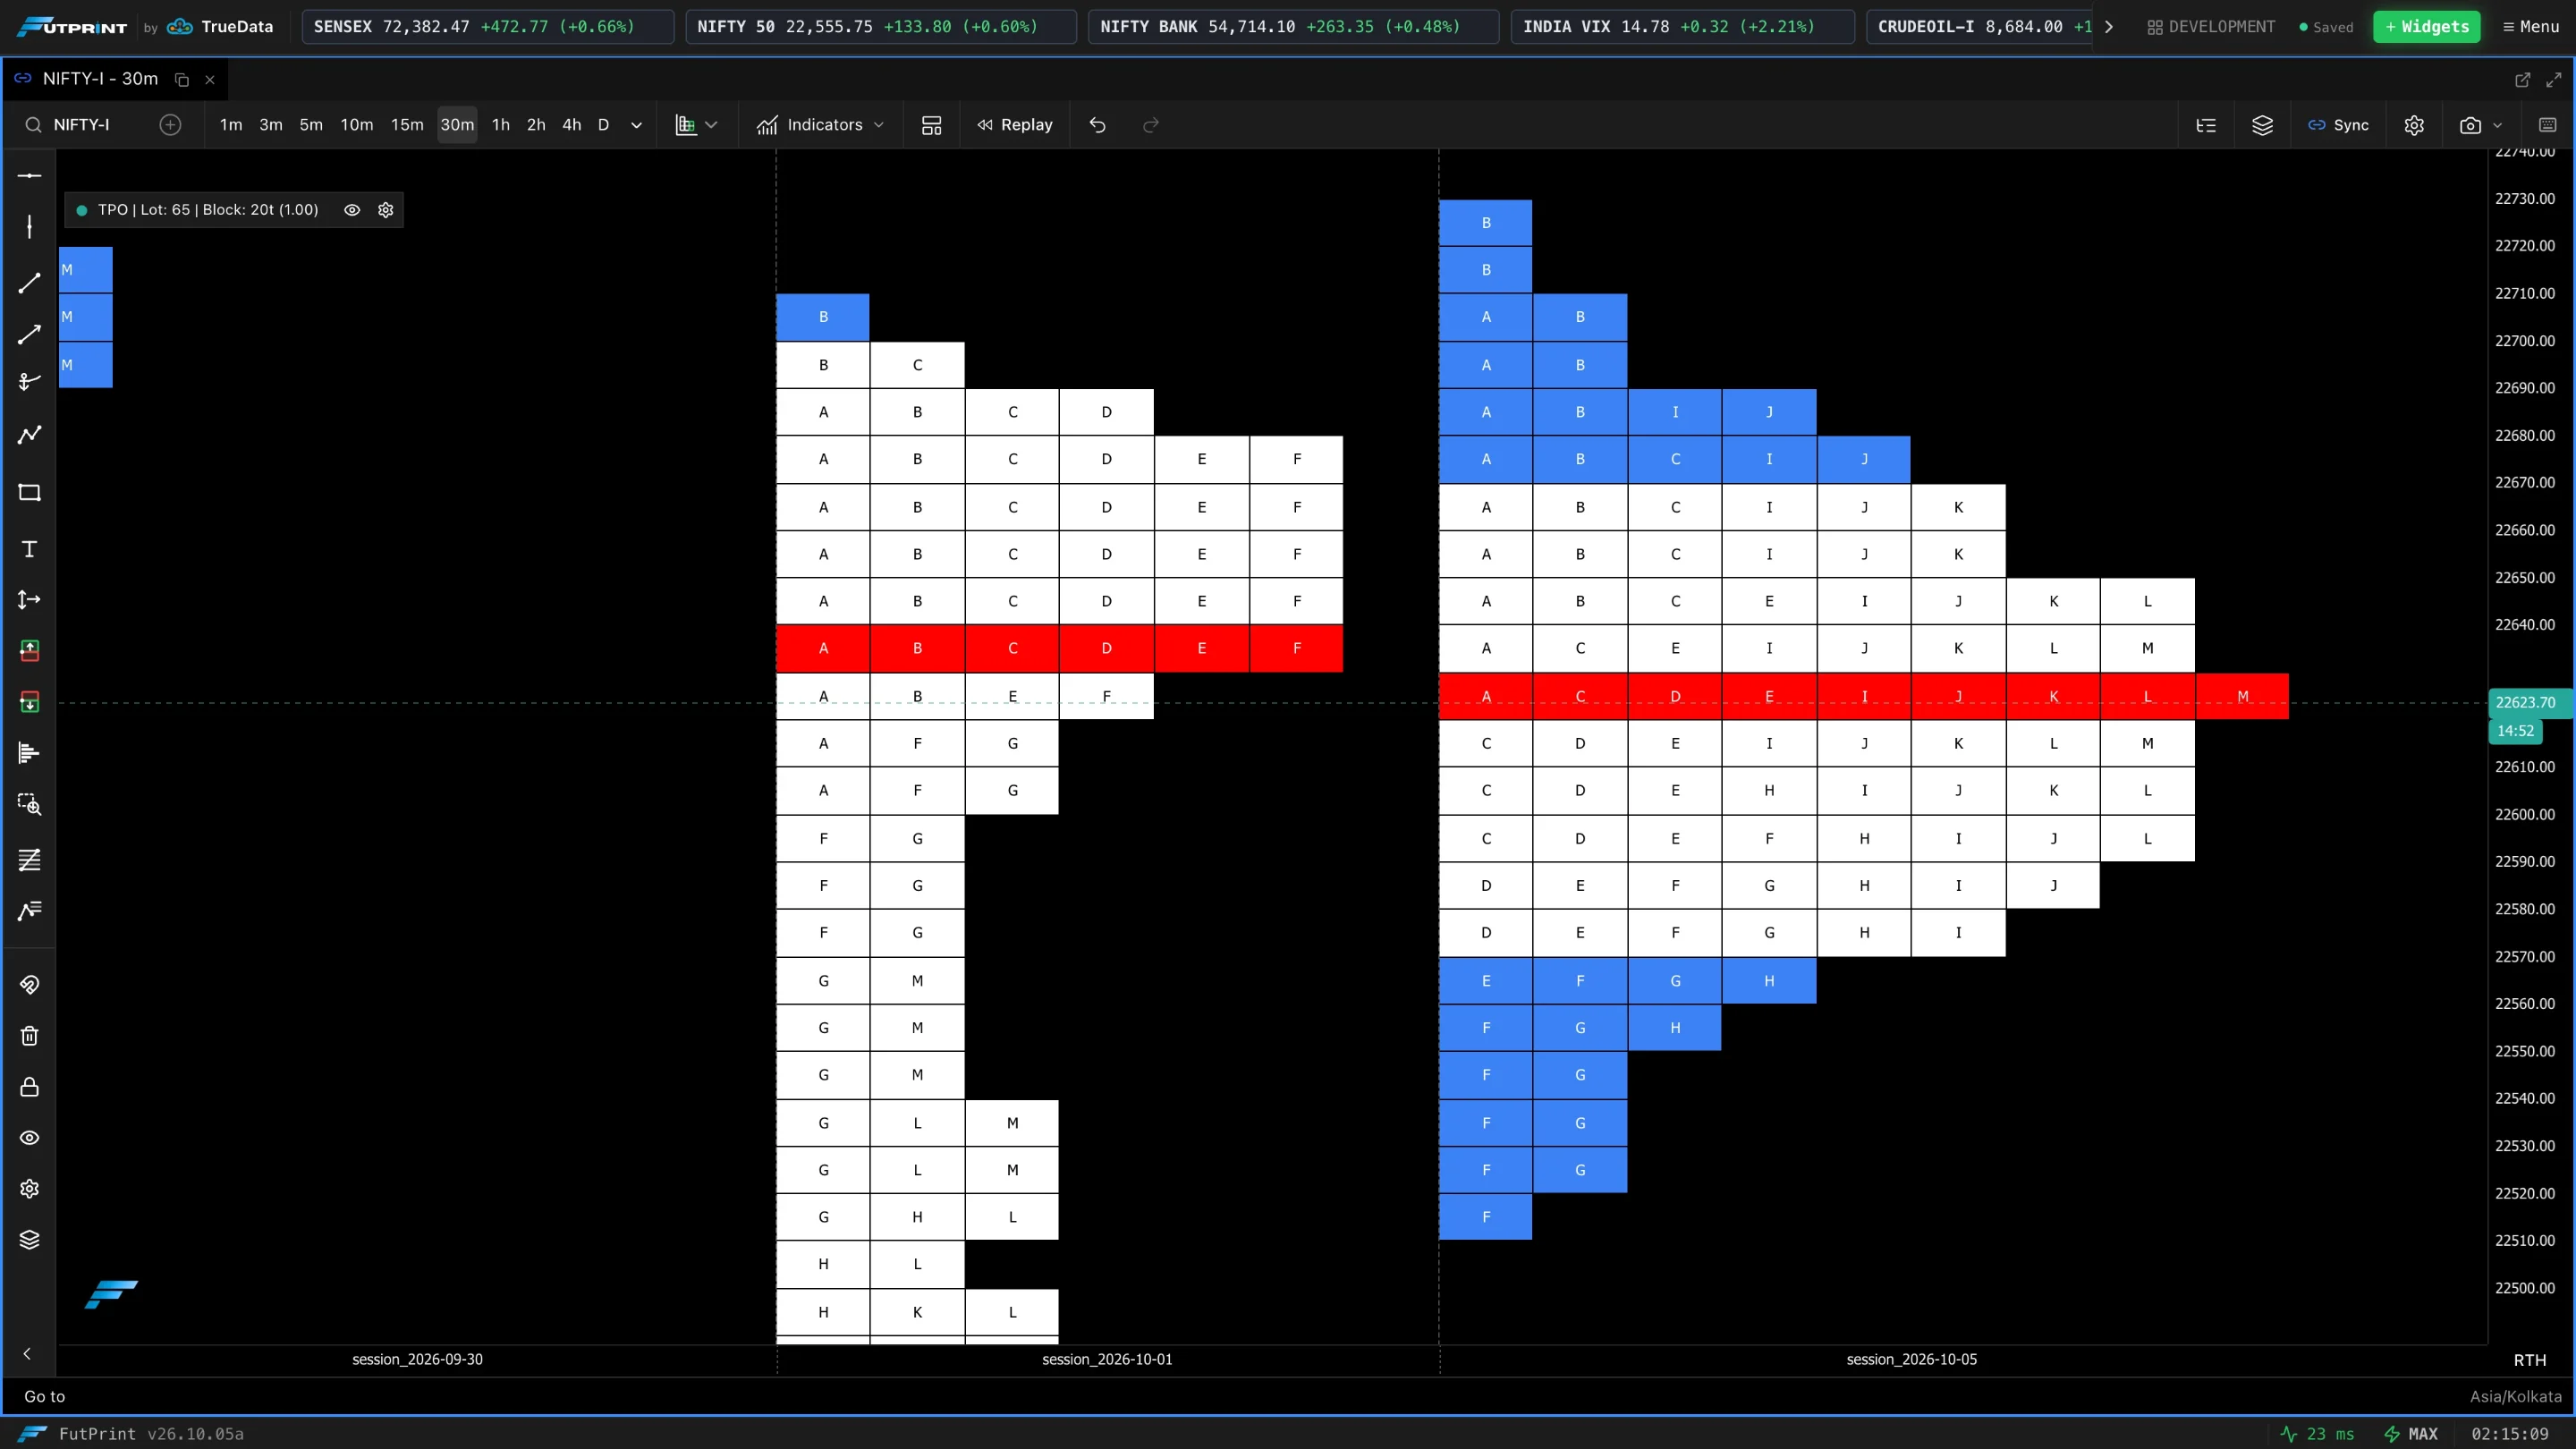
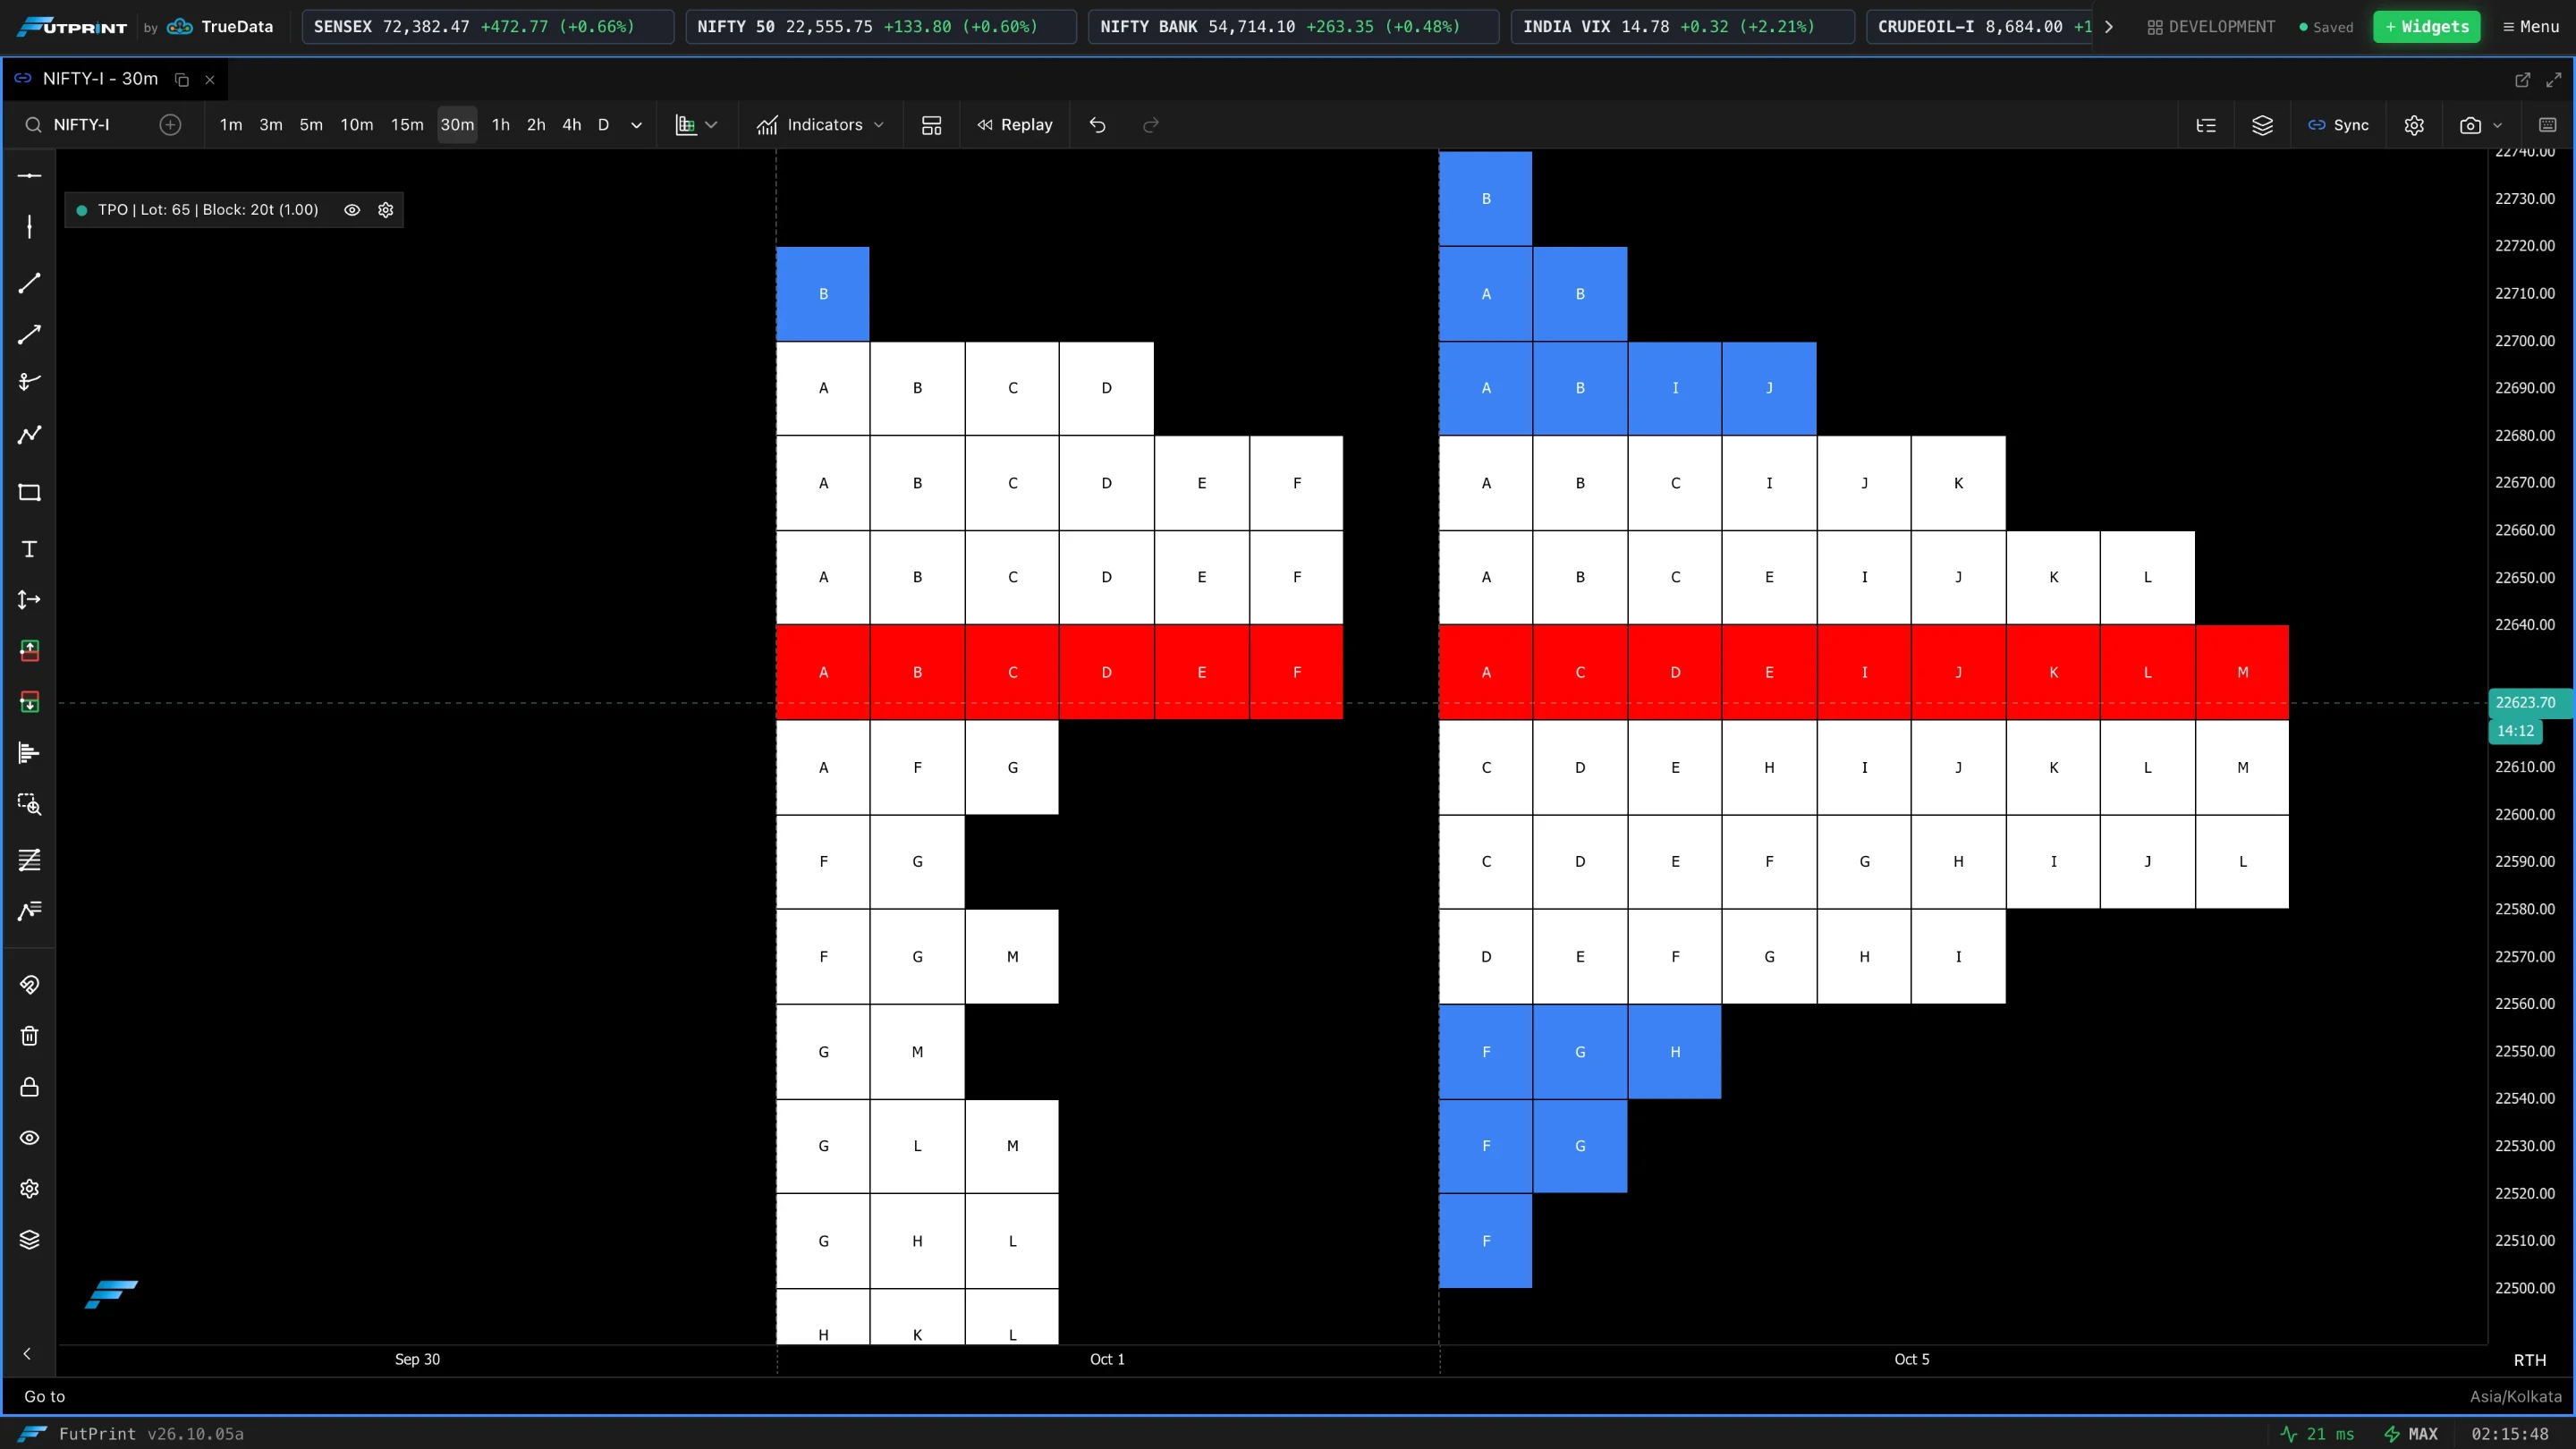
Bin Size (ticks)
The number of tick levels per TPO block. Higher values create wider price bands per letter: fewer, taller rows.
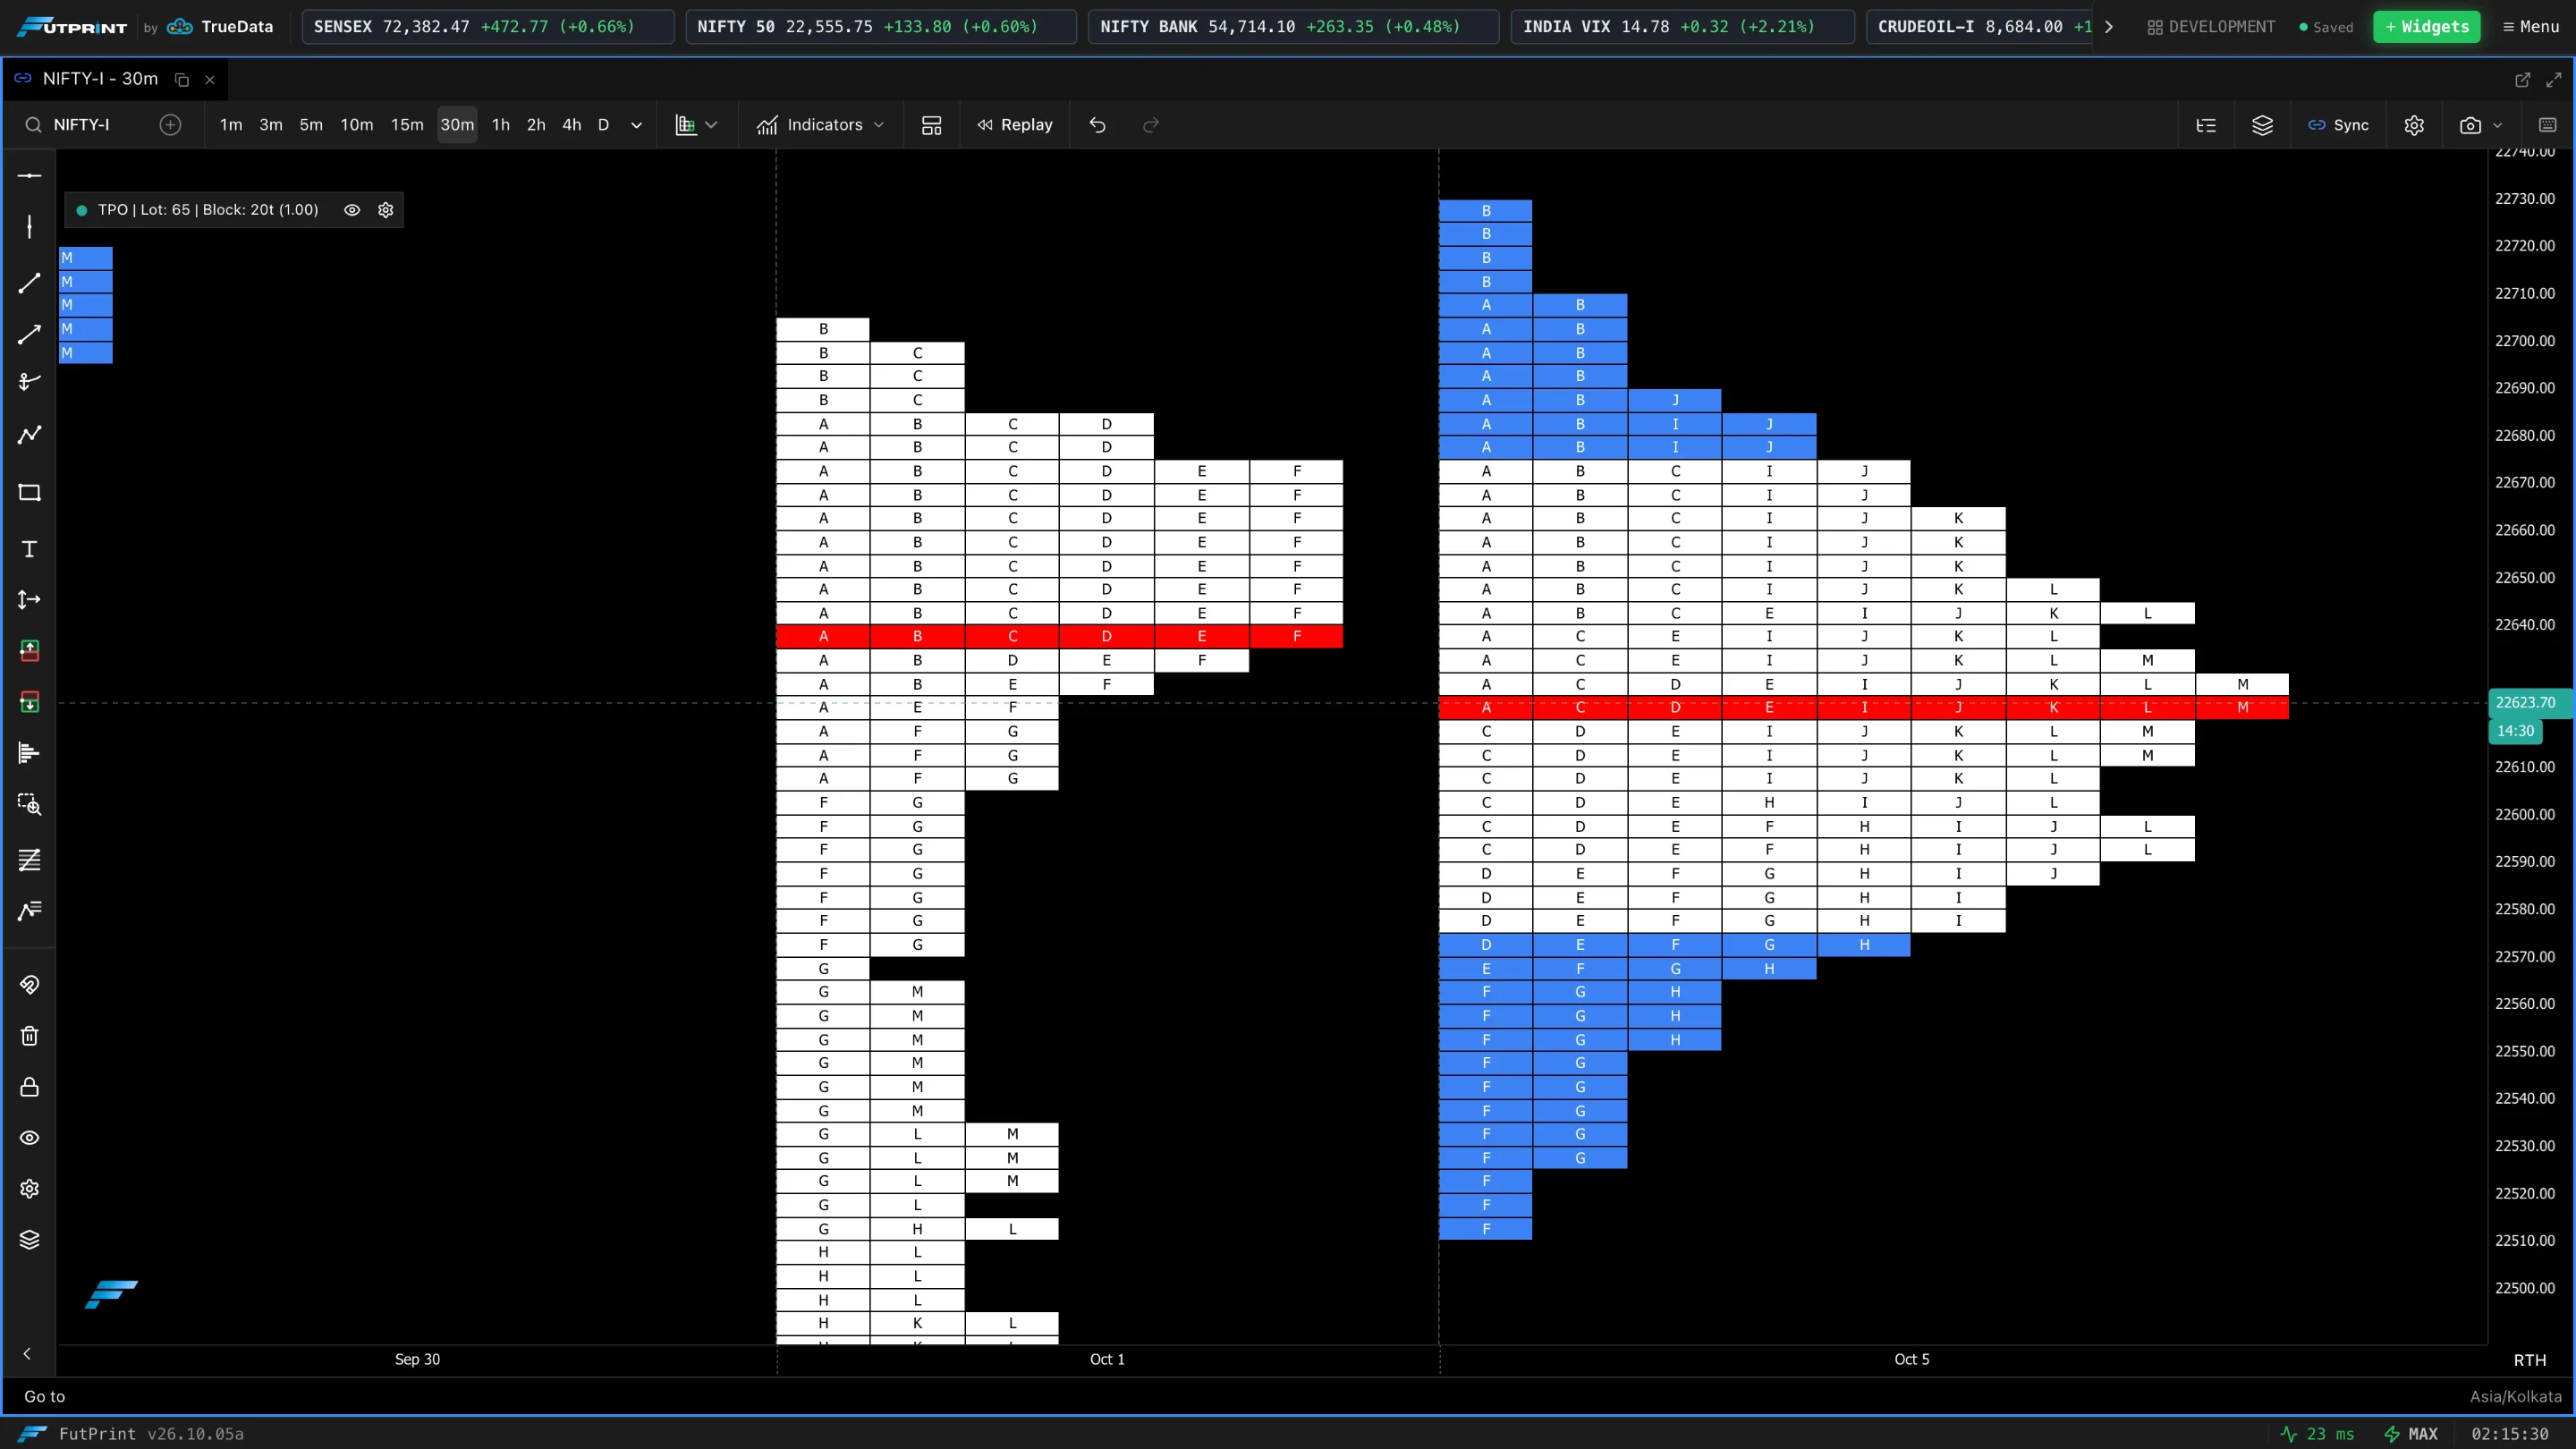
TPO Period (min)
The duration represented by each letter: 5, 10, 15, 30 or 60 minutes. This is independent of the chart's candle timeframe.
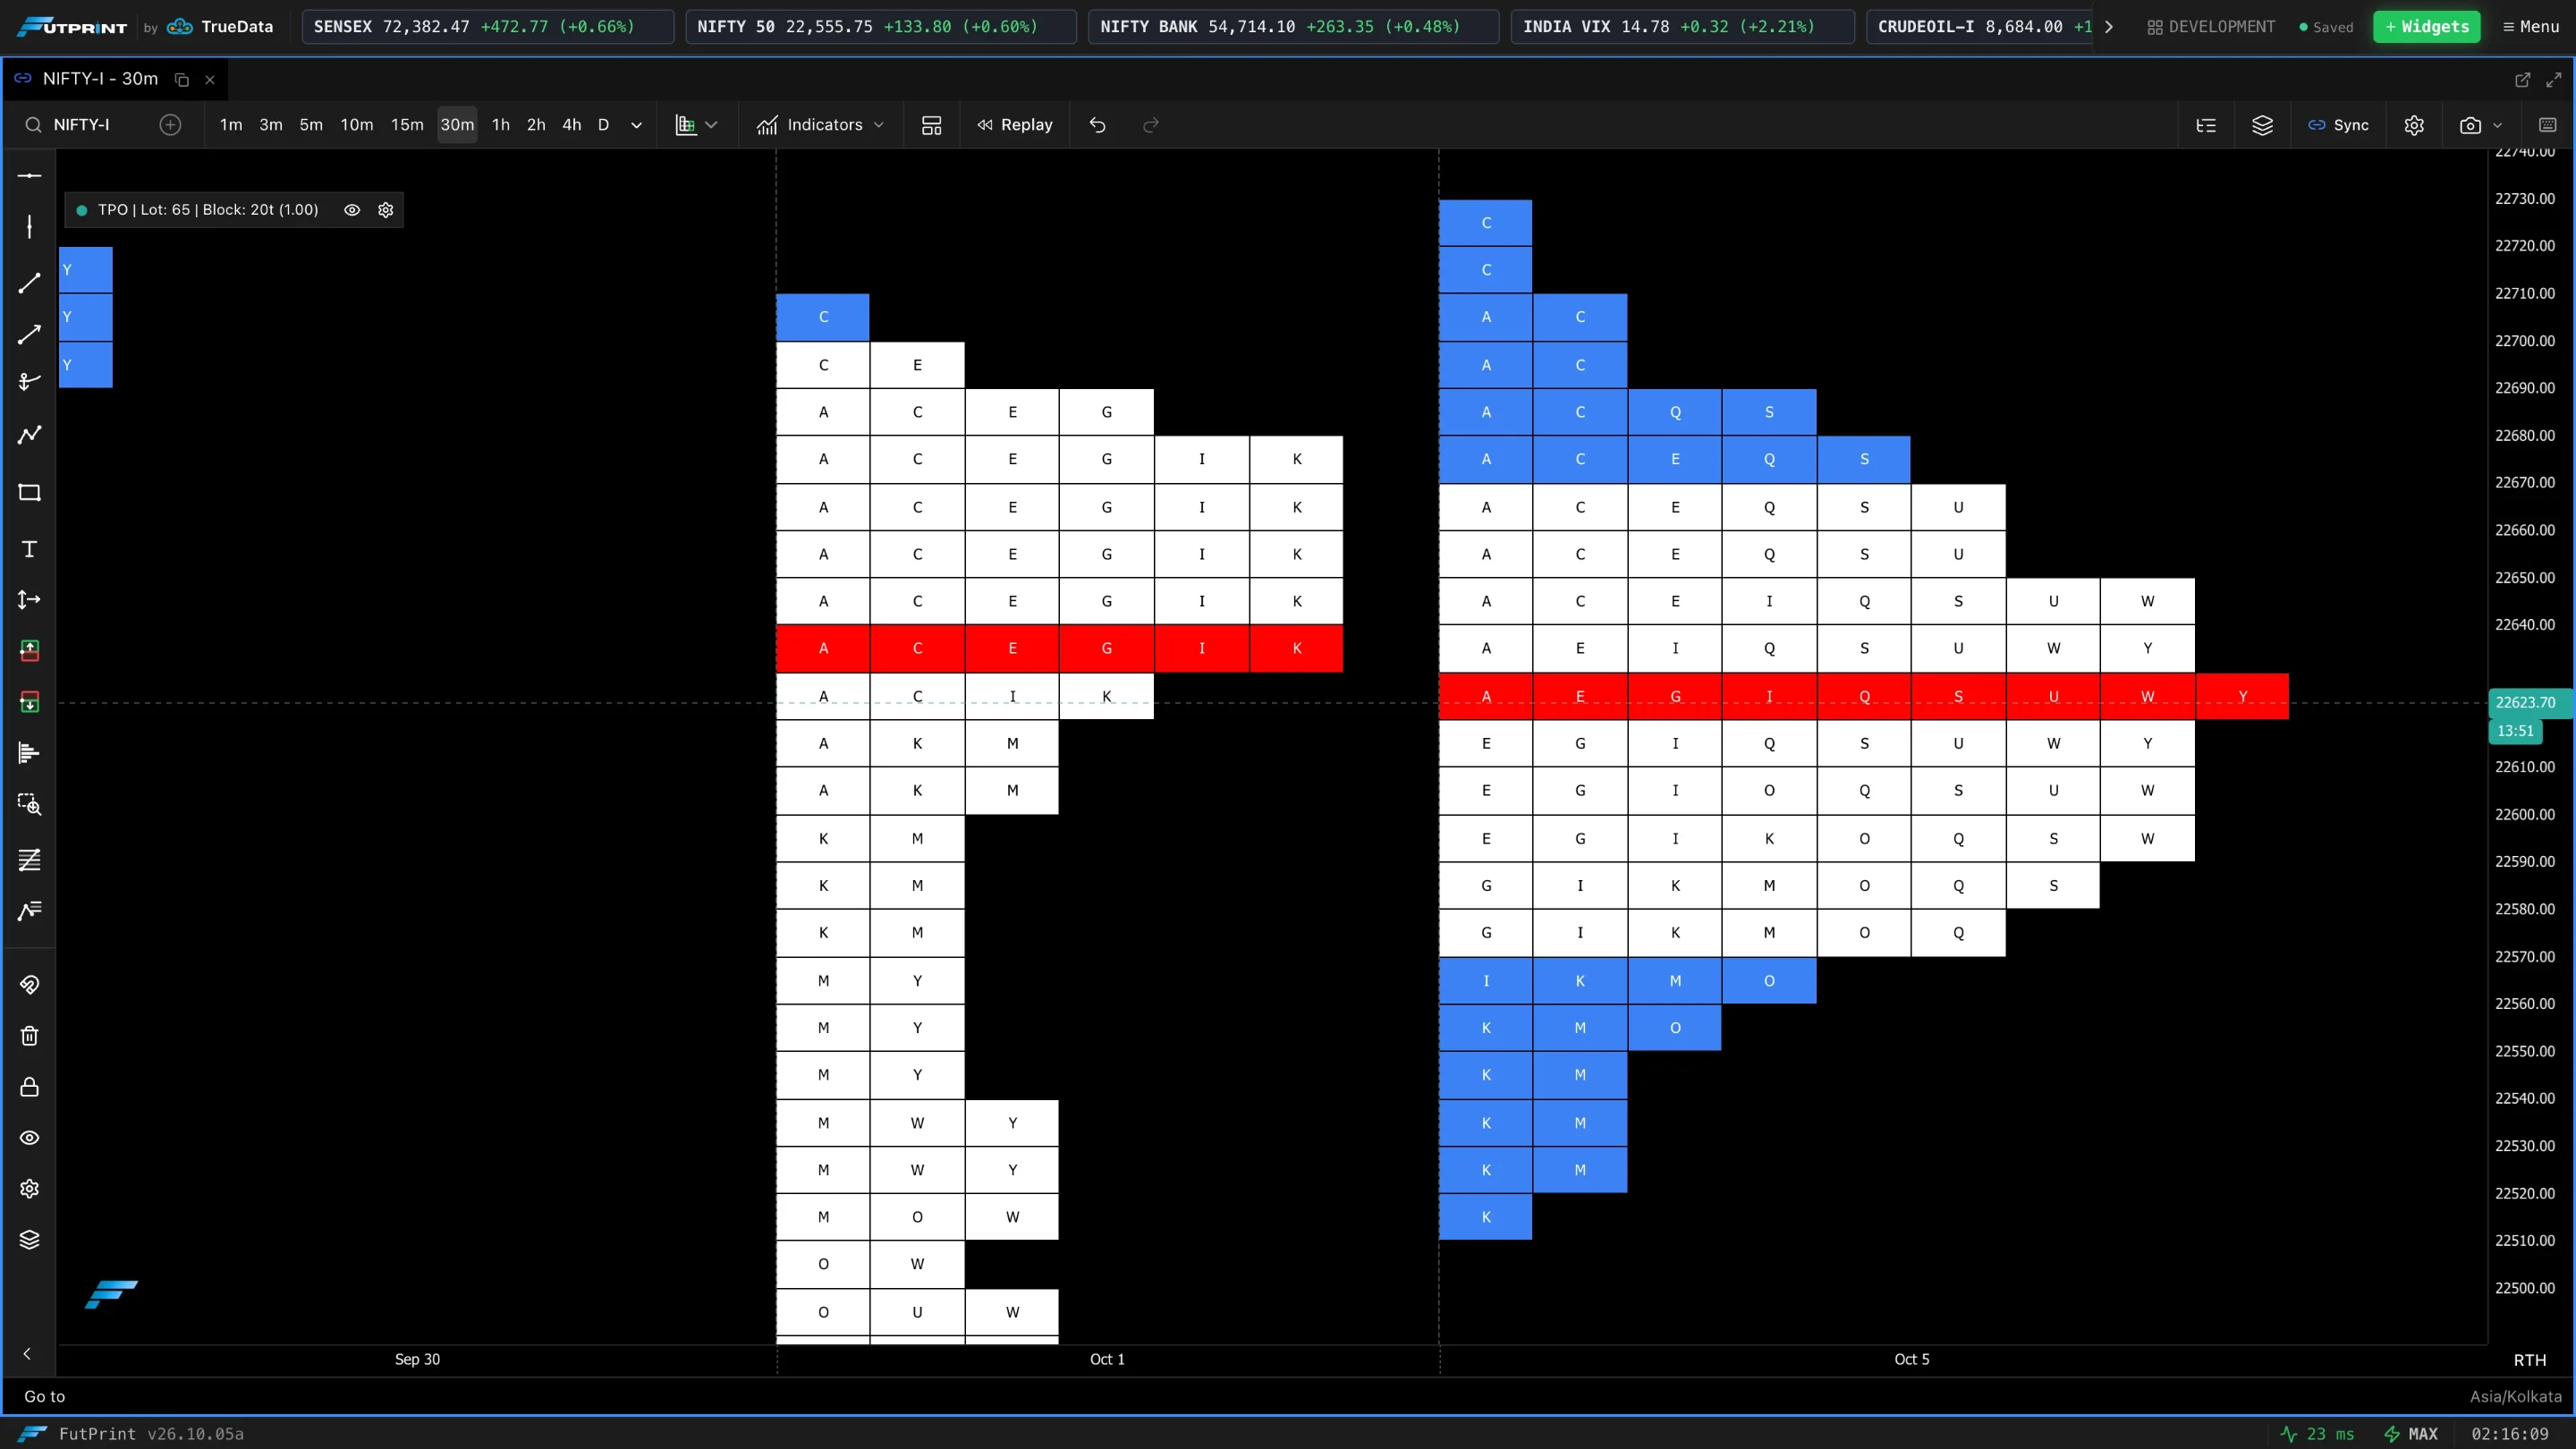
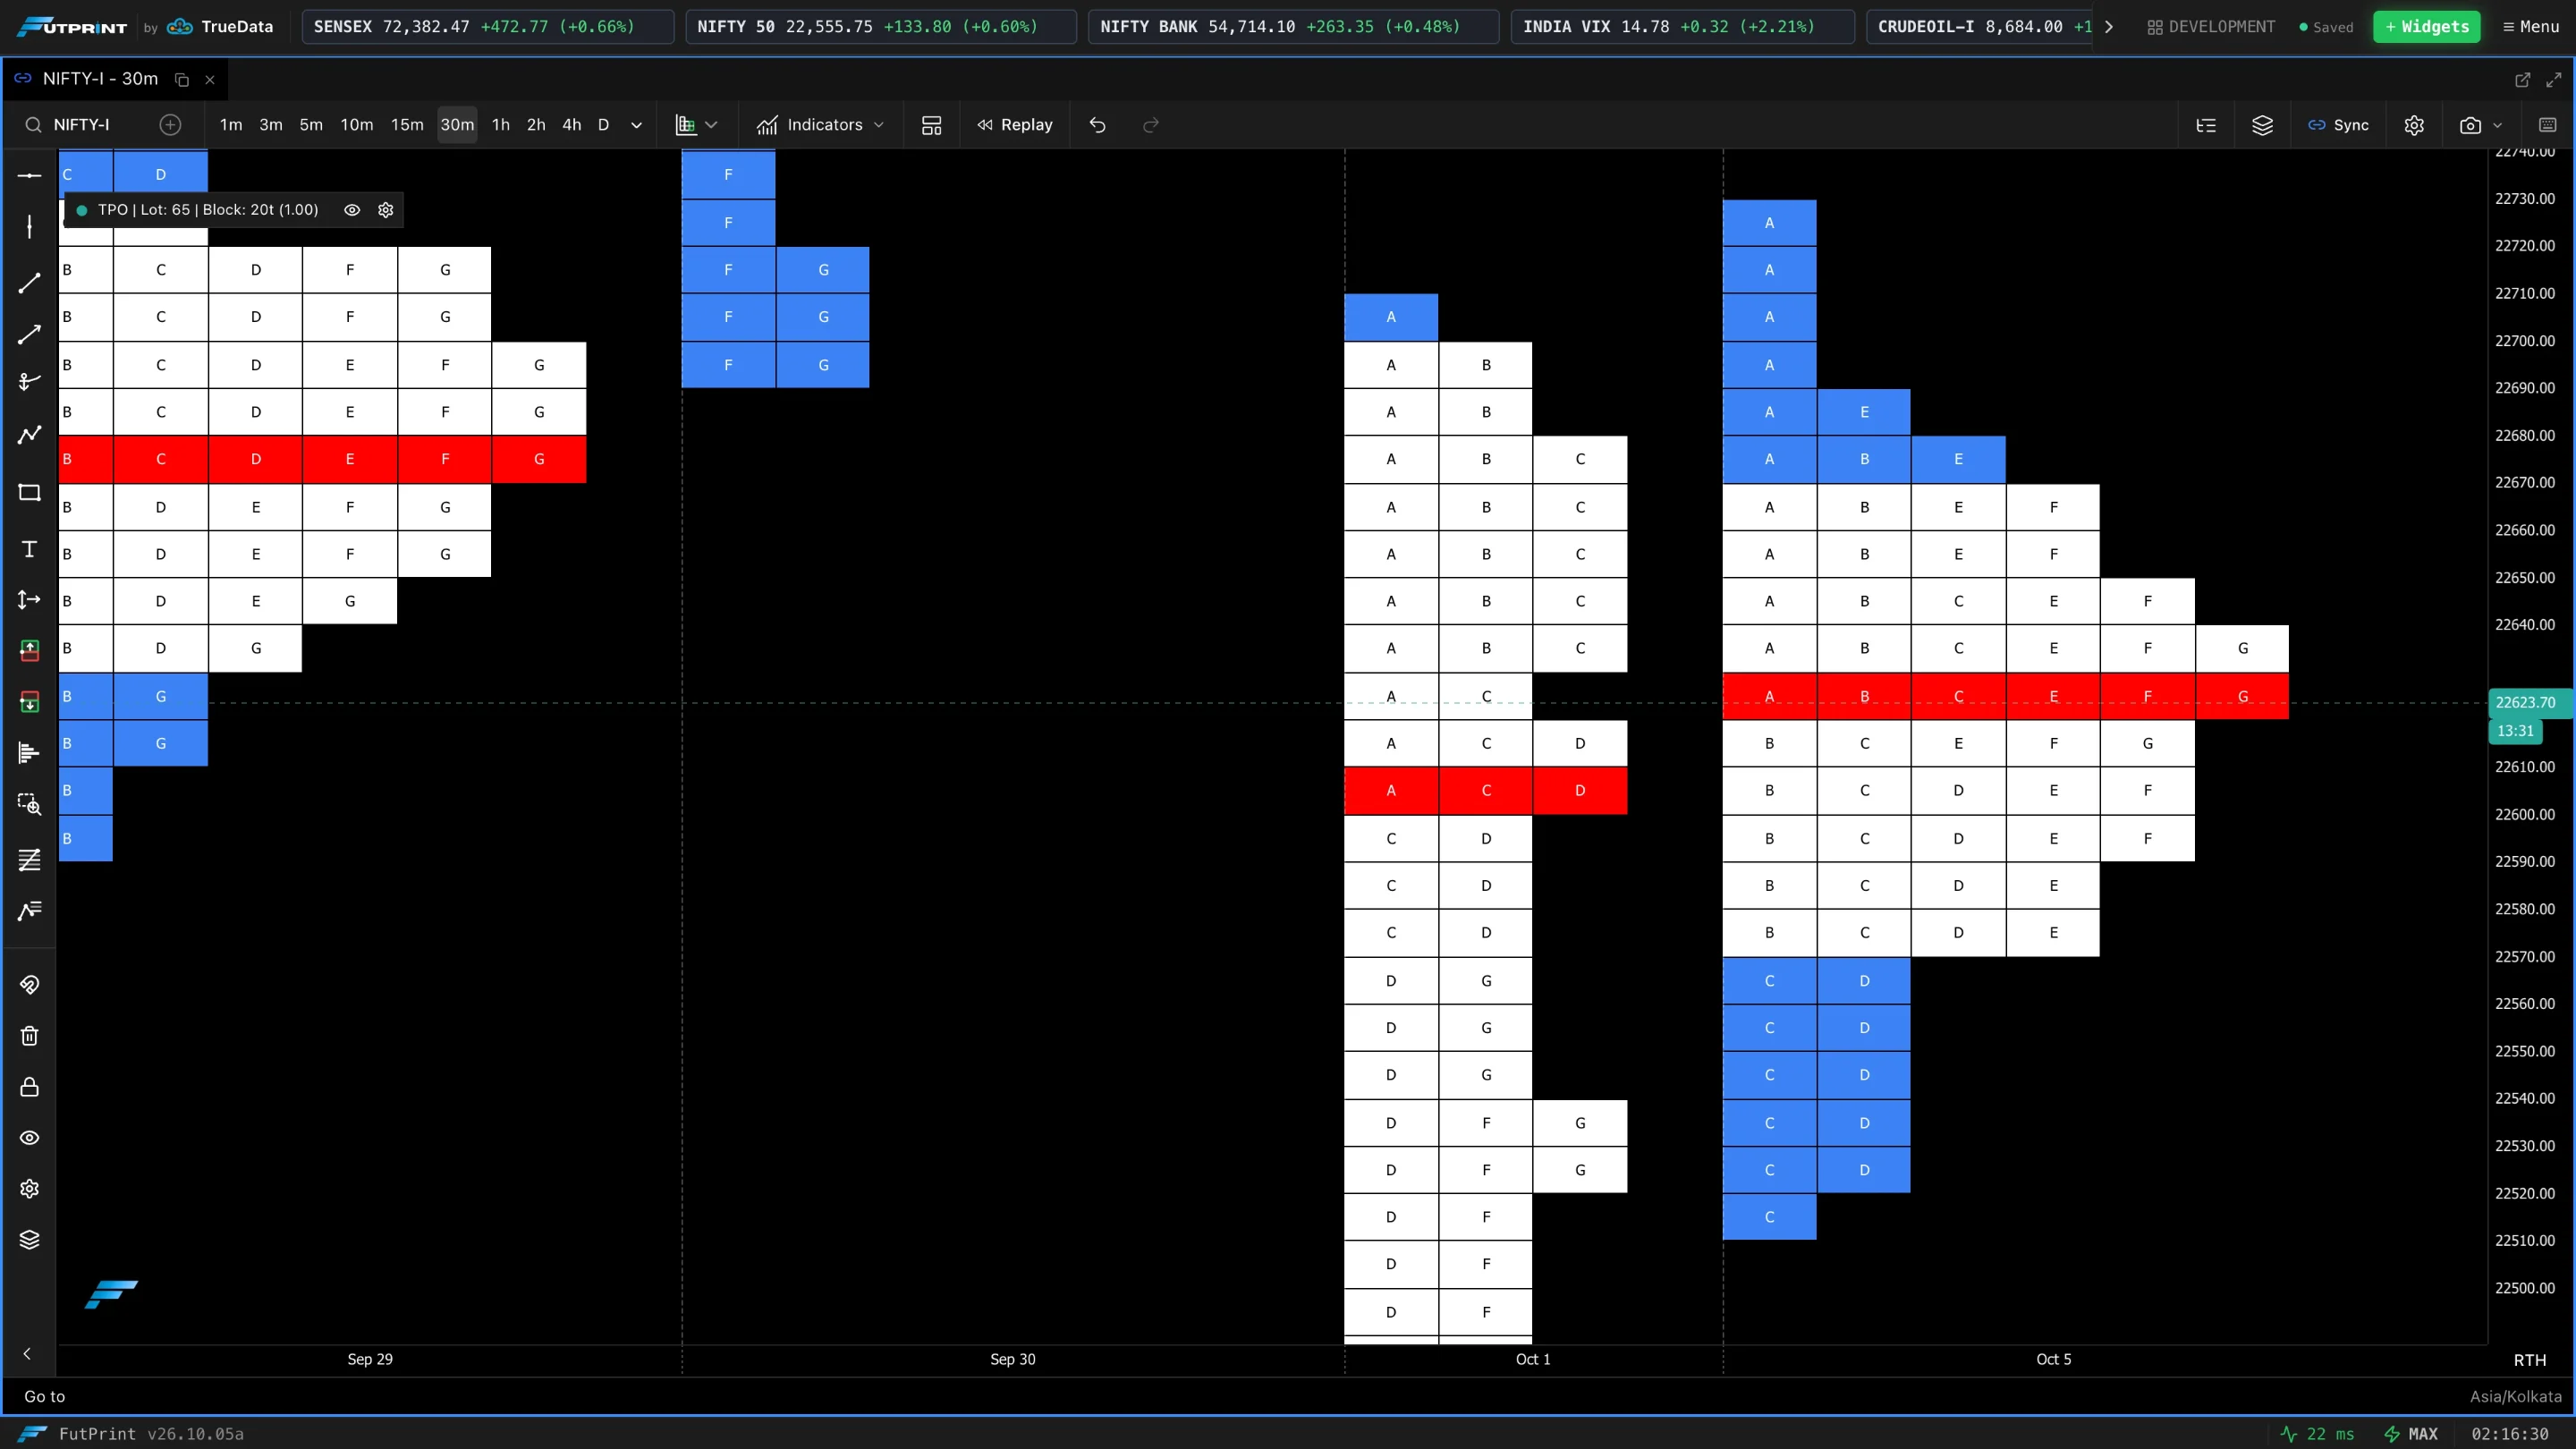
TPO Block Scale
Scales the width of the blocks without changing their price bins.
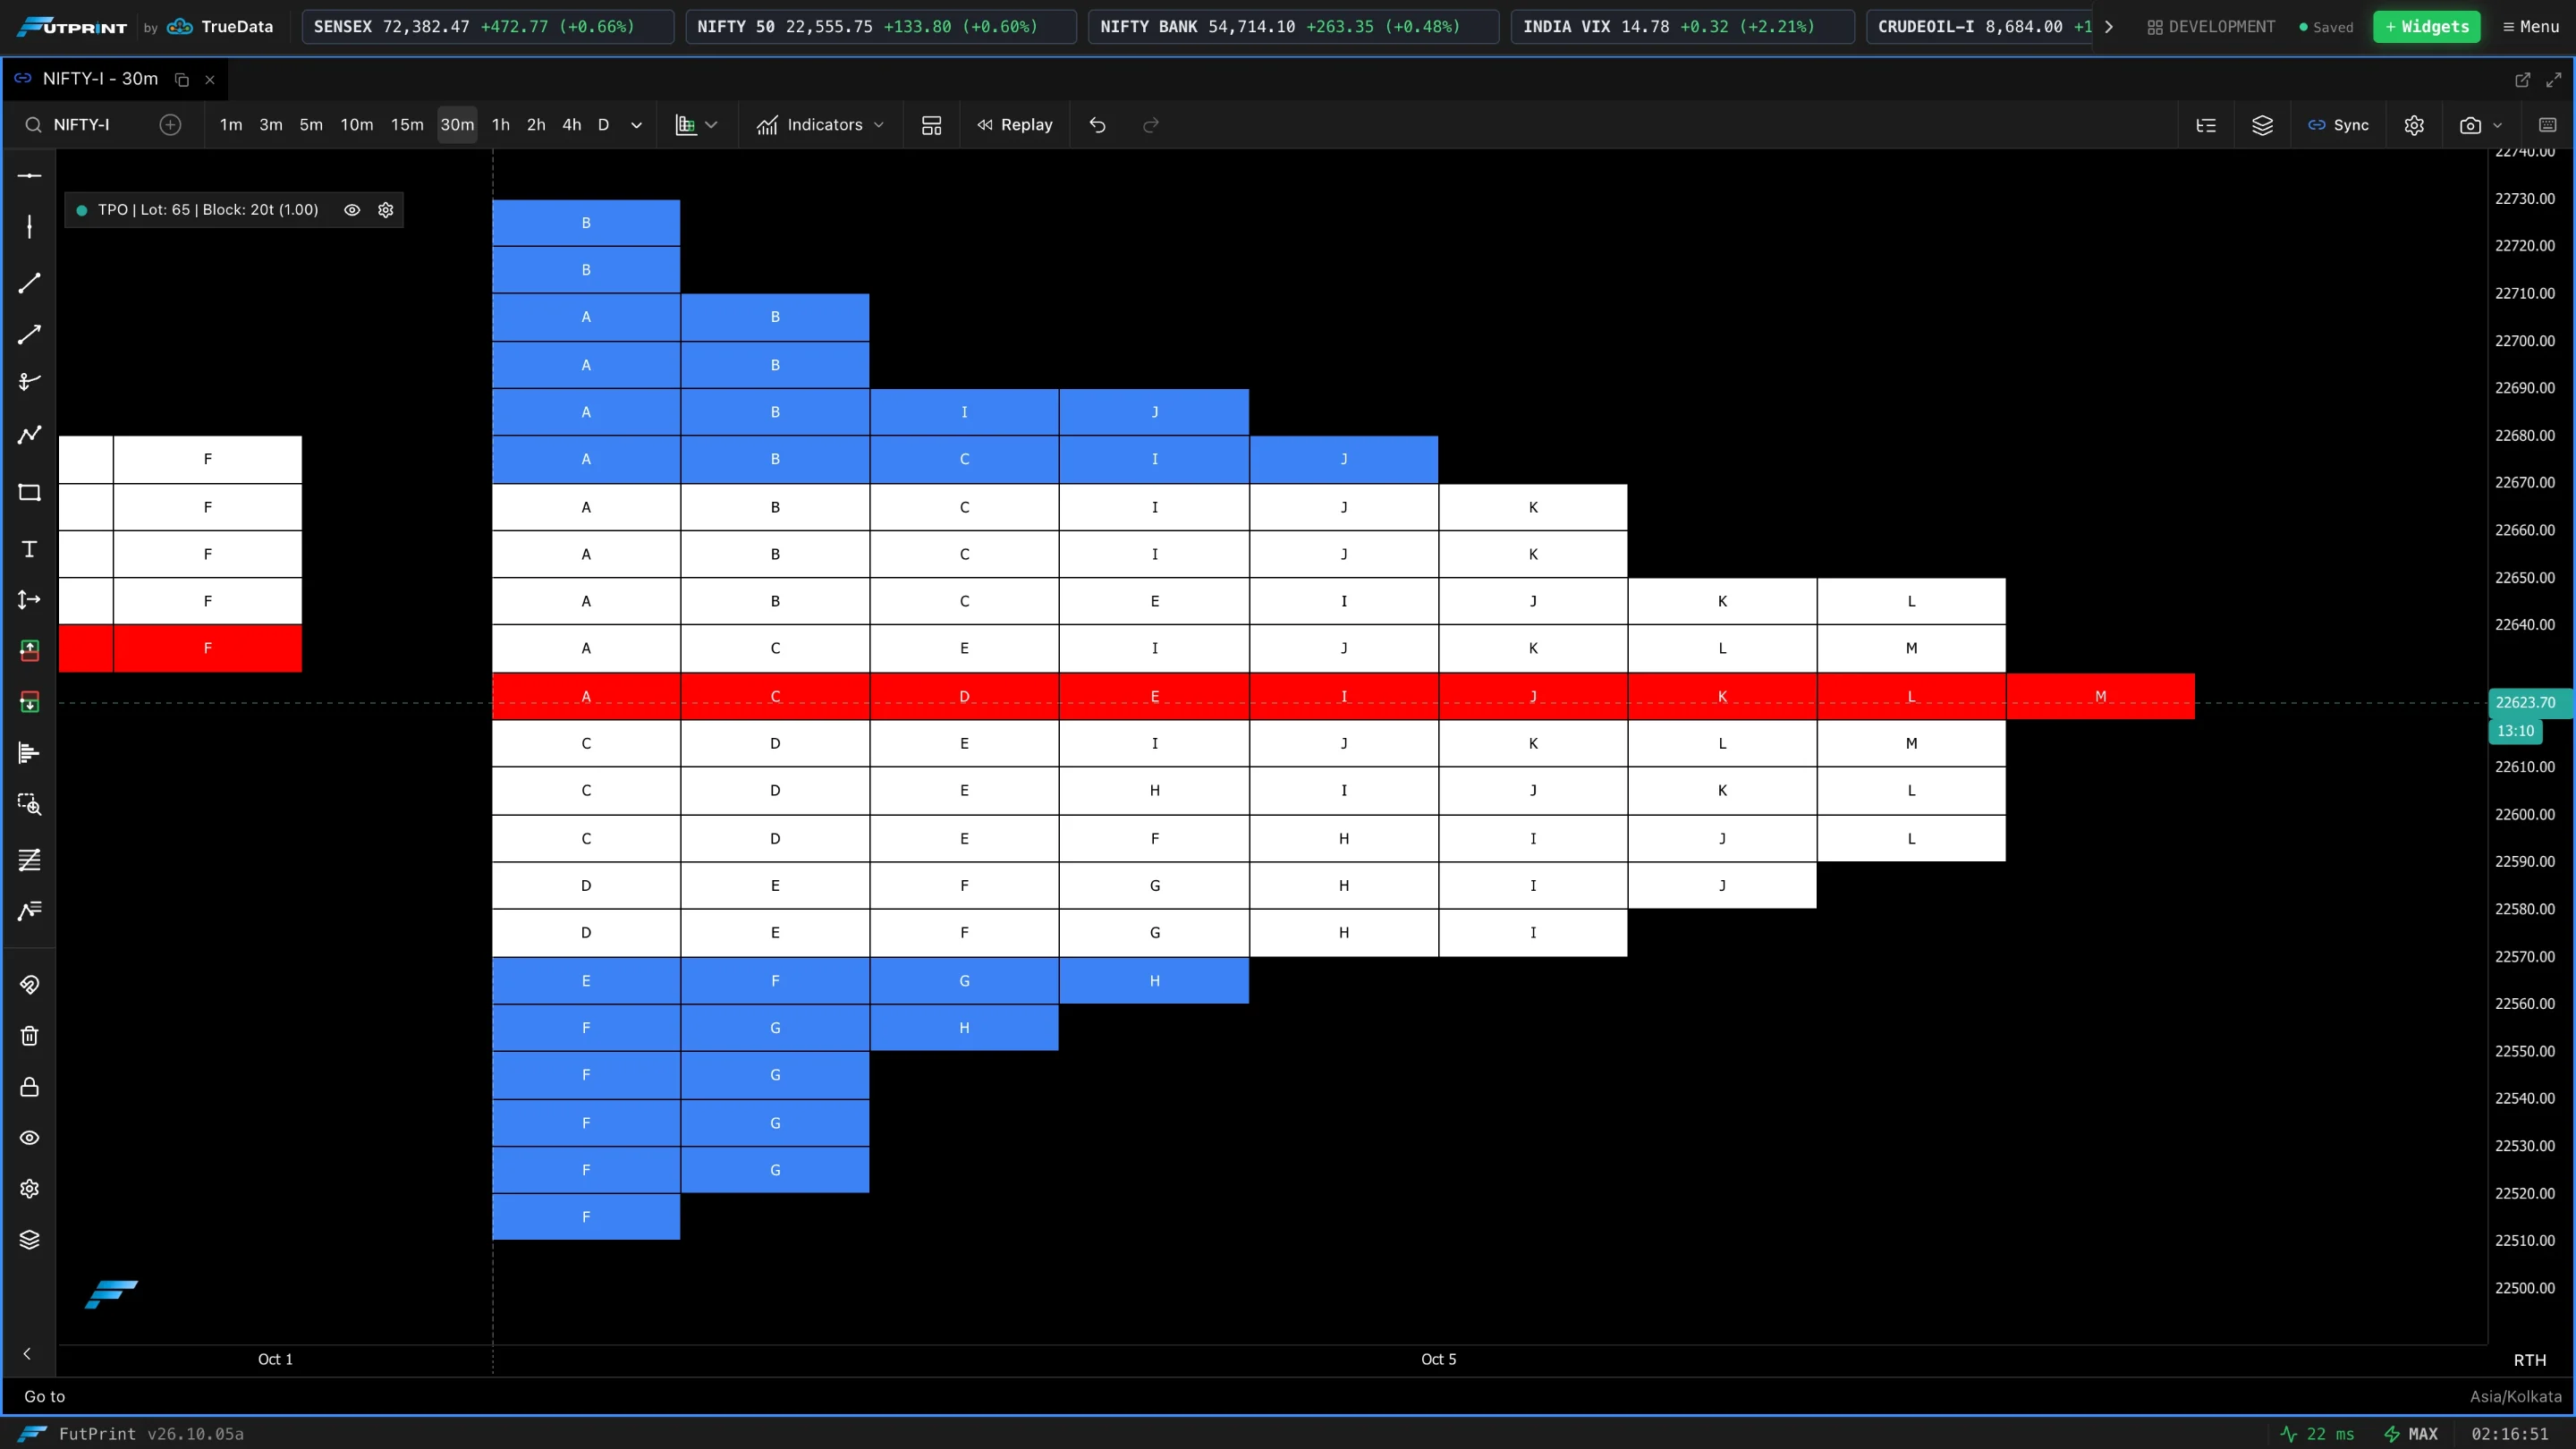
Split Profile
Draws each period in its own column instead of collapsing the letters to the left, so you can follow the session period by period.
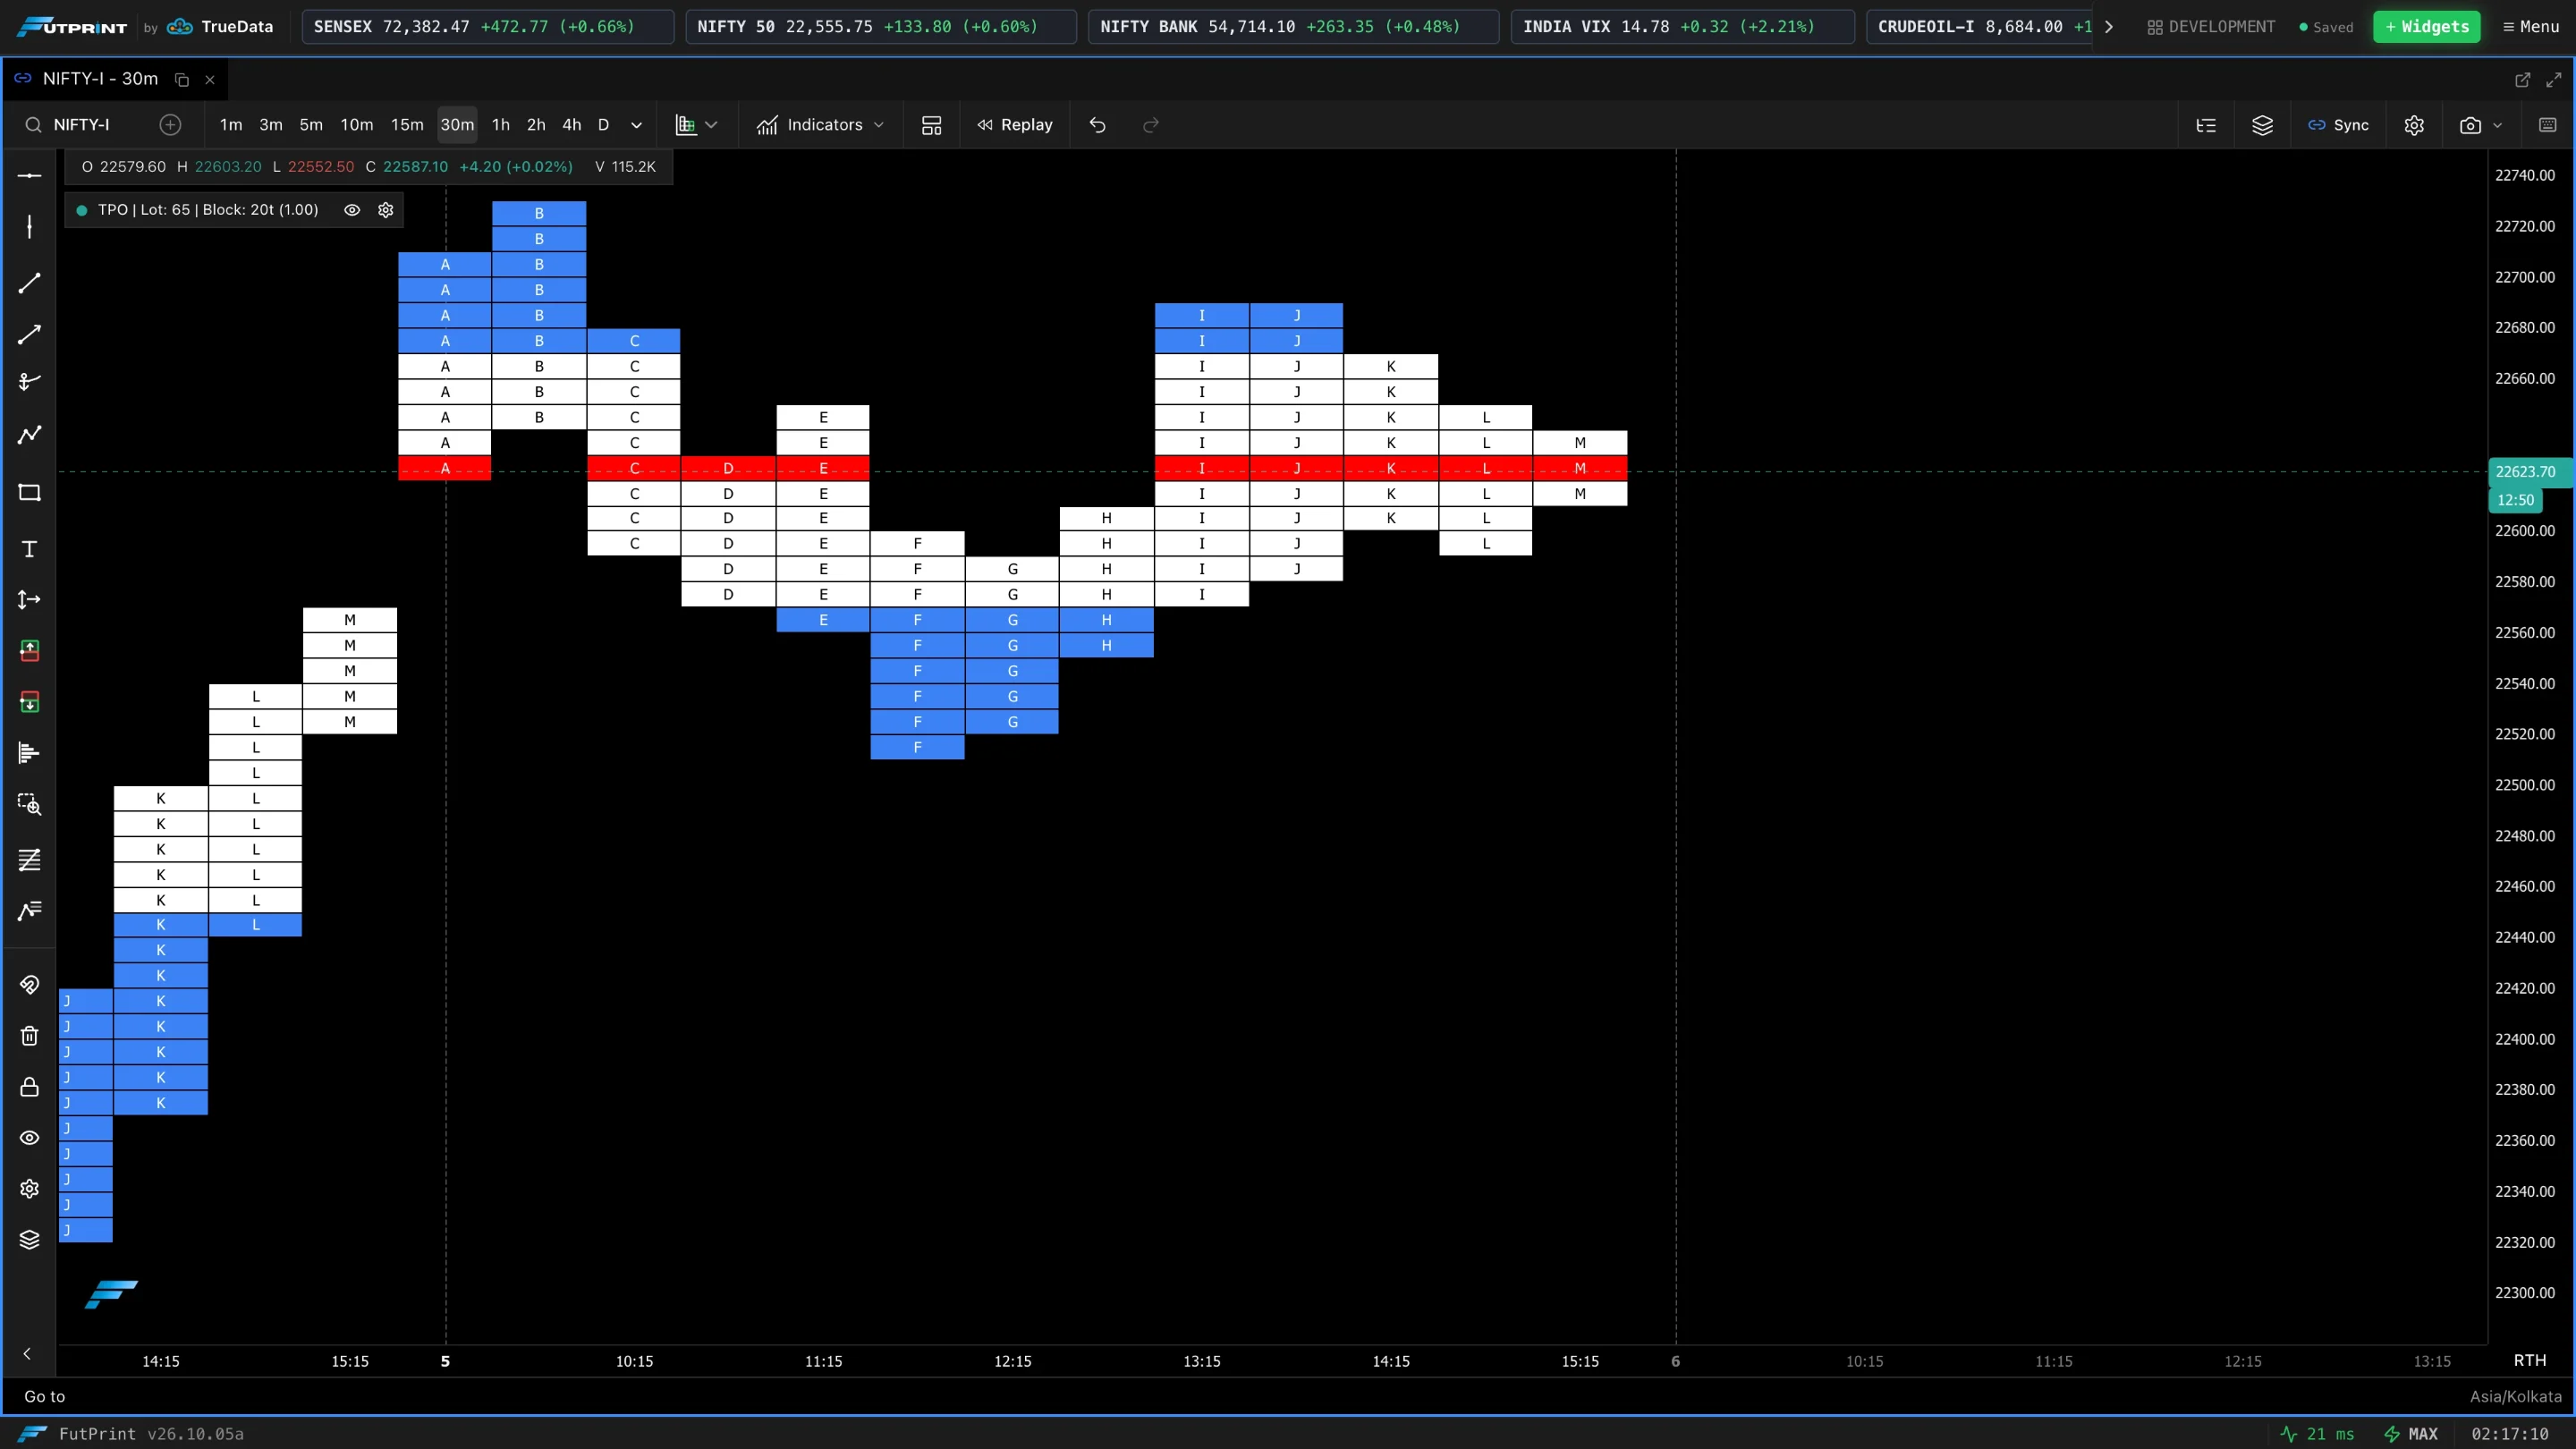
POC / VA Basis
Calculate the POC and value area from TPO Count (time) or from Volume allocated to each row.
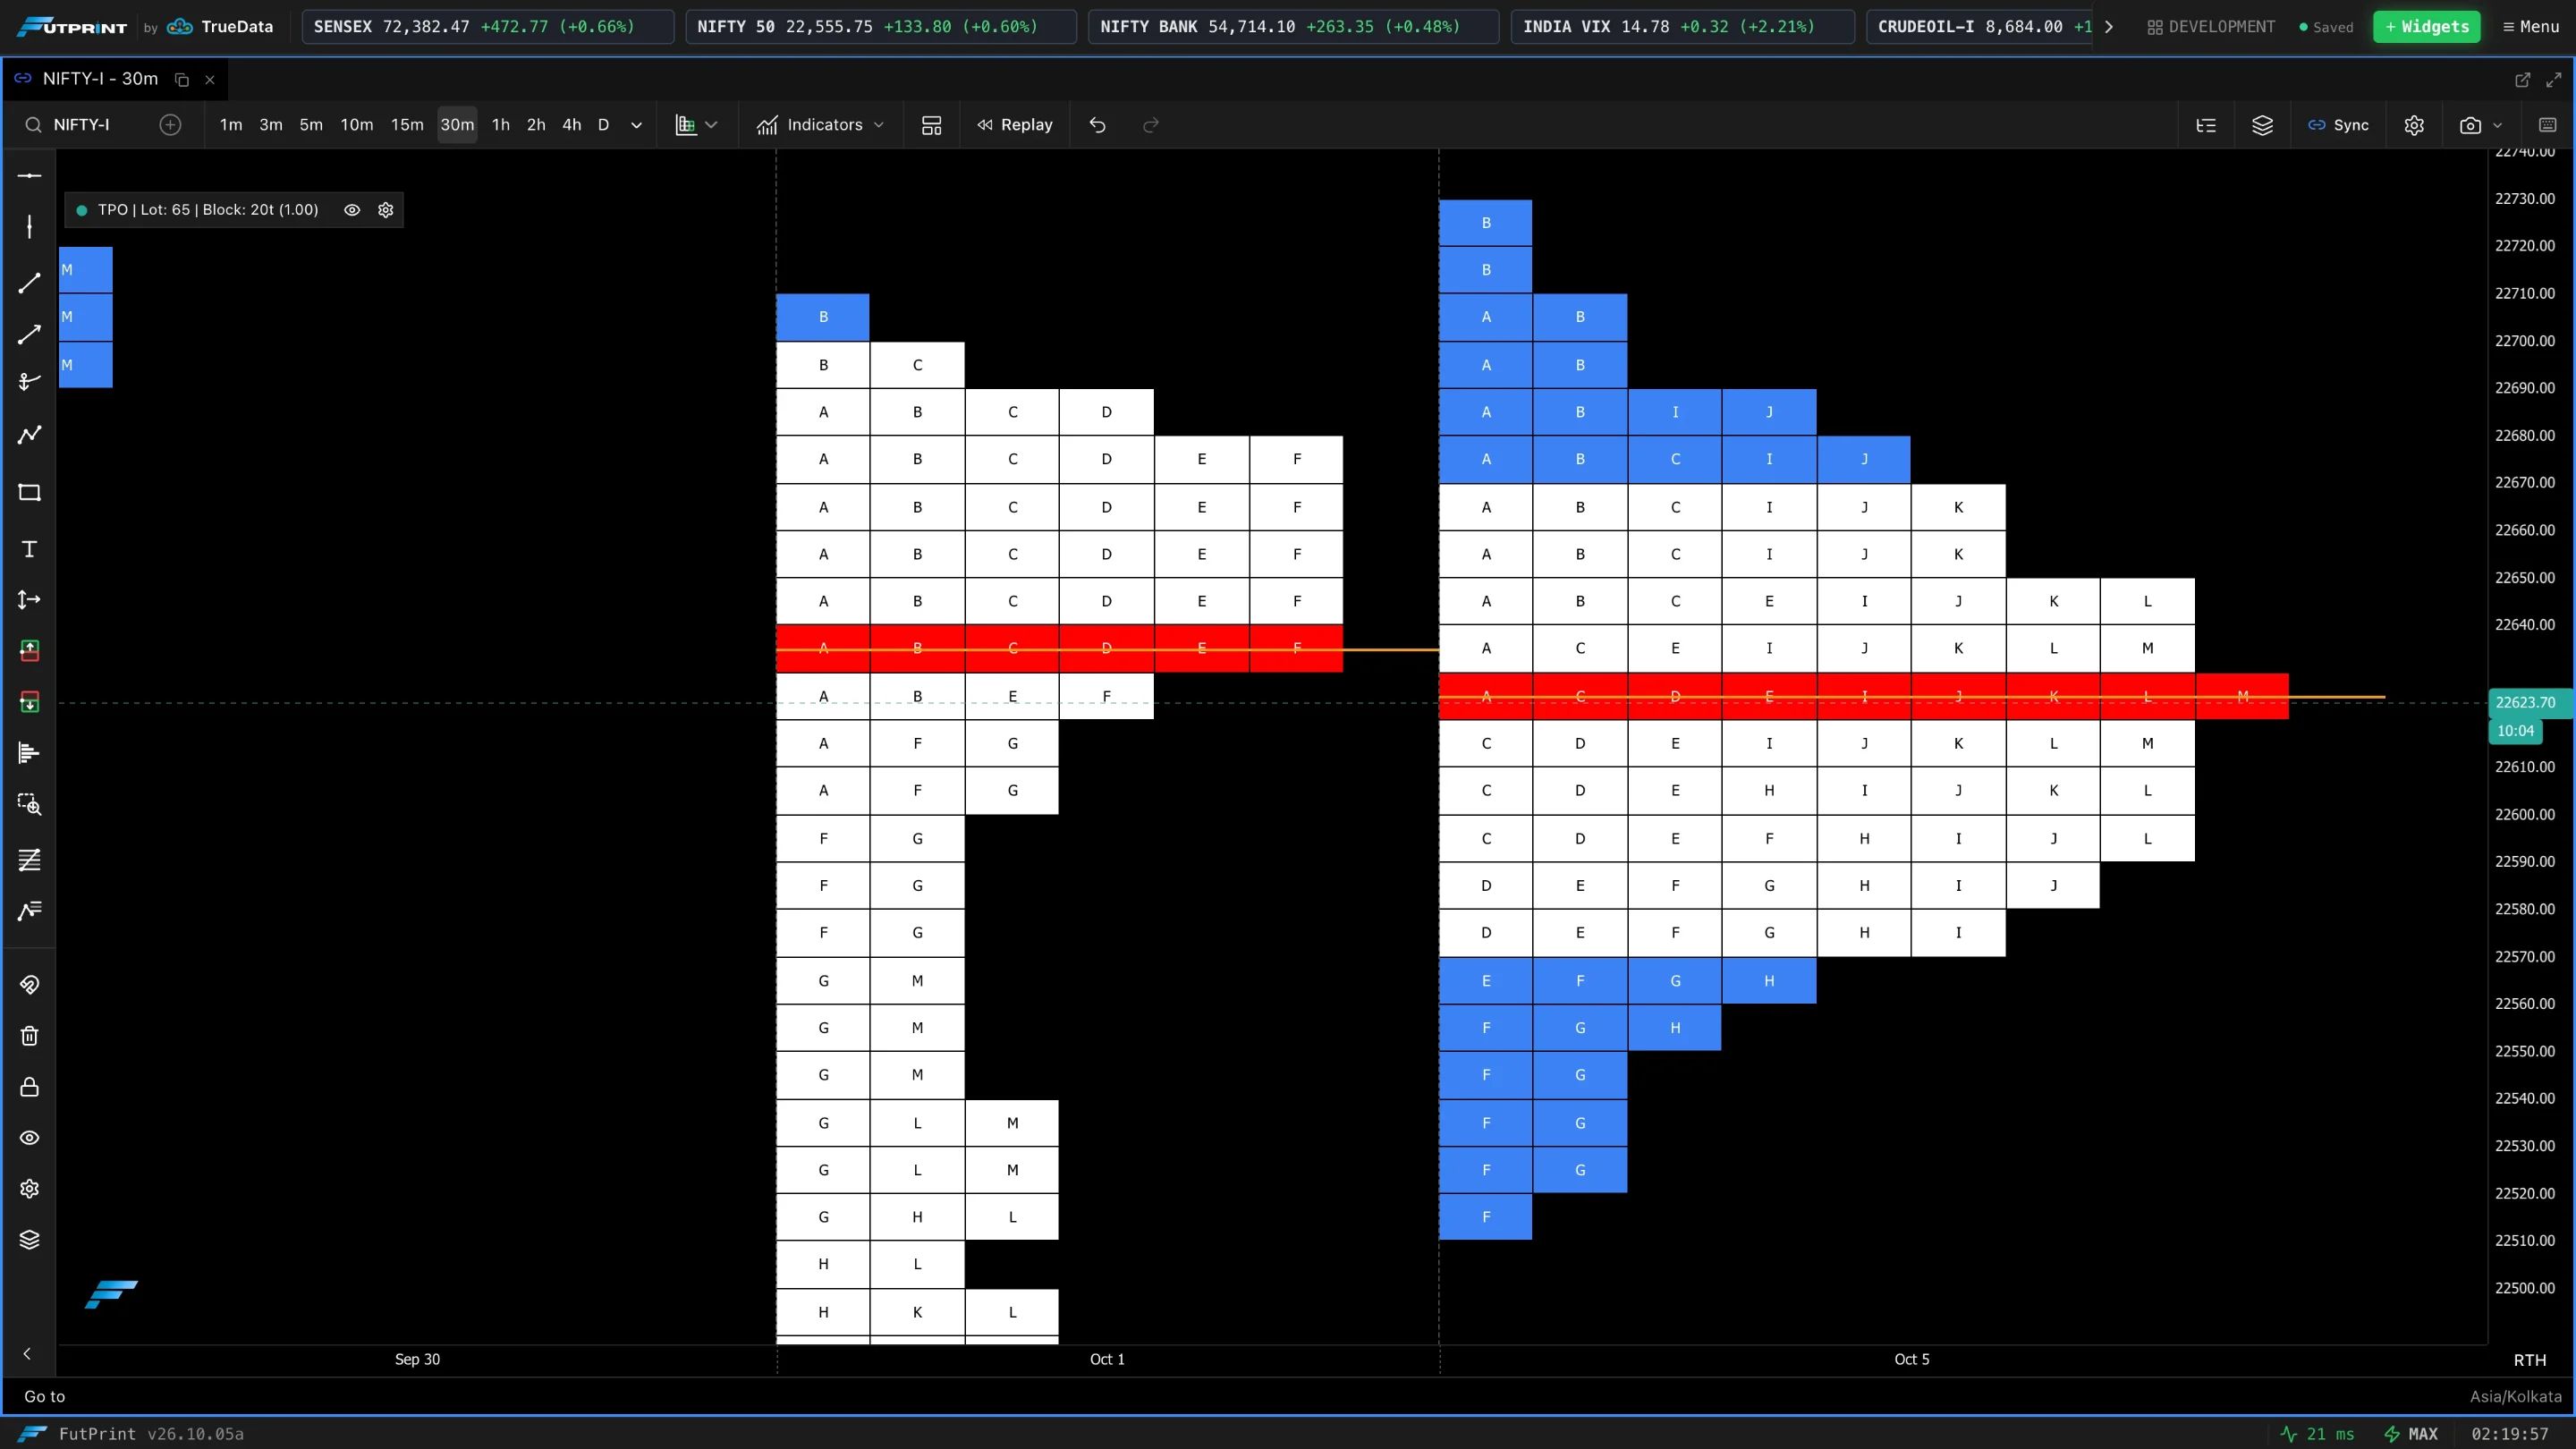
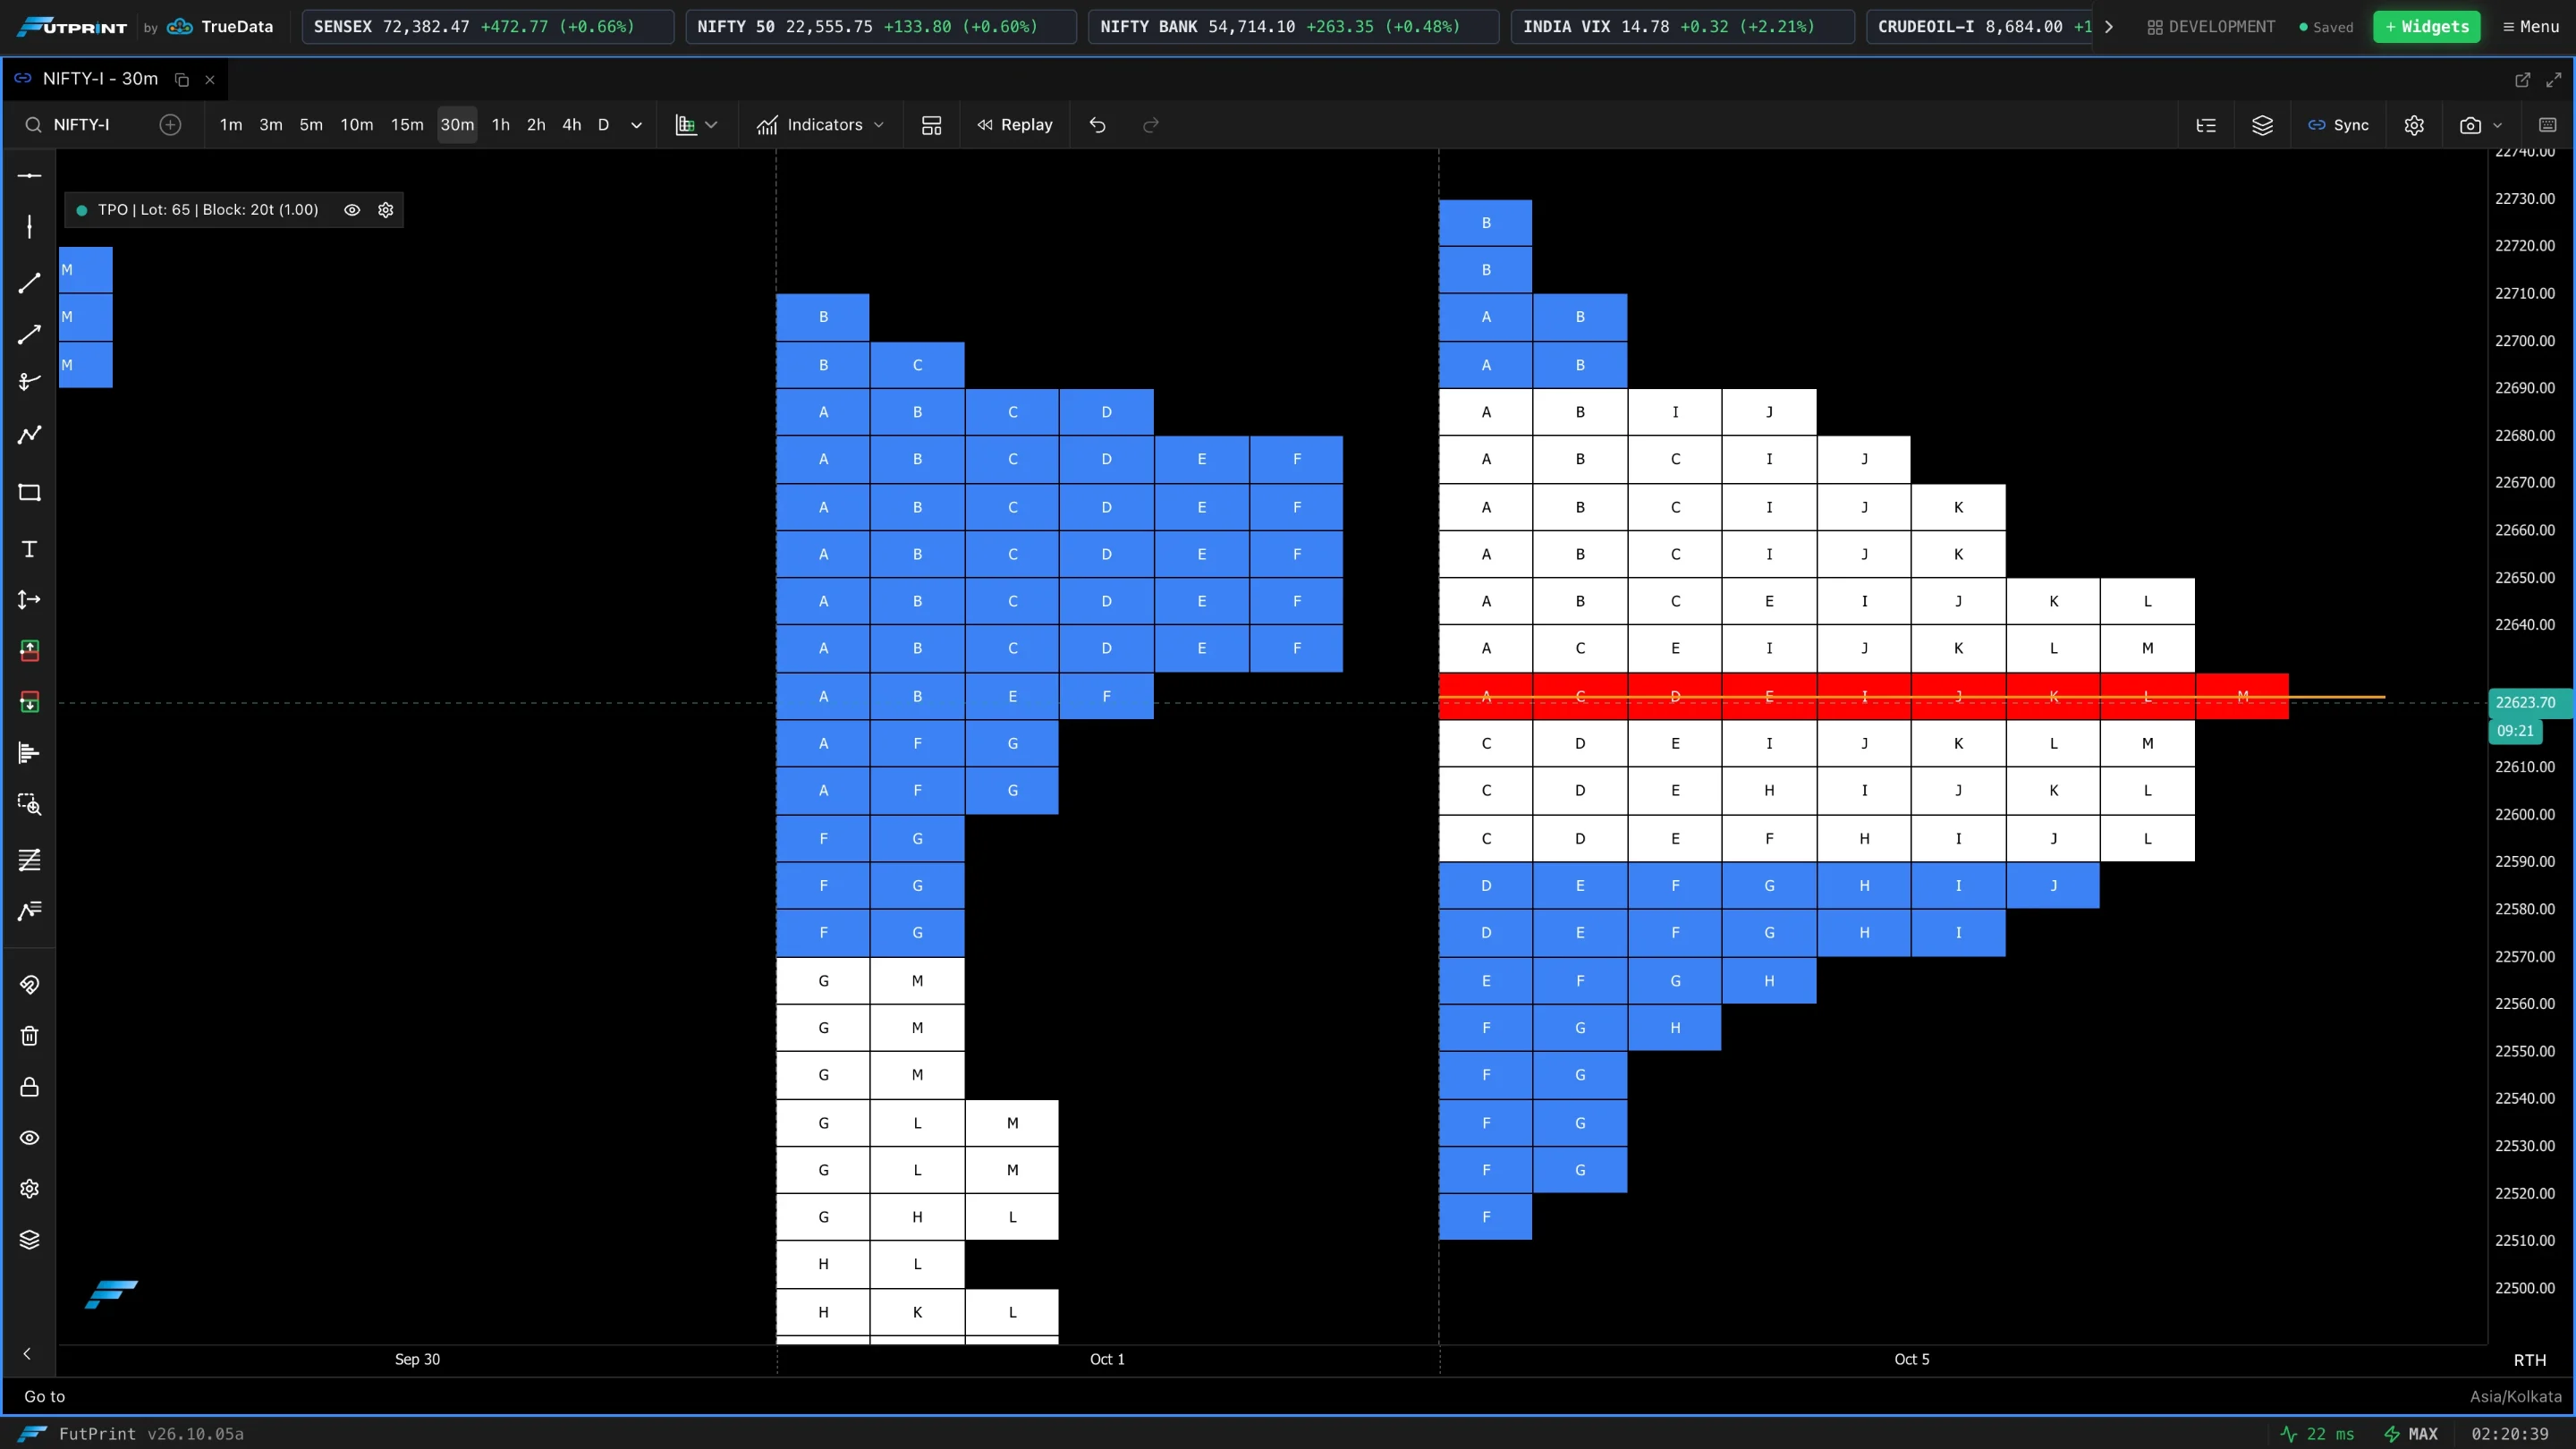
Enable Level Extensions
The master switch for extending POC and value-area levels beyond their own profile. The Extend Naked POC and Extend Naked VA options below only take effect while it is on.
Block Appearance
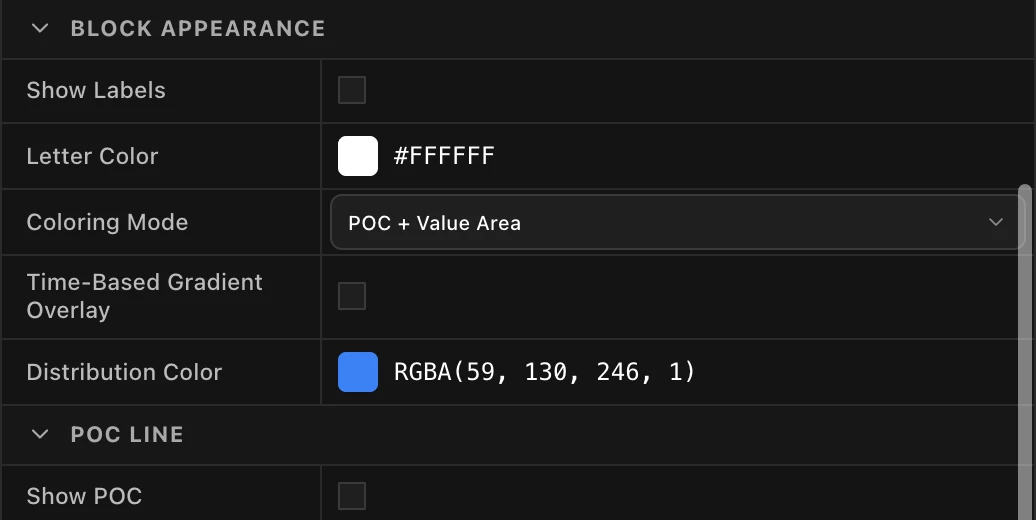
Show Labels and Letter Color
Show Labels prints the letter on each block. Letter Color sets its colour; where that colour would be unreadable on a block, the letter switches to black or white automatically.
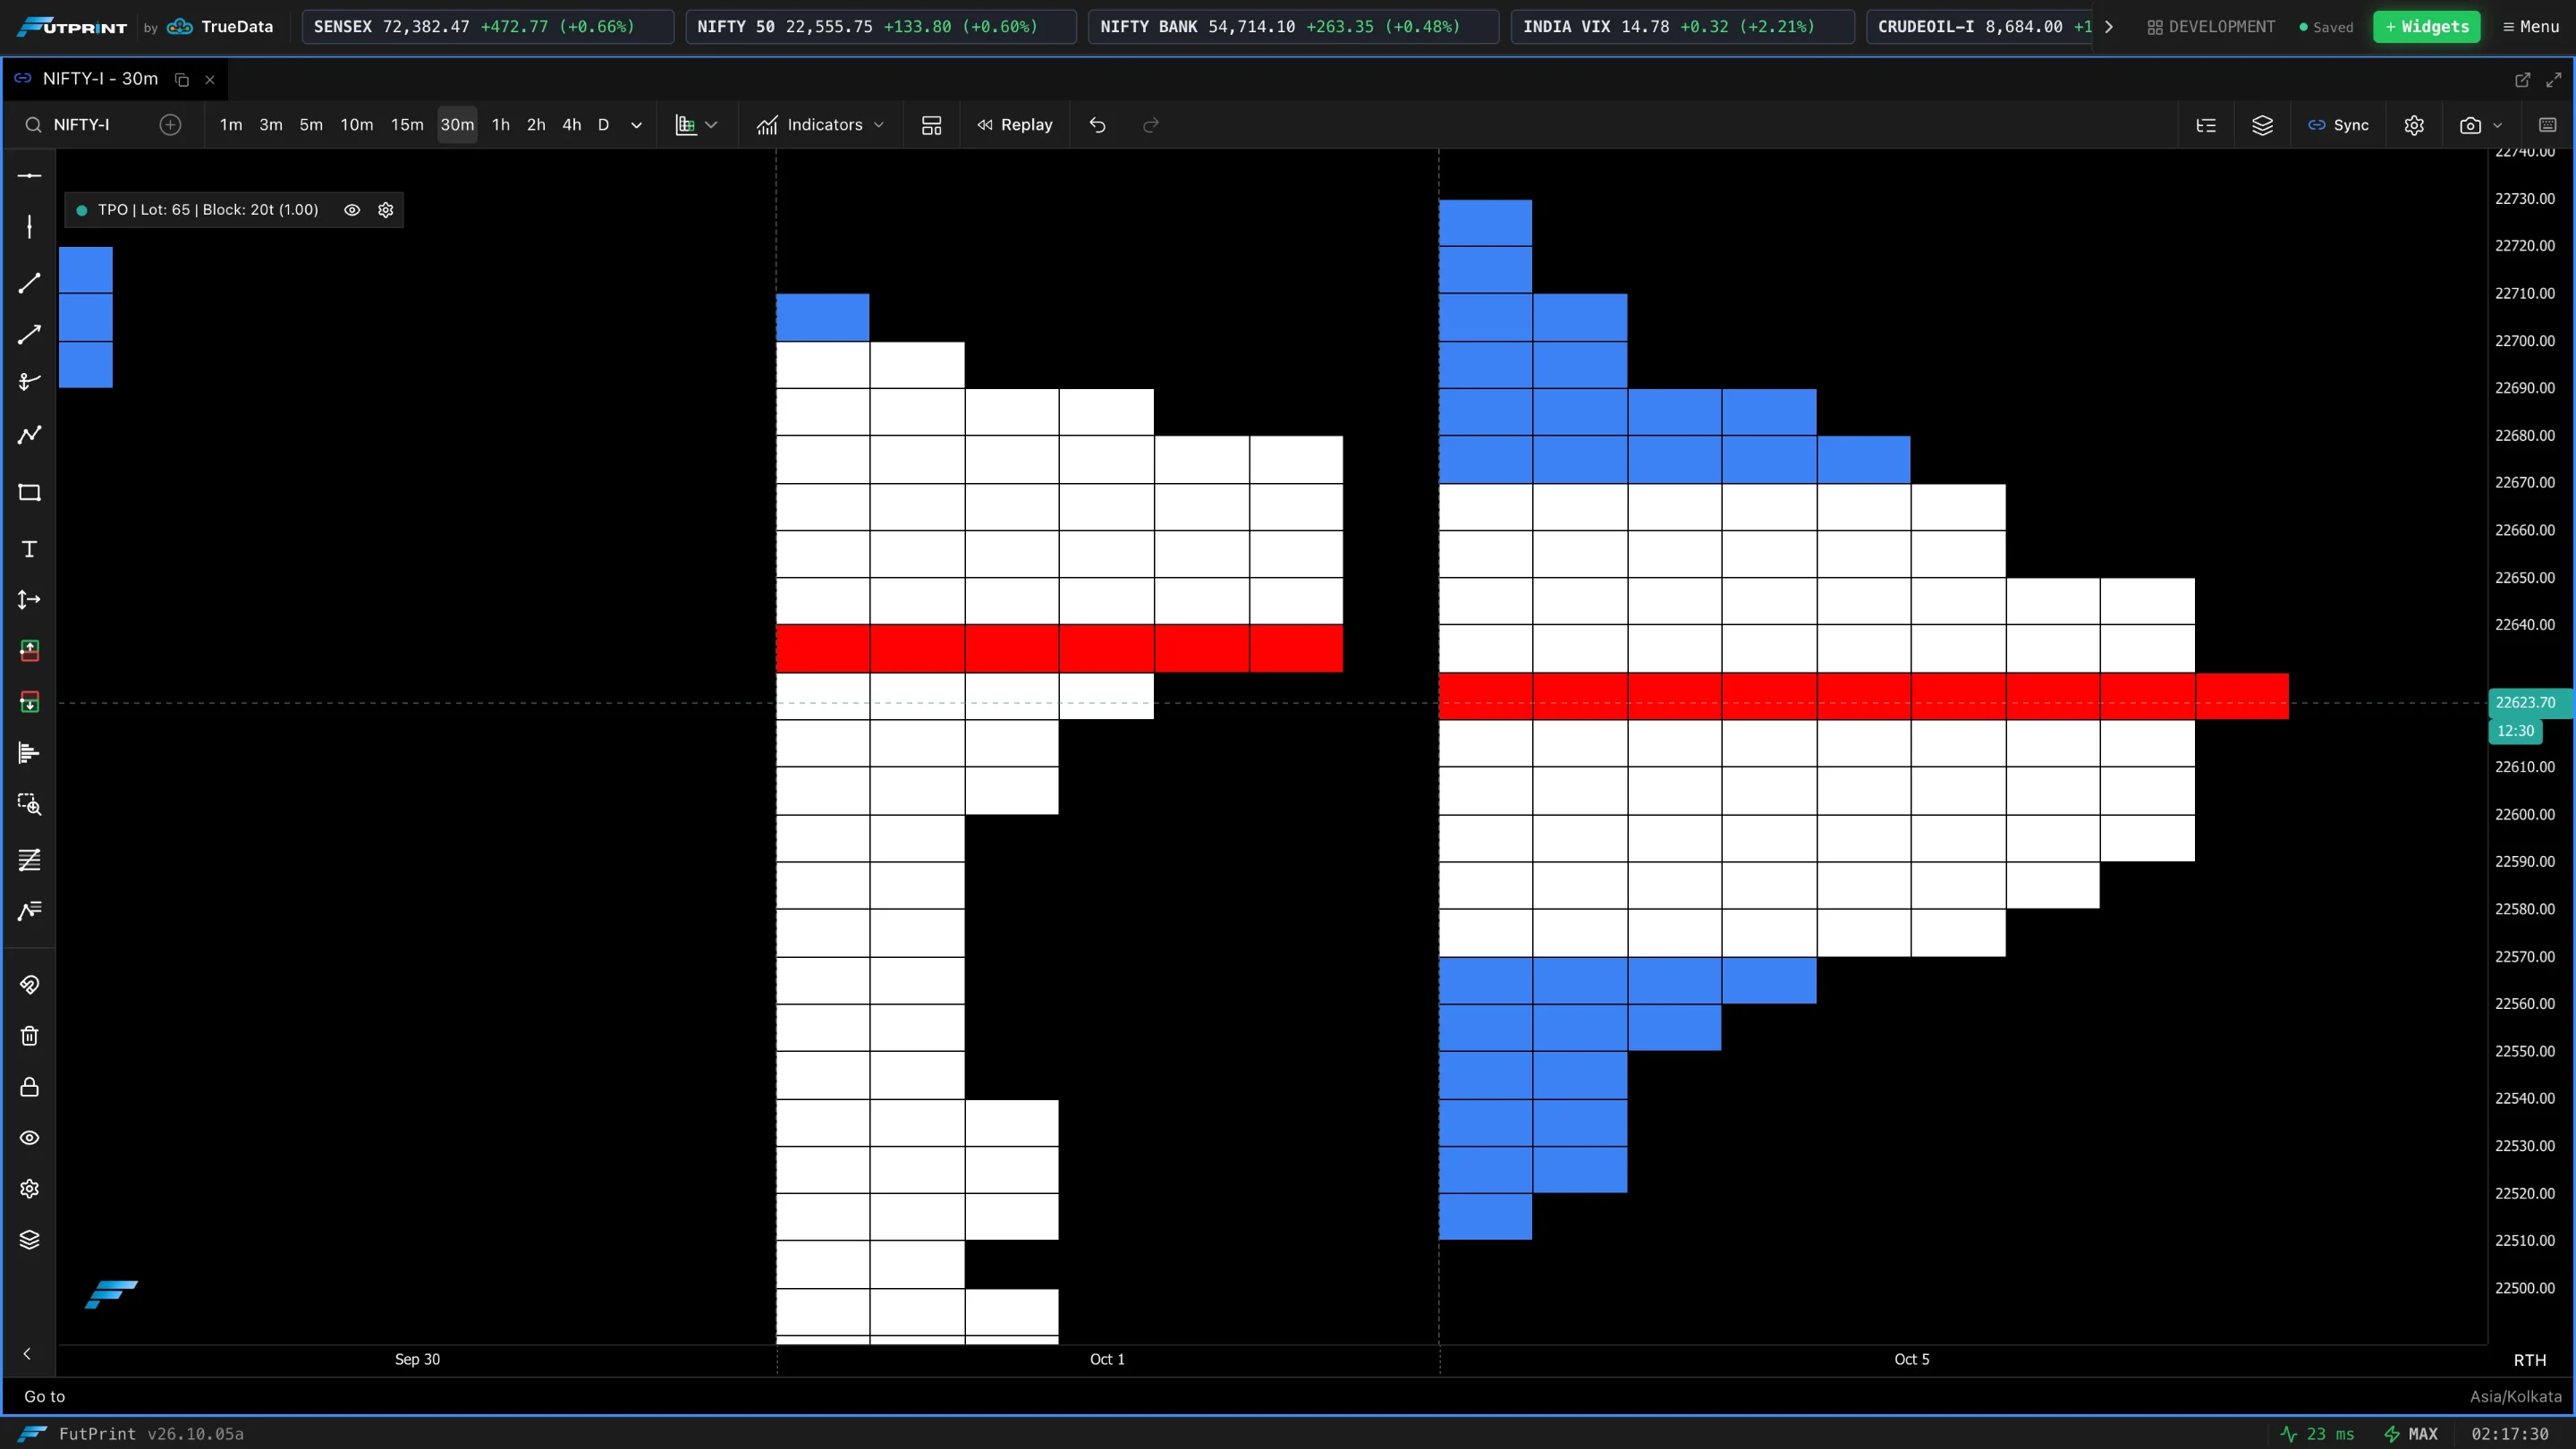
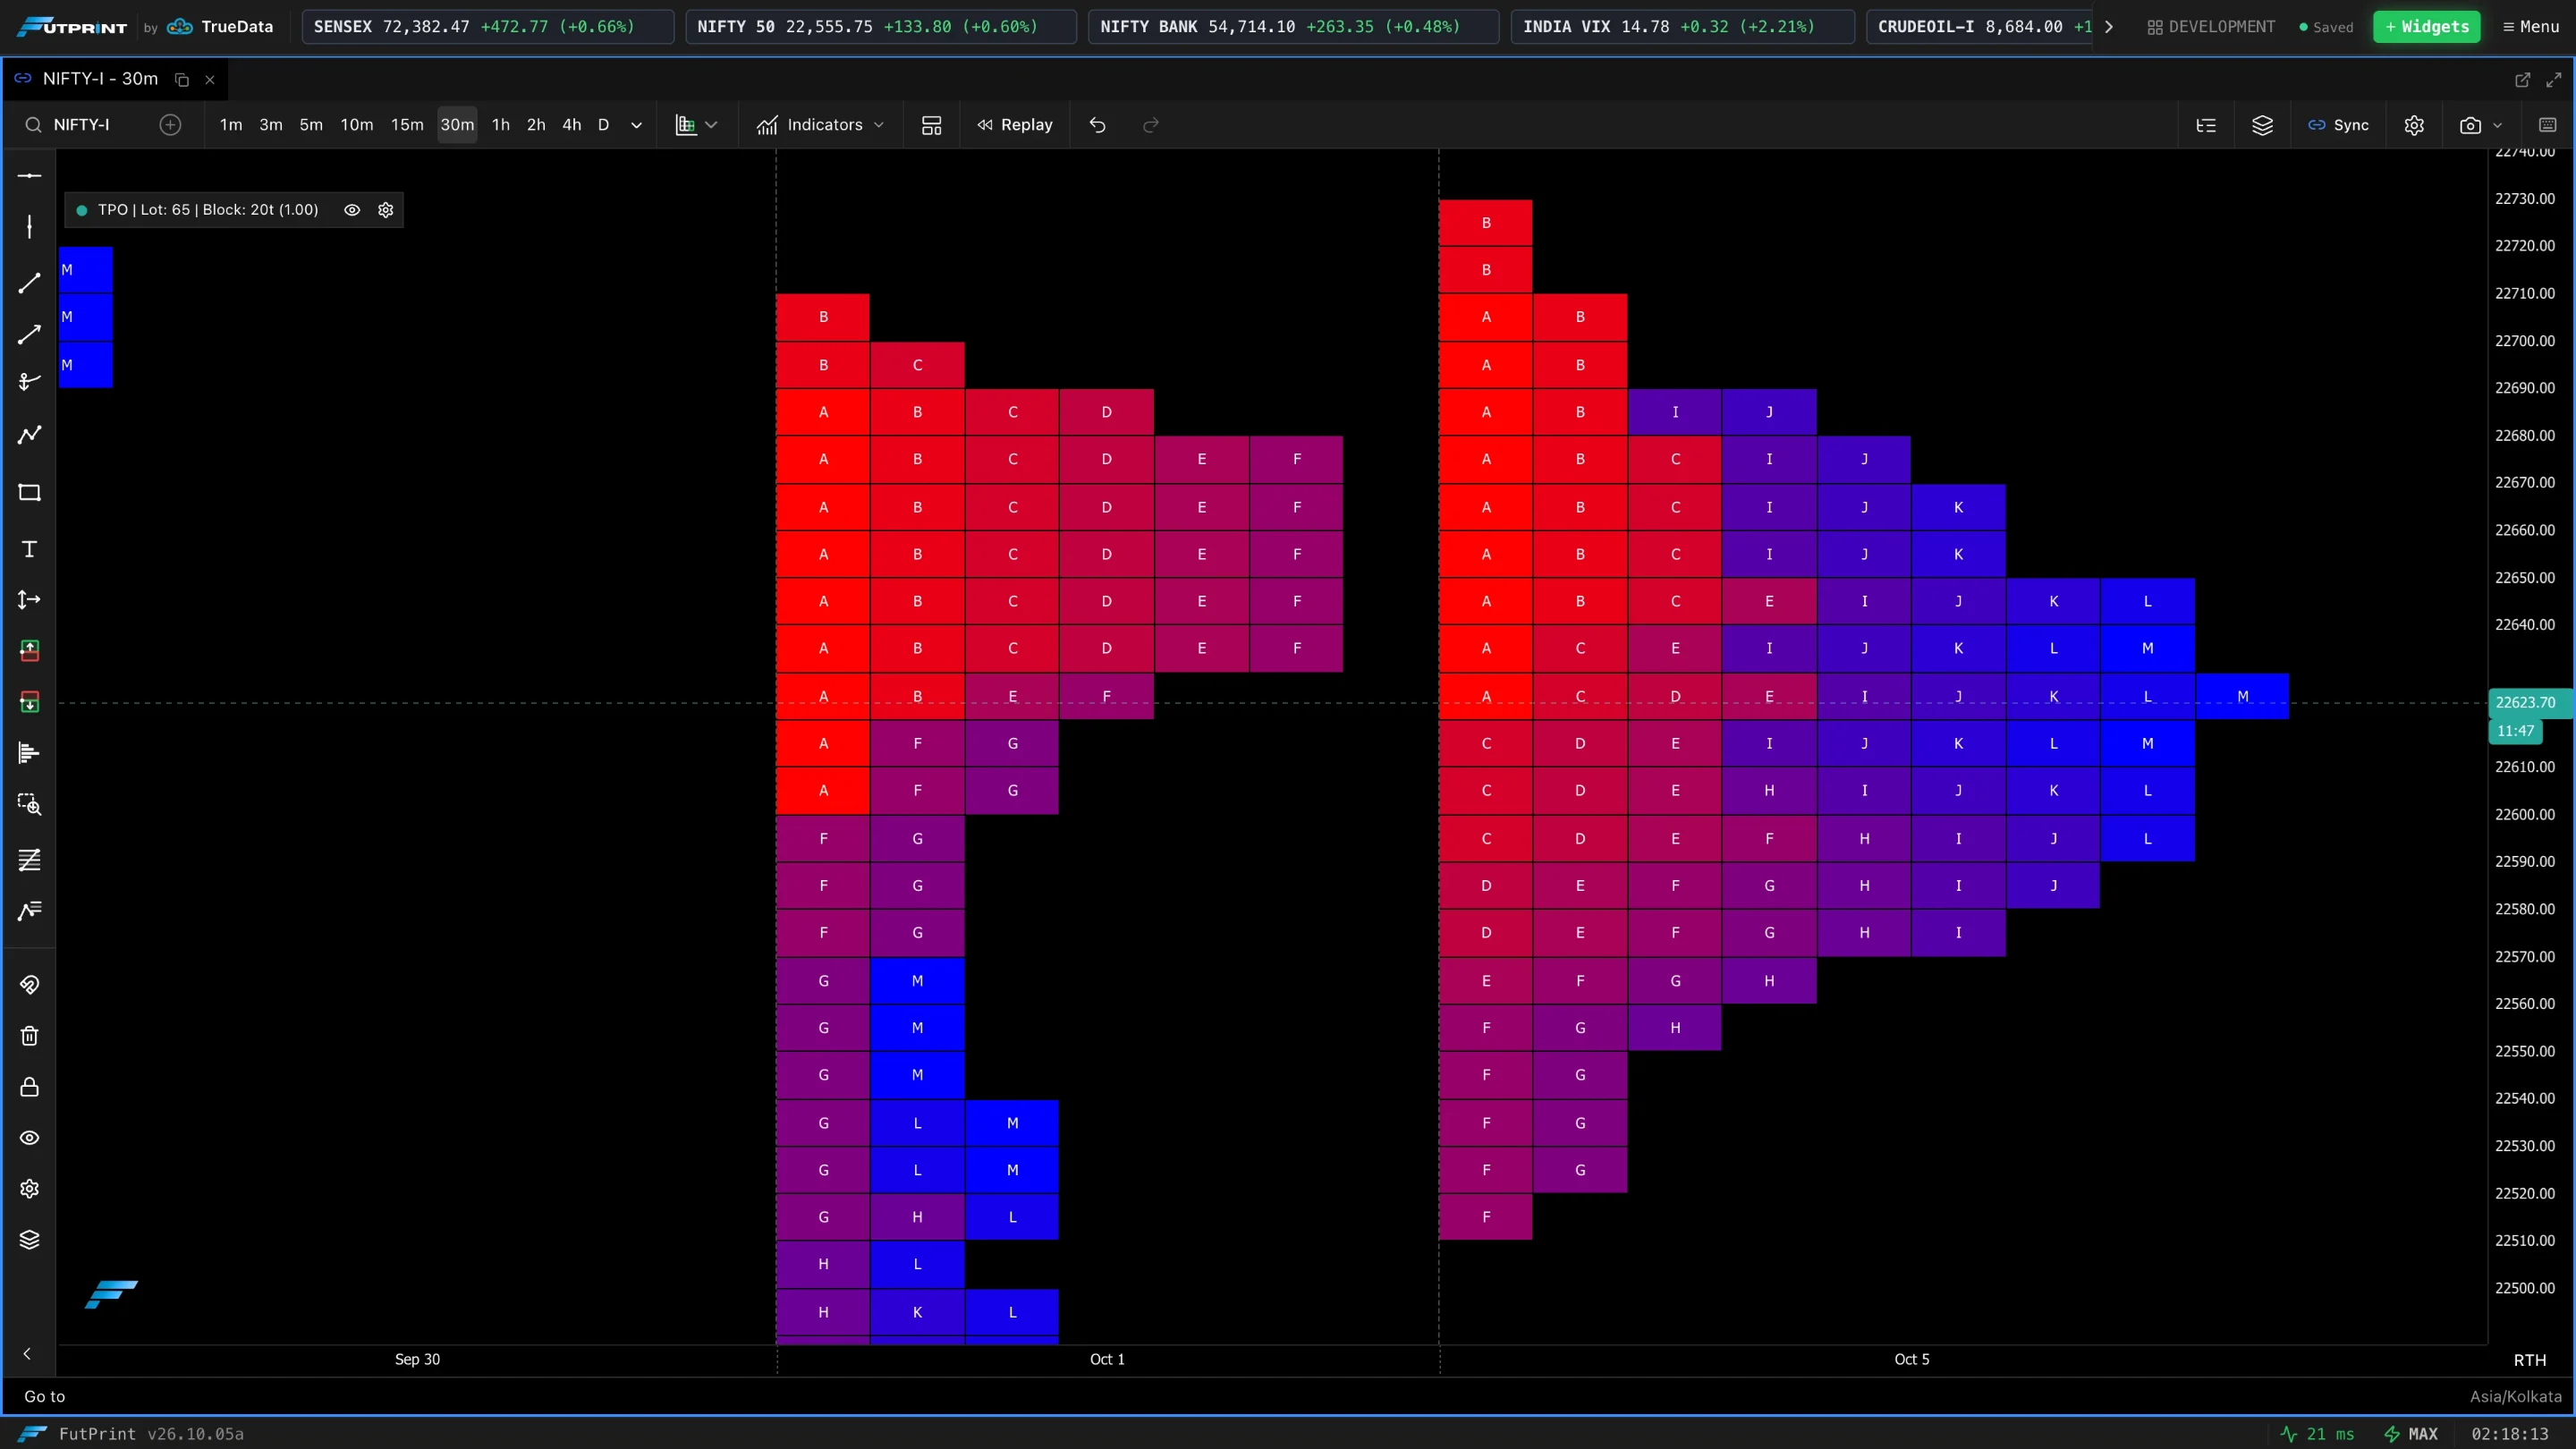
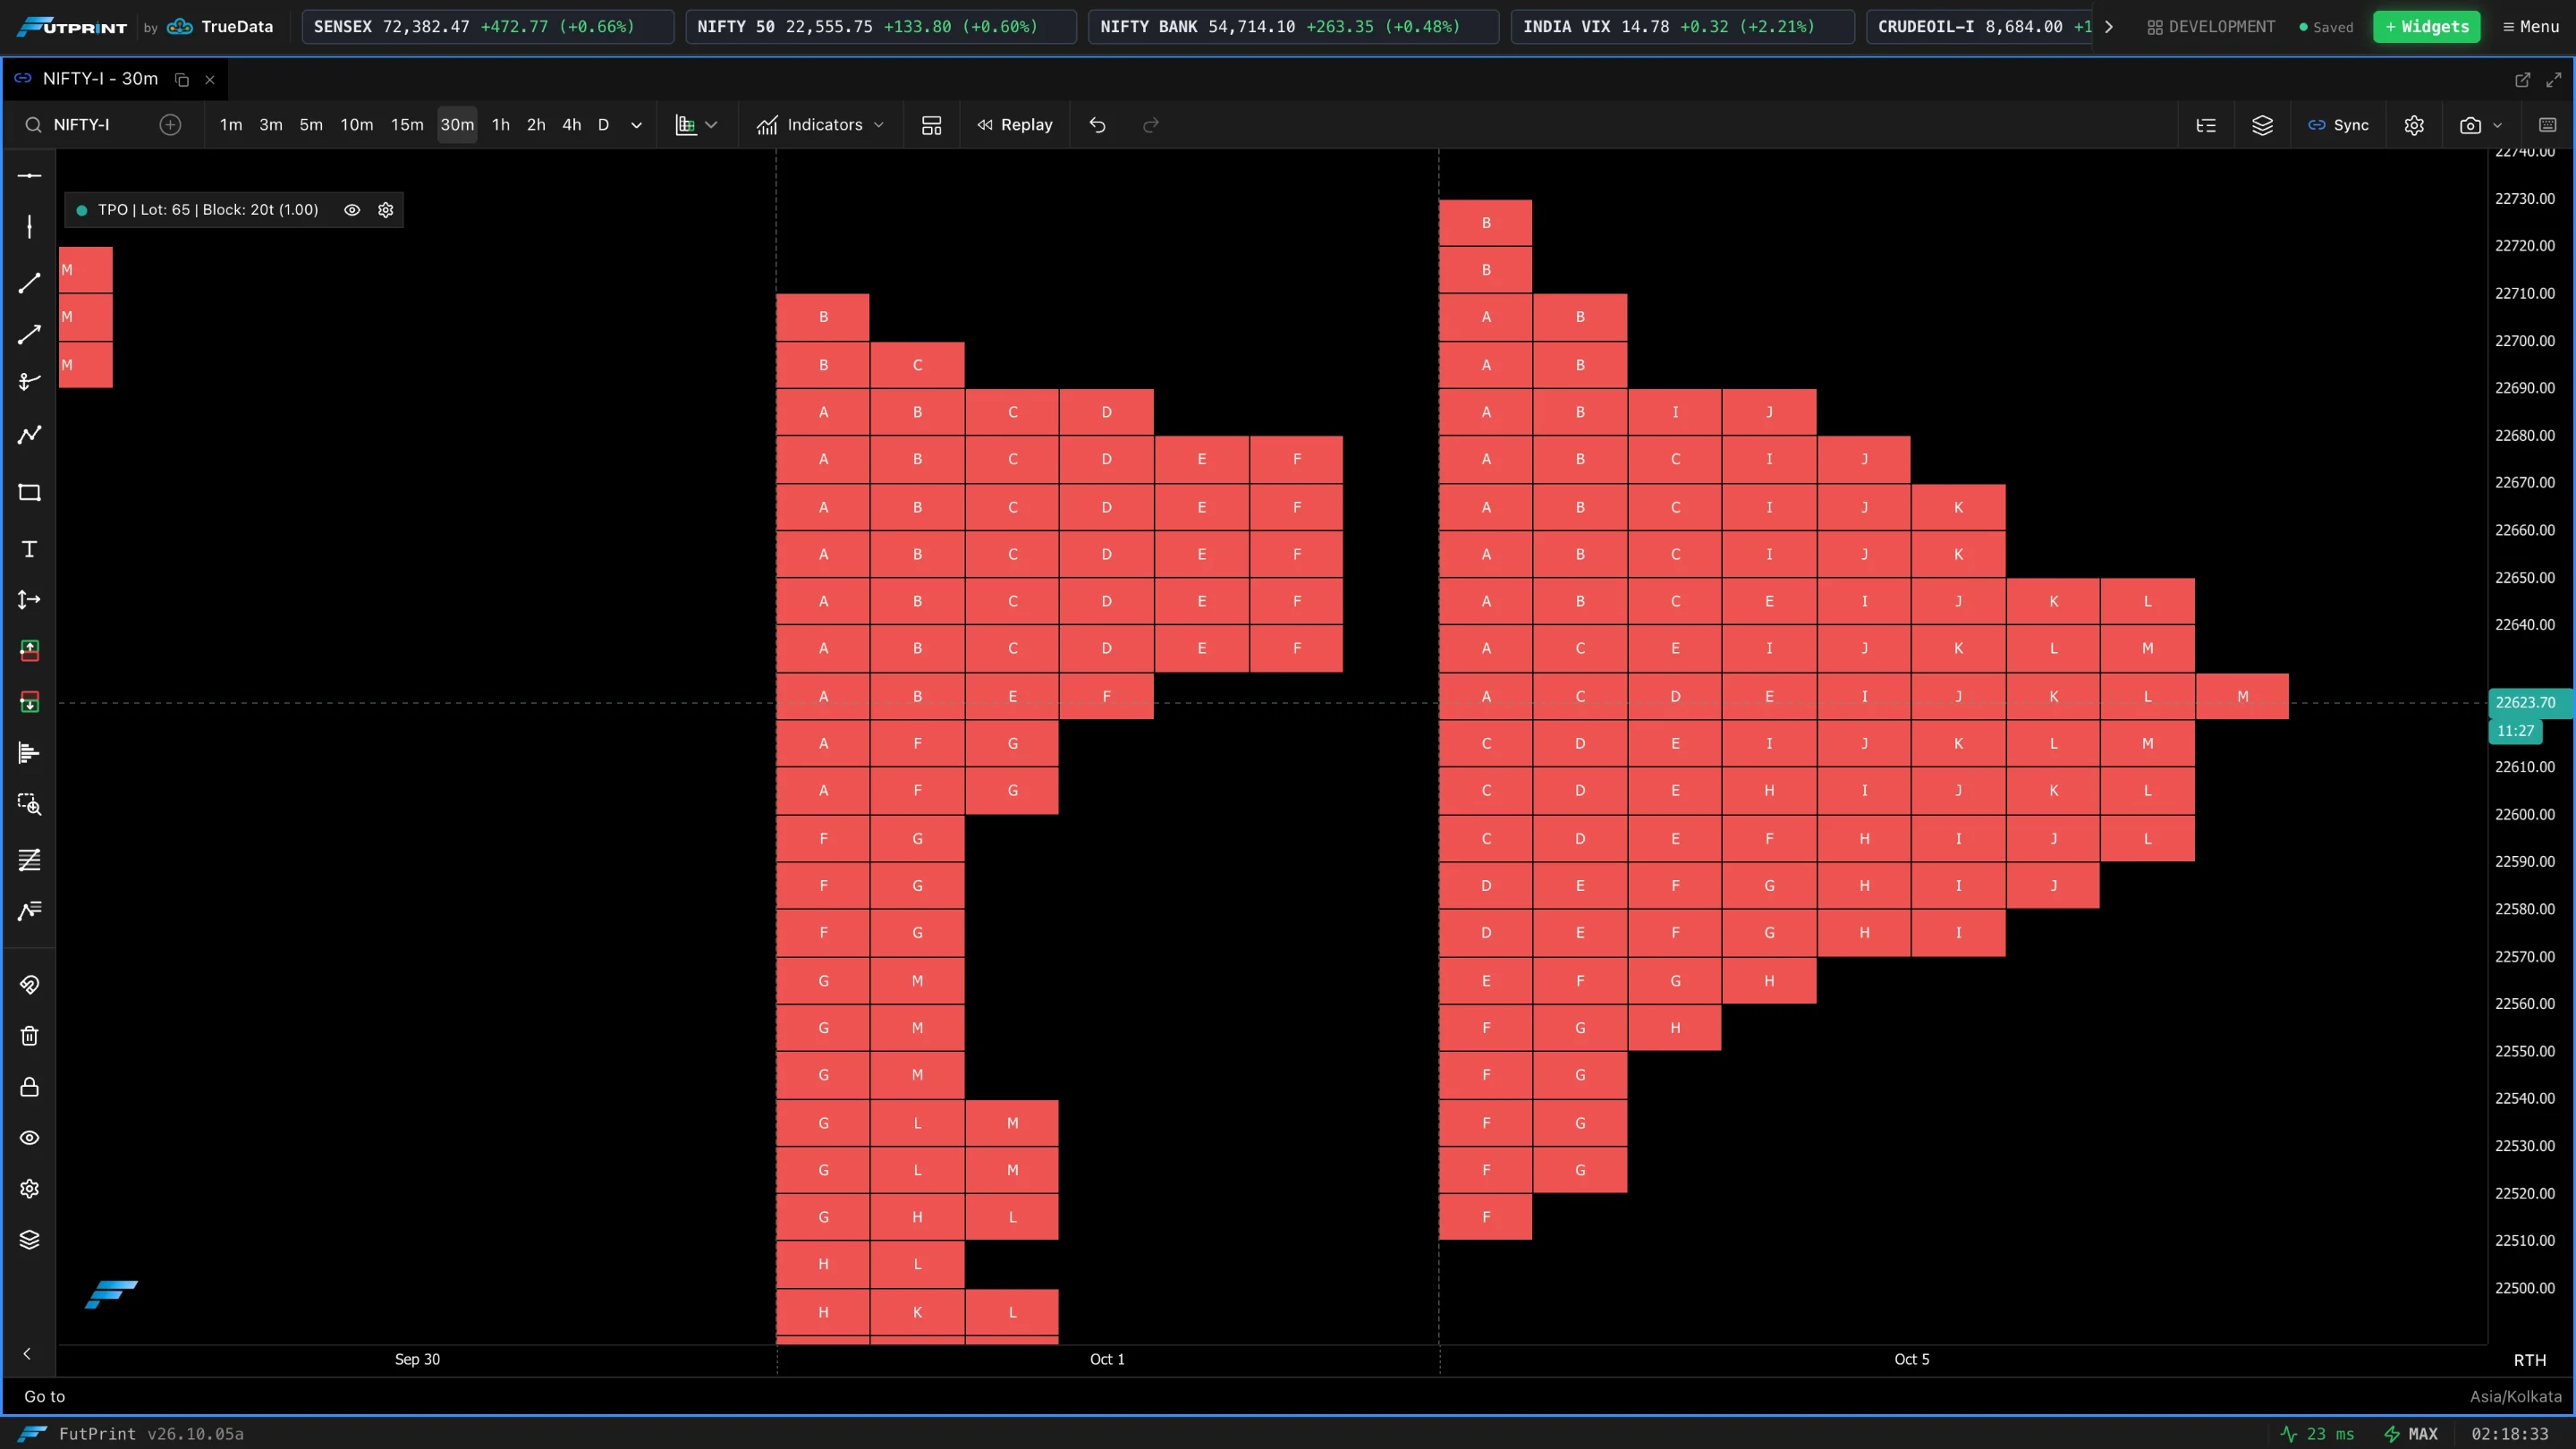
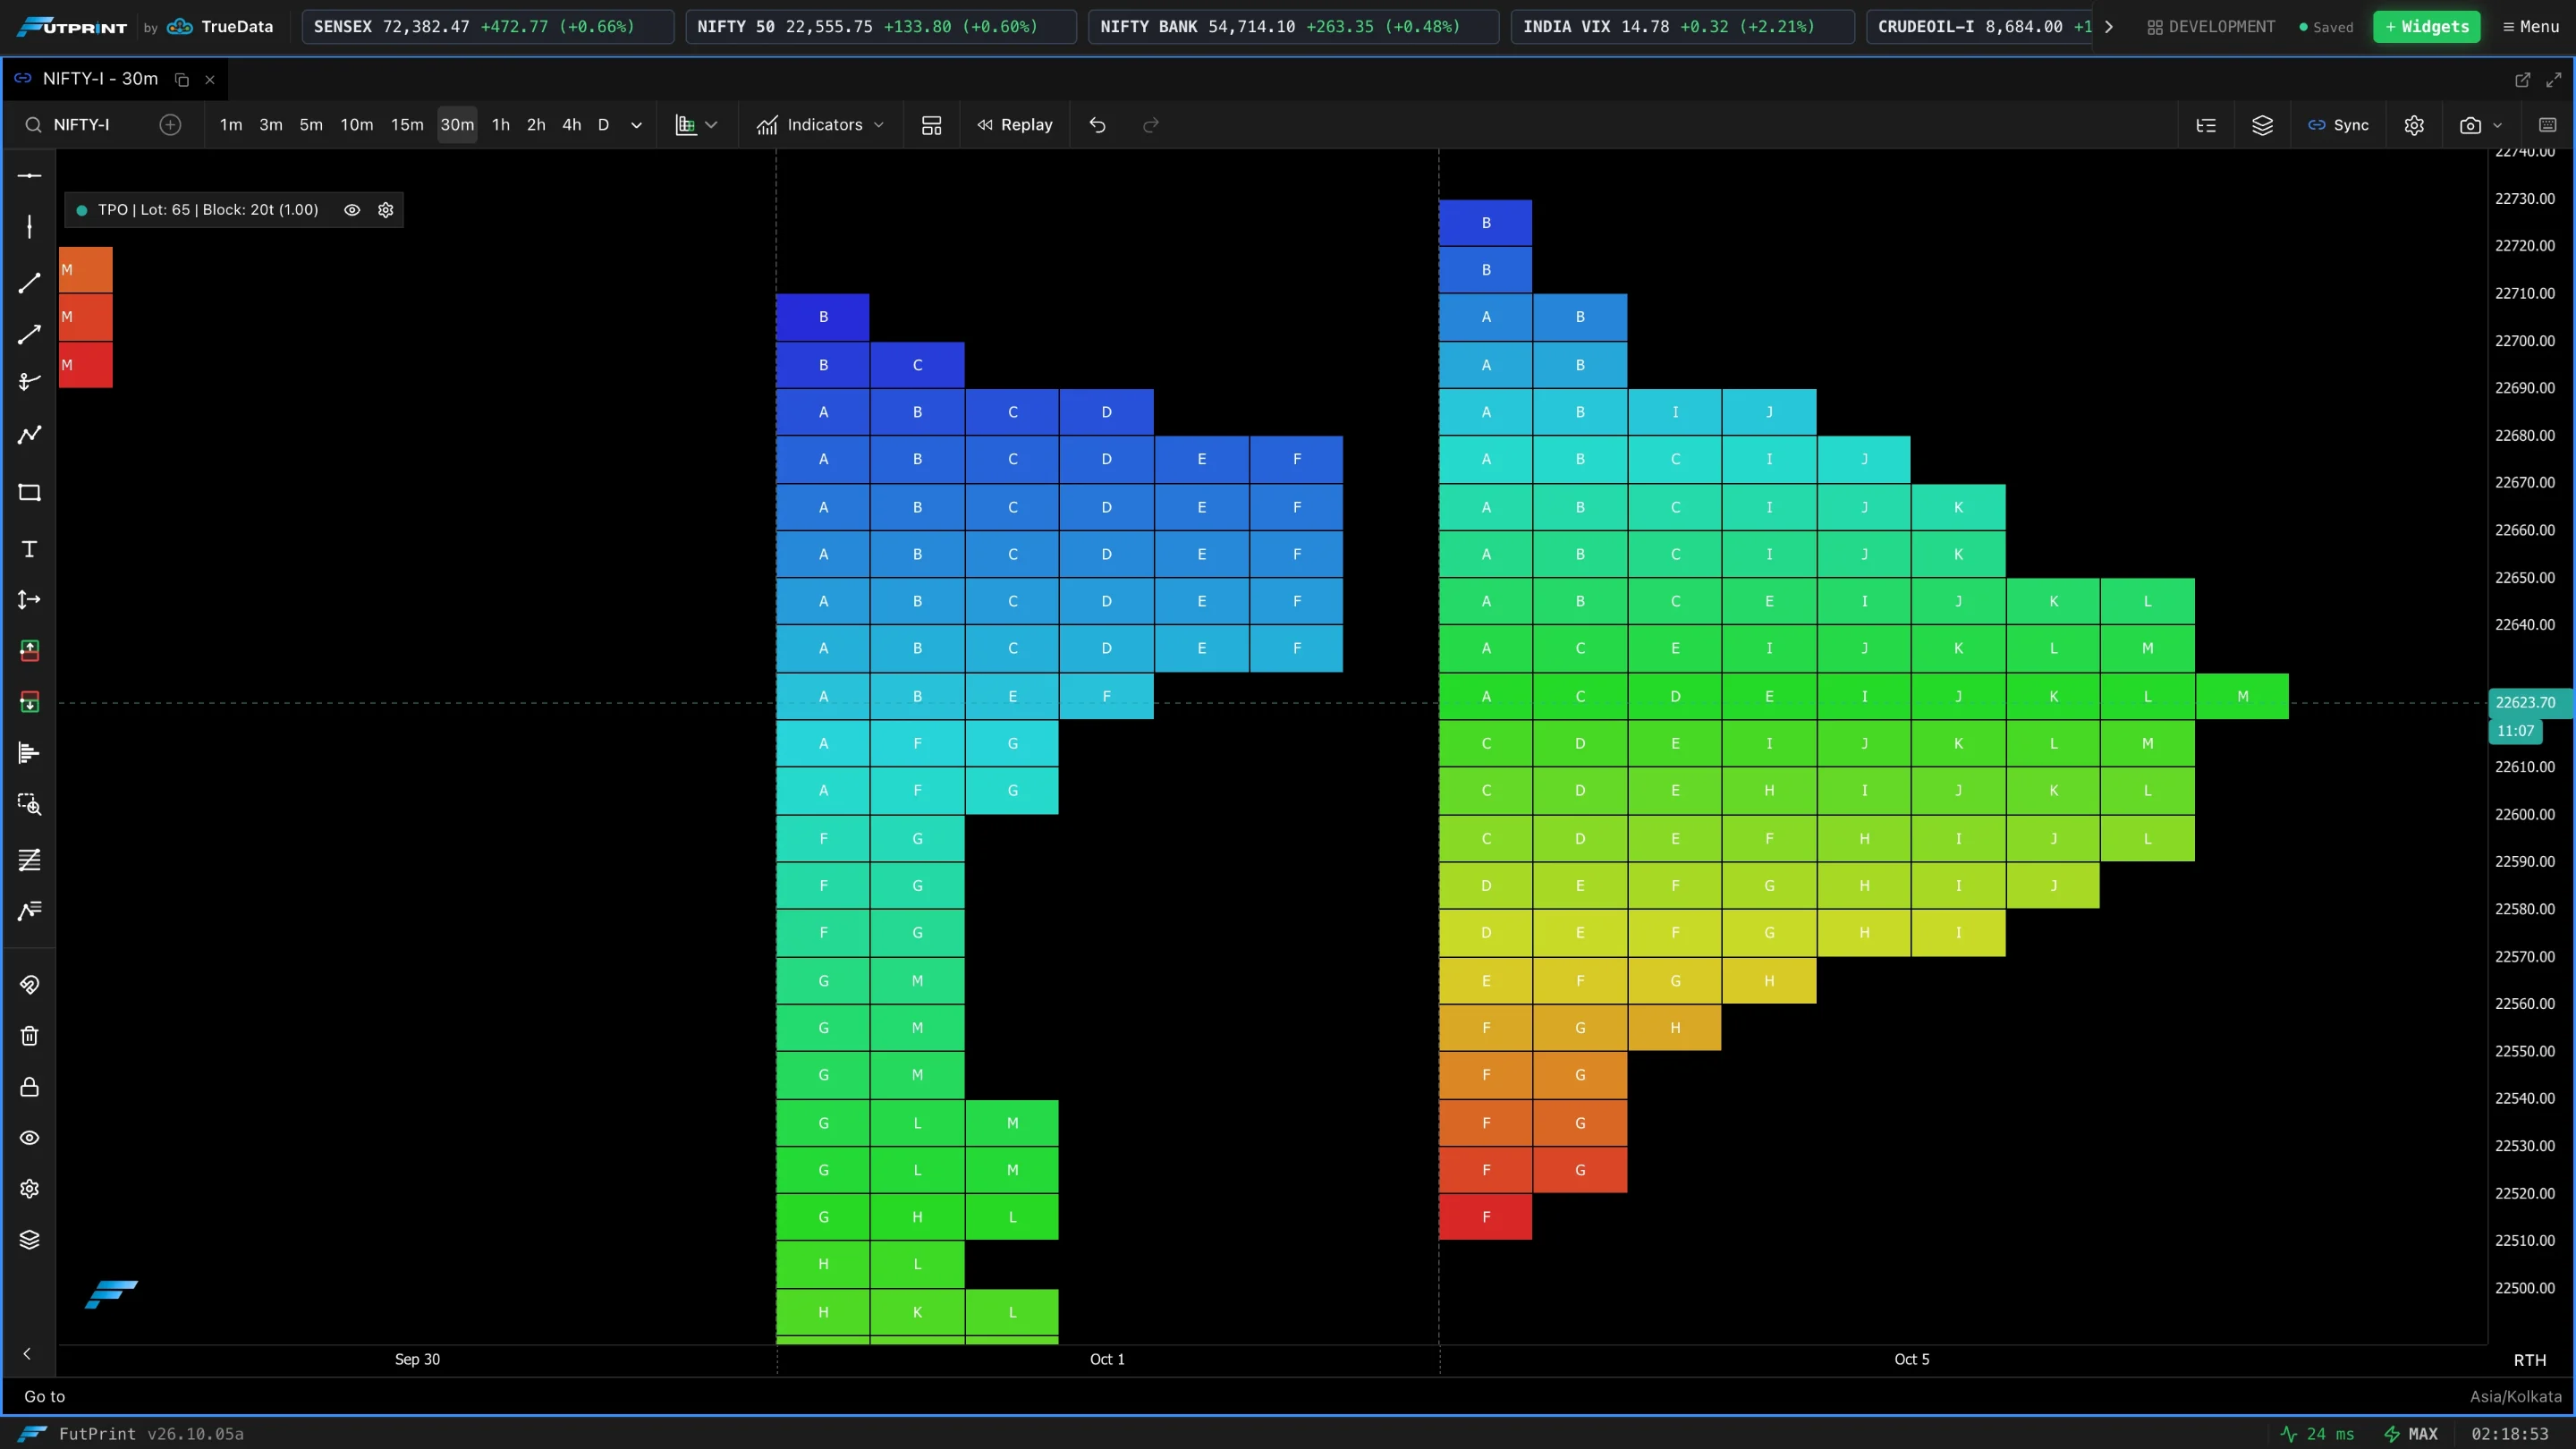
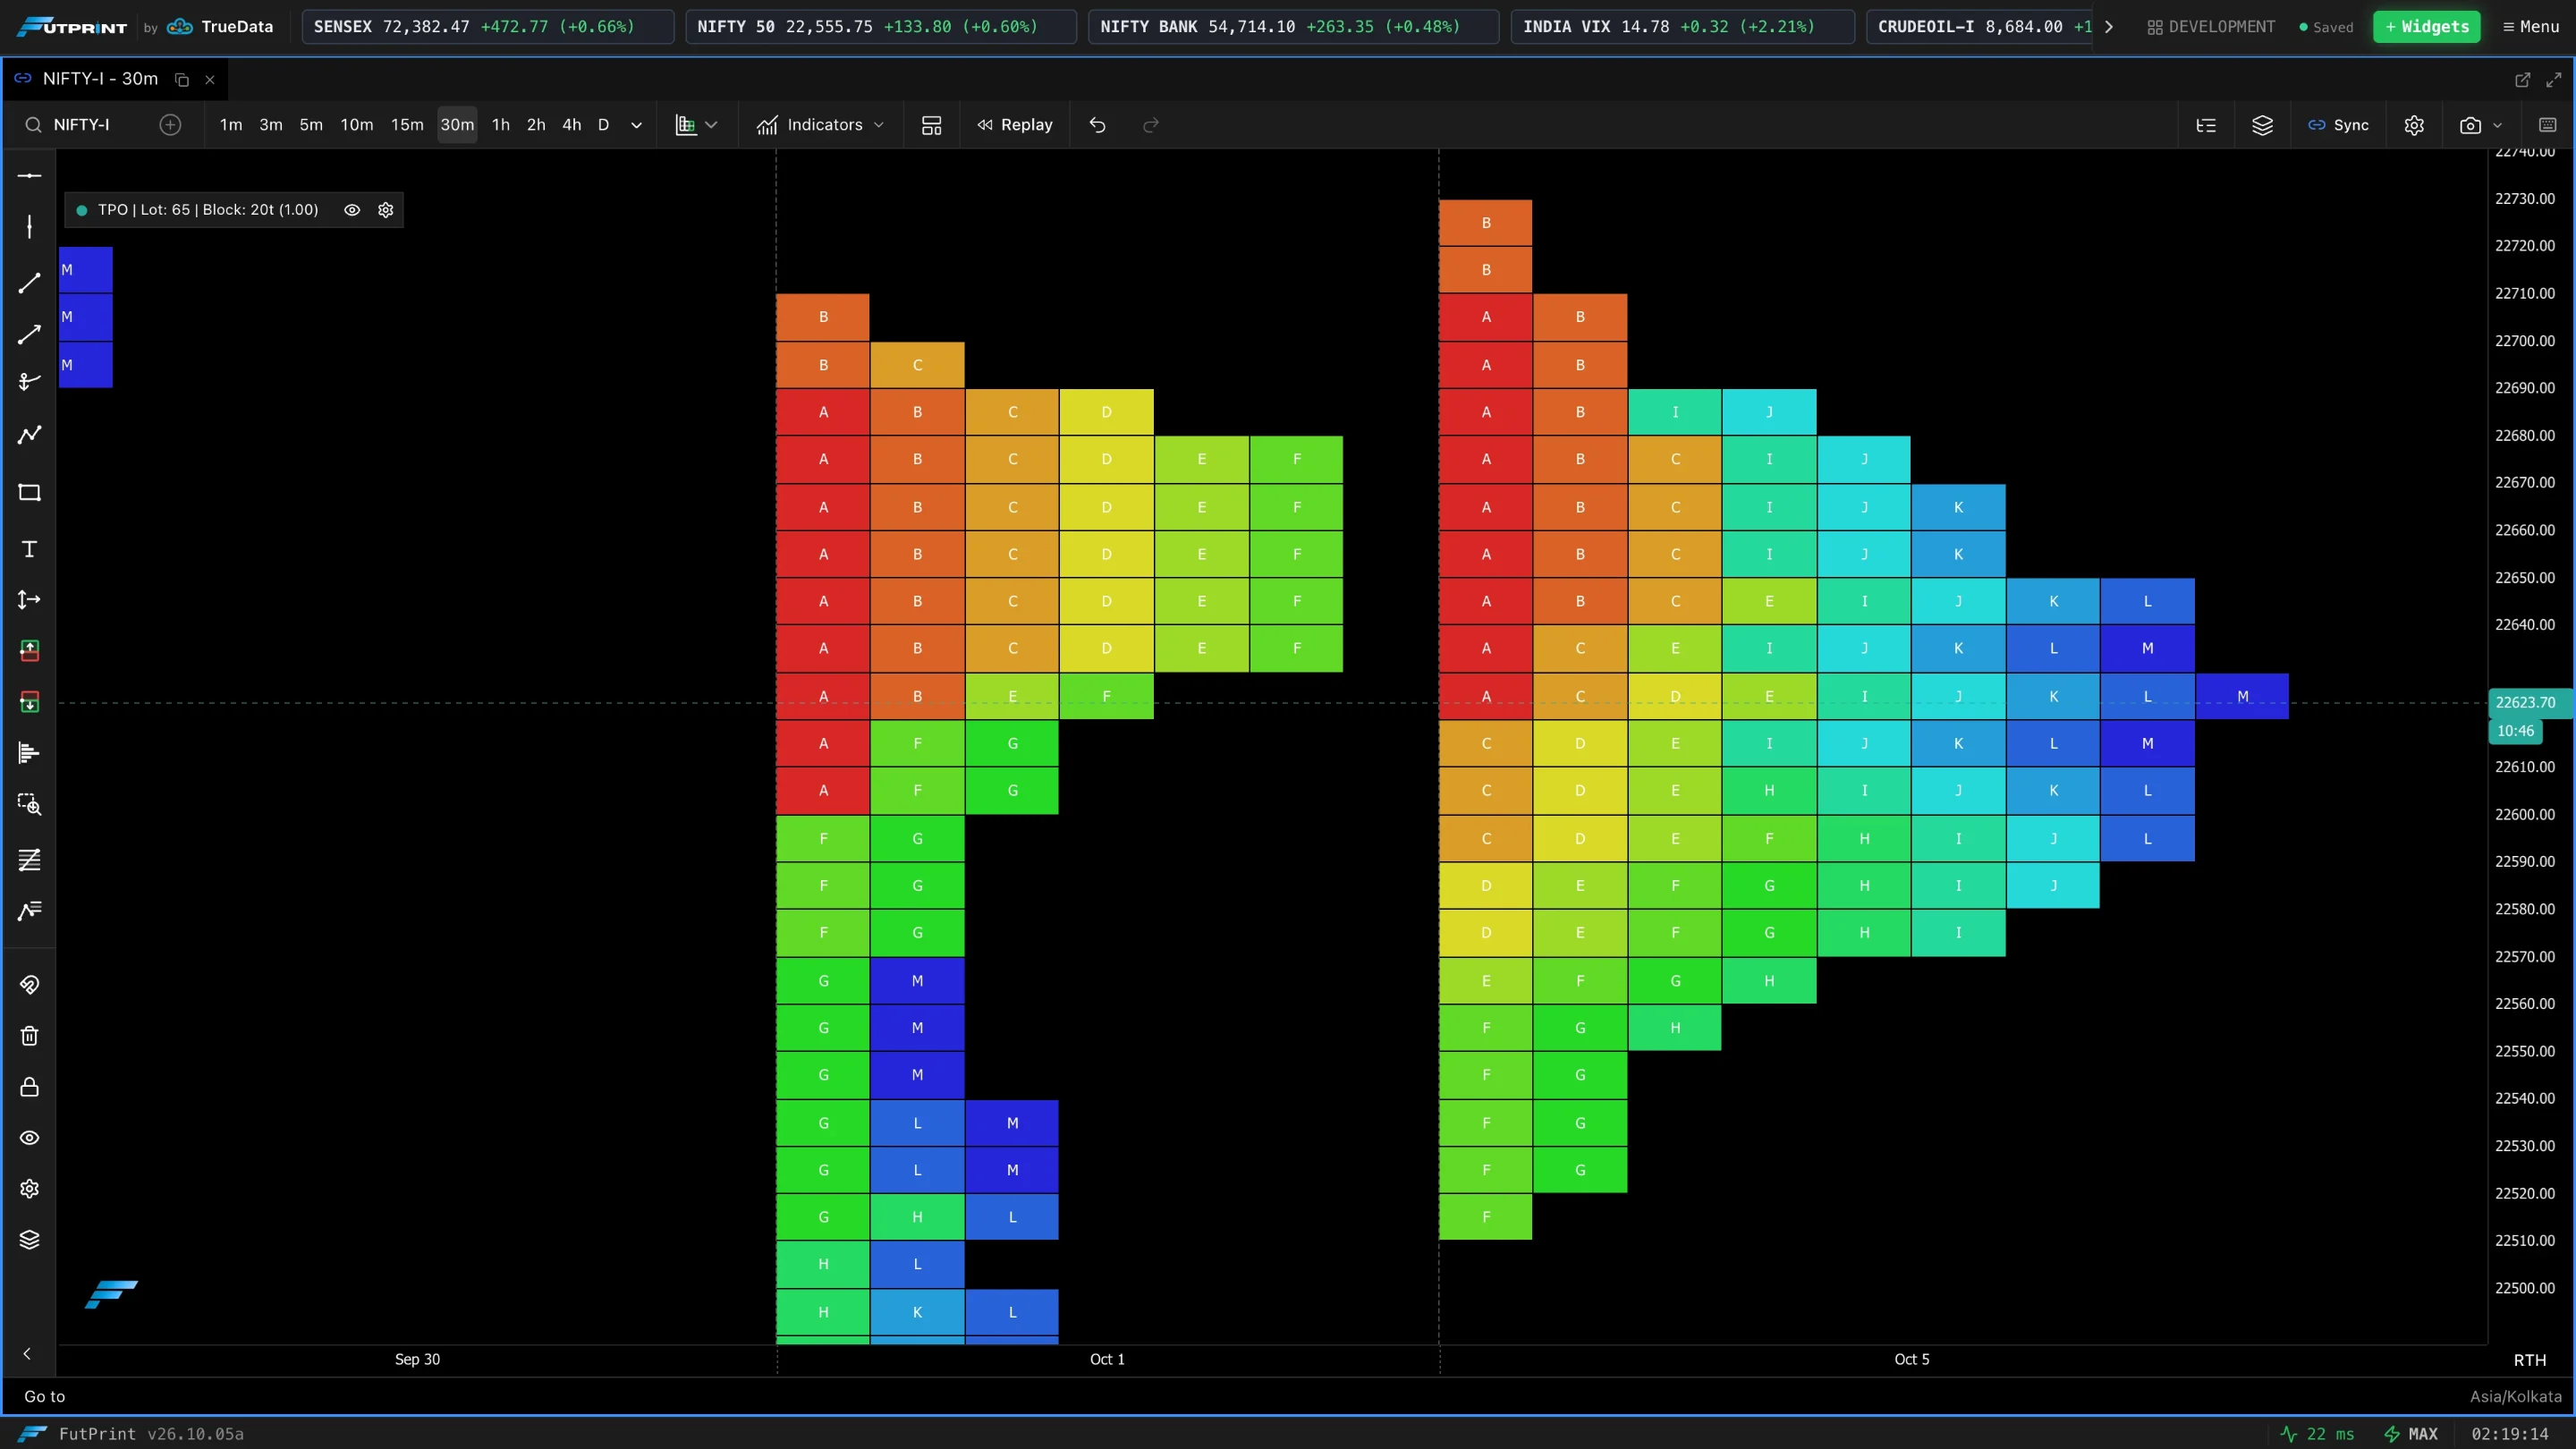
Coloring Mode
How the blocks are coloured.
| Mode | What it shows |
|---|---|
| POC + Value Area | A neutral distribution with the POC row and the value area picked out. |
| Uniform Color | One colour for the whole profile (Uniform Color). |
| Gradient | Blends from Gradient Start to Gradient End across the periods. |
| Up/Down Direction | The whole profile takes the bullish or bearish colour, by whether it closed above or below its open. |
| Red-Blue Spectrum | A spectrum across price, from the profile low to its high. |
| Time Spectrum (A->Z) | A spectrum across time, from the first period to the last. |
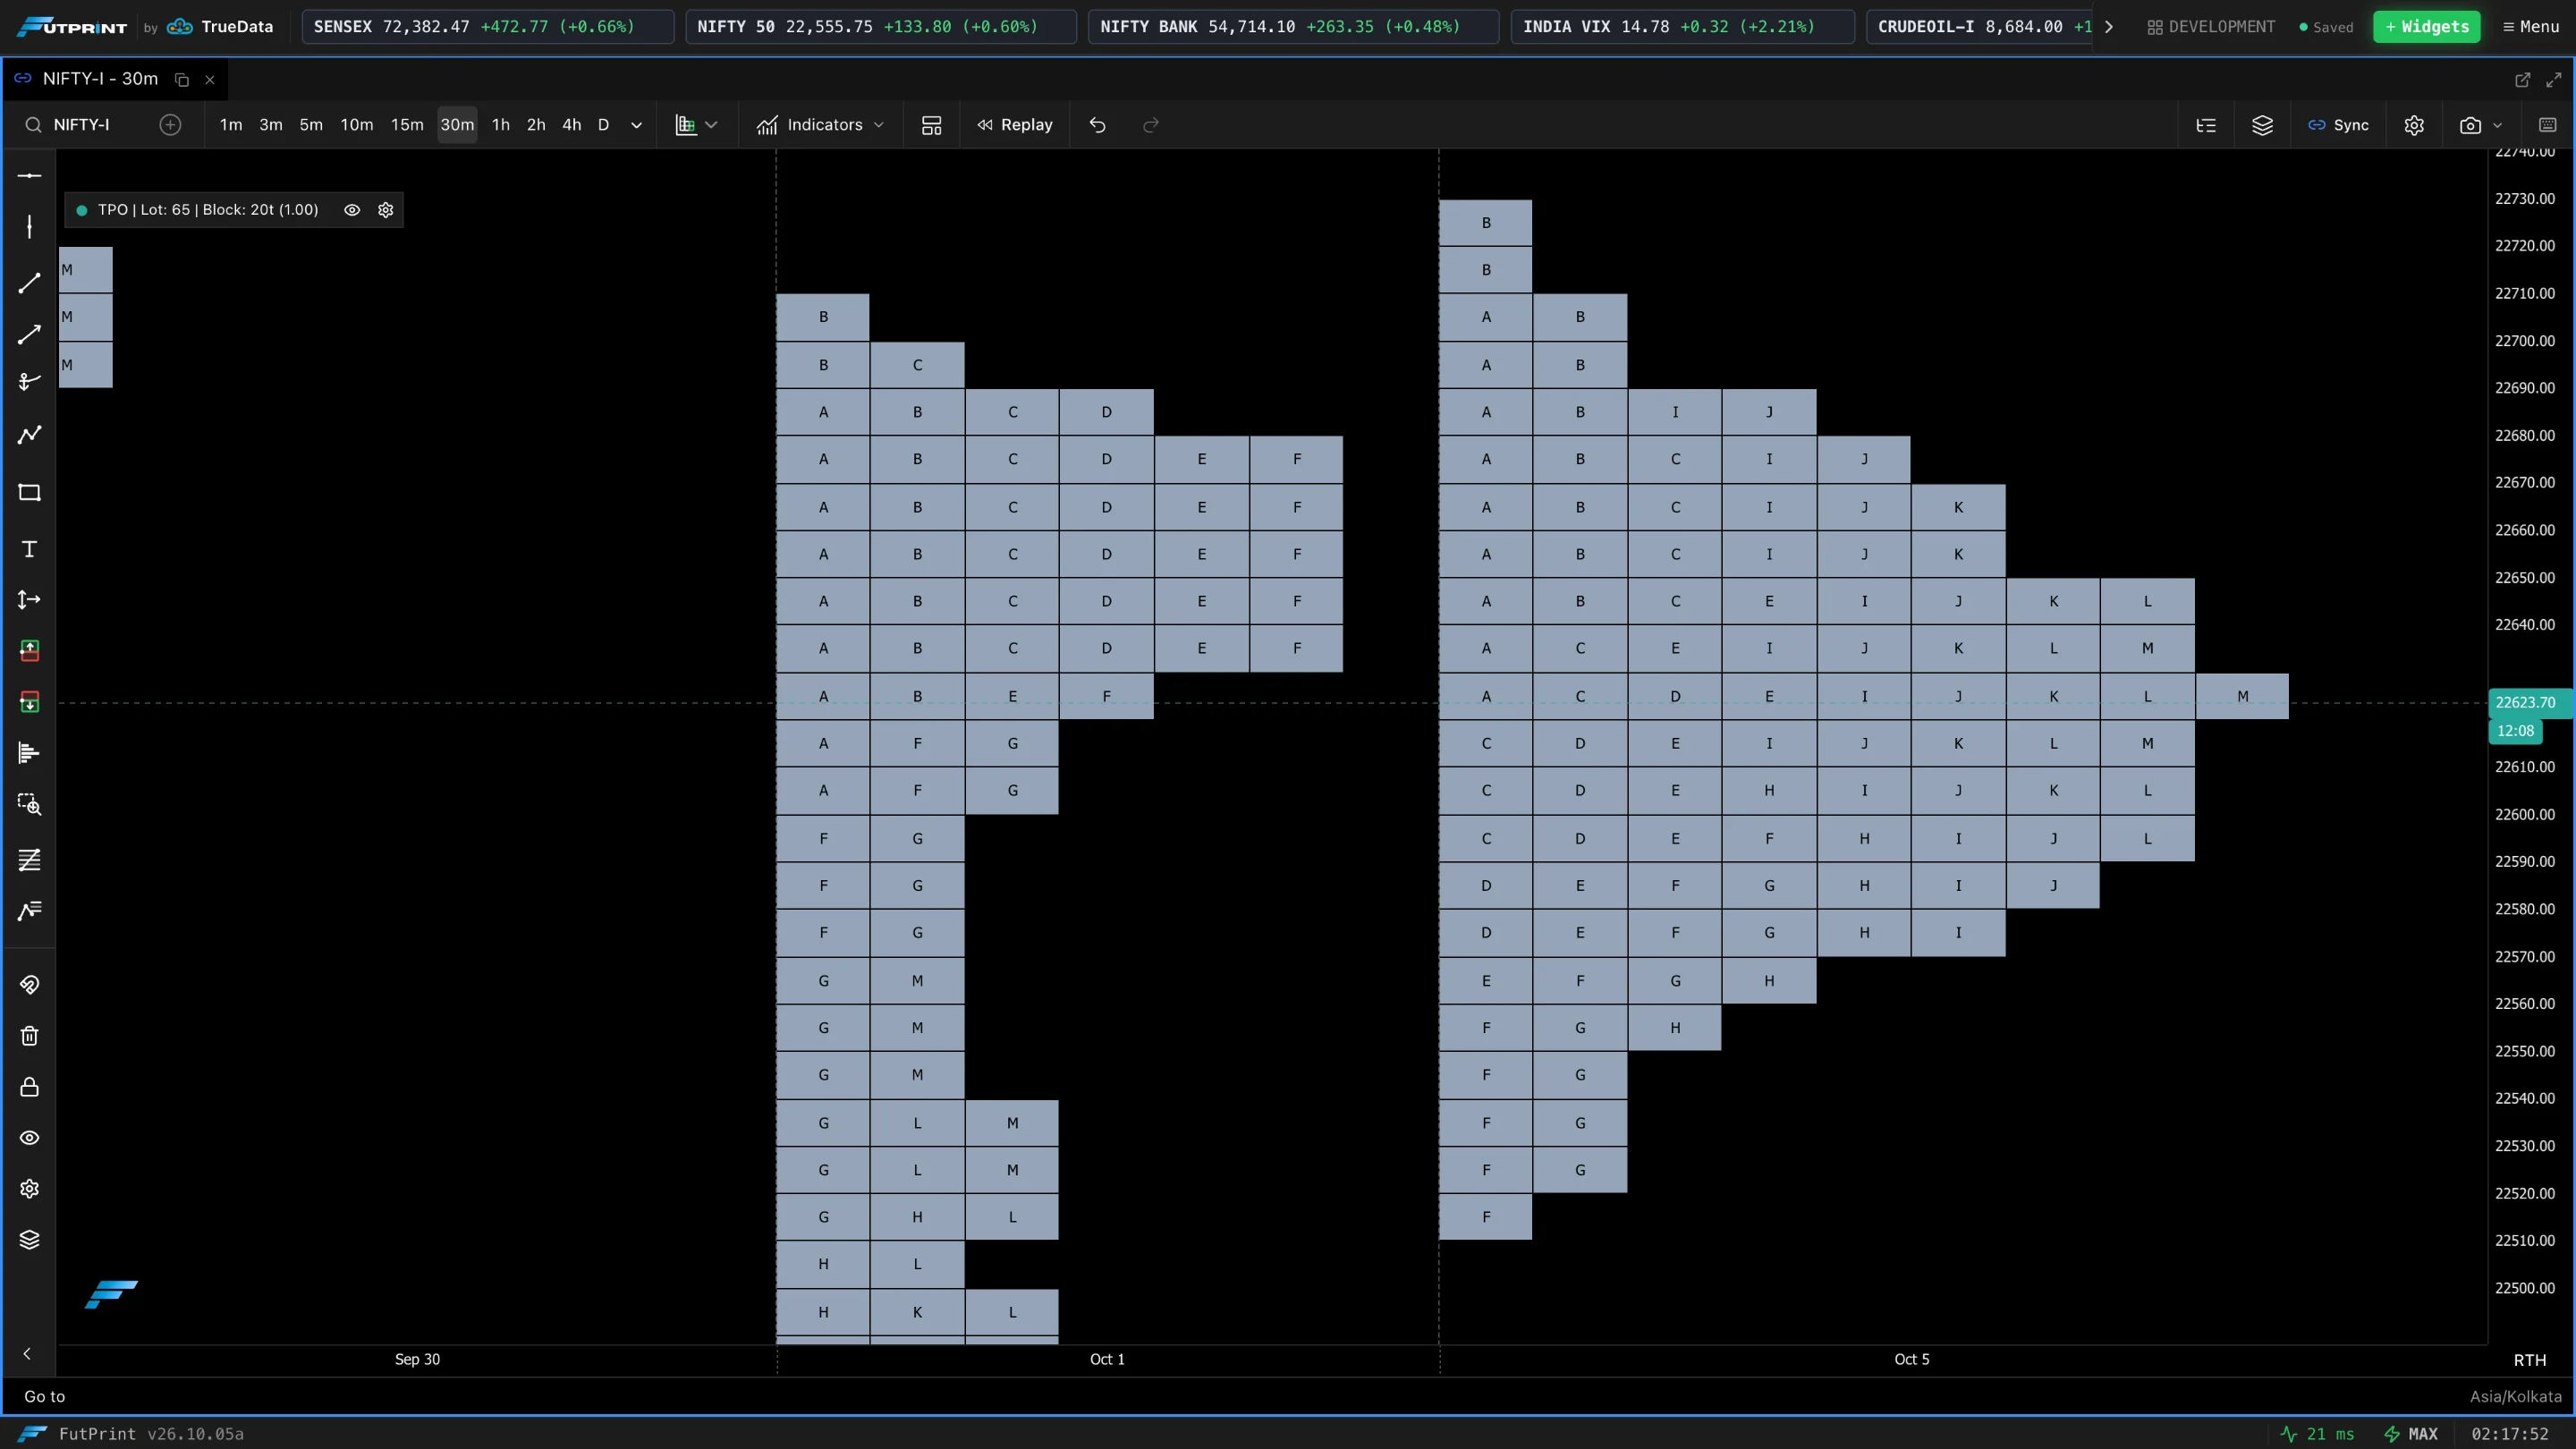
Time-Based Gradient Overlay
Darkens earlier blocks so the progression of the session is visible on top of the chosen colouring mode.
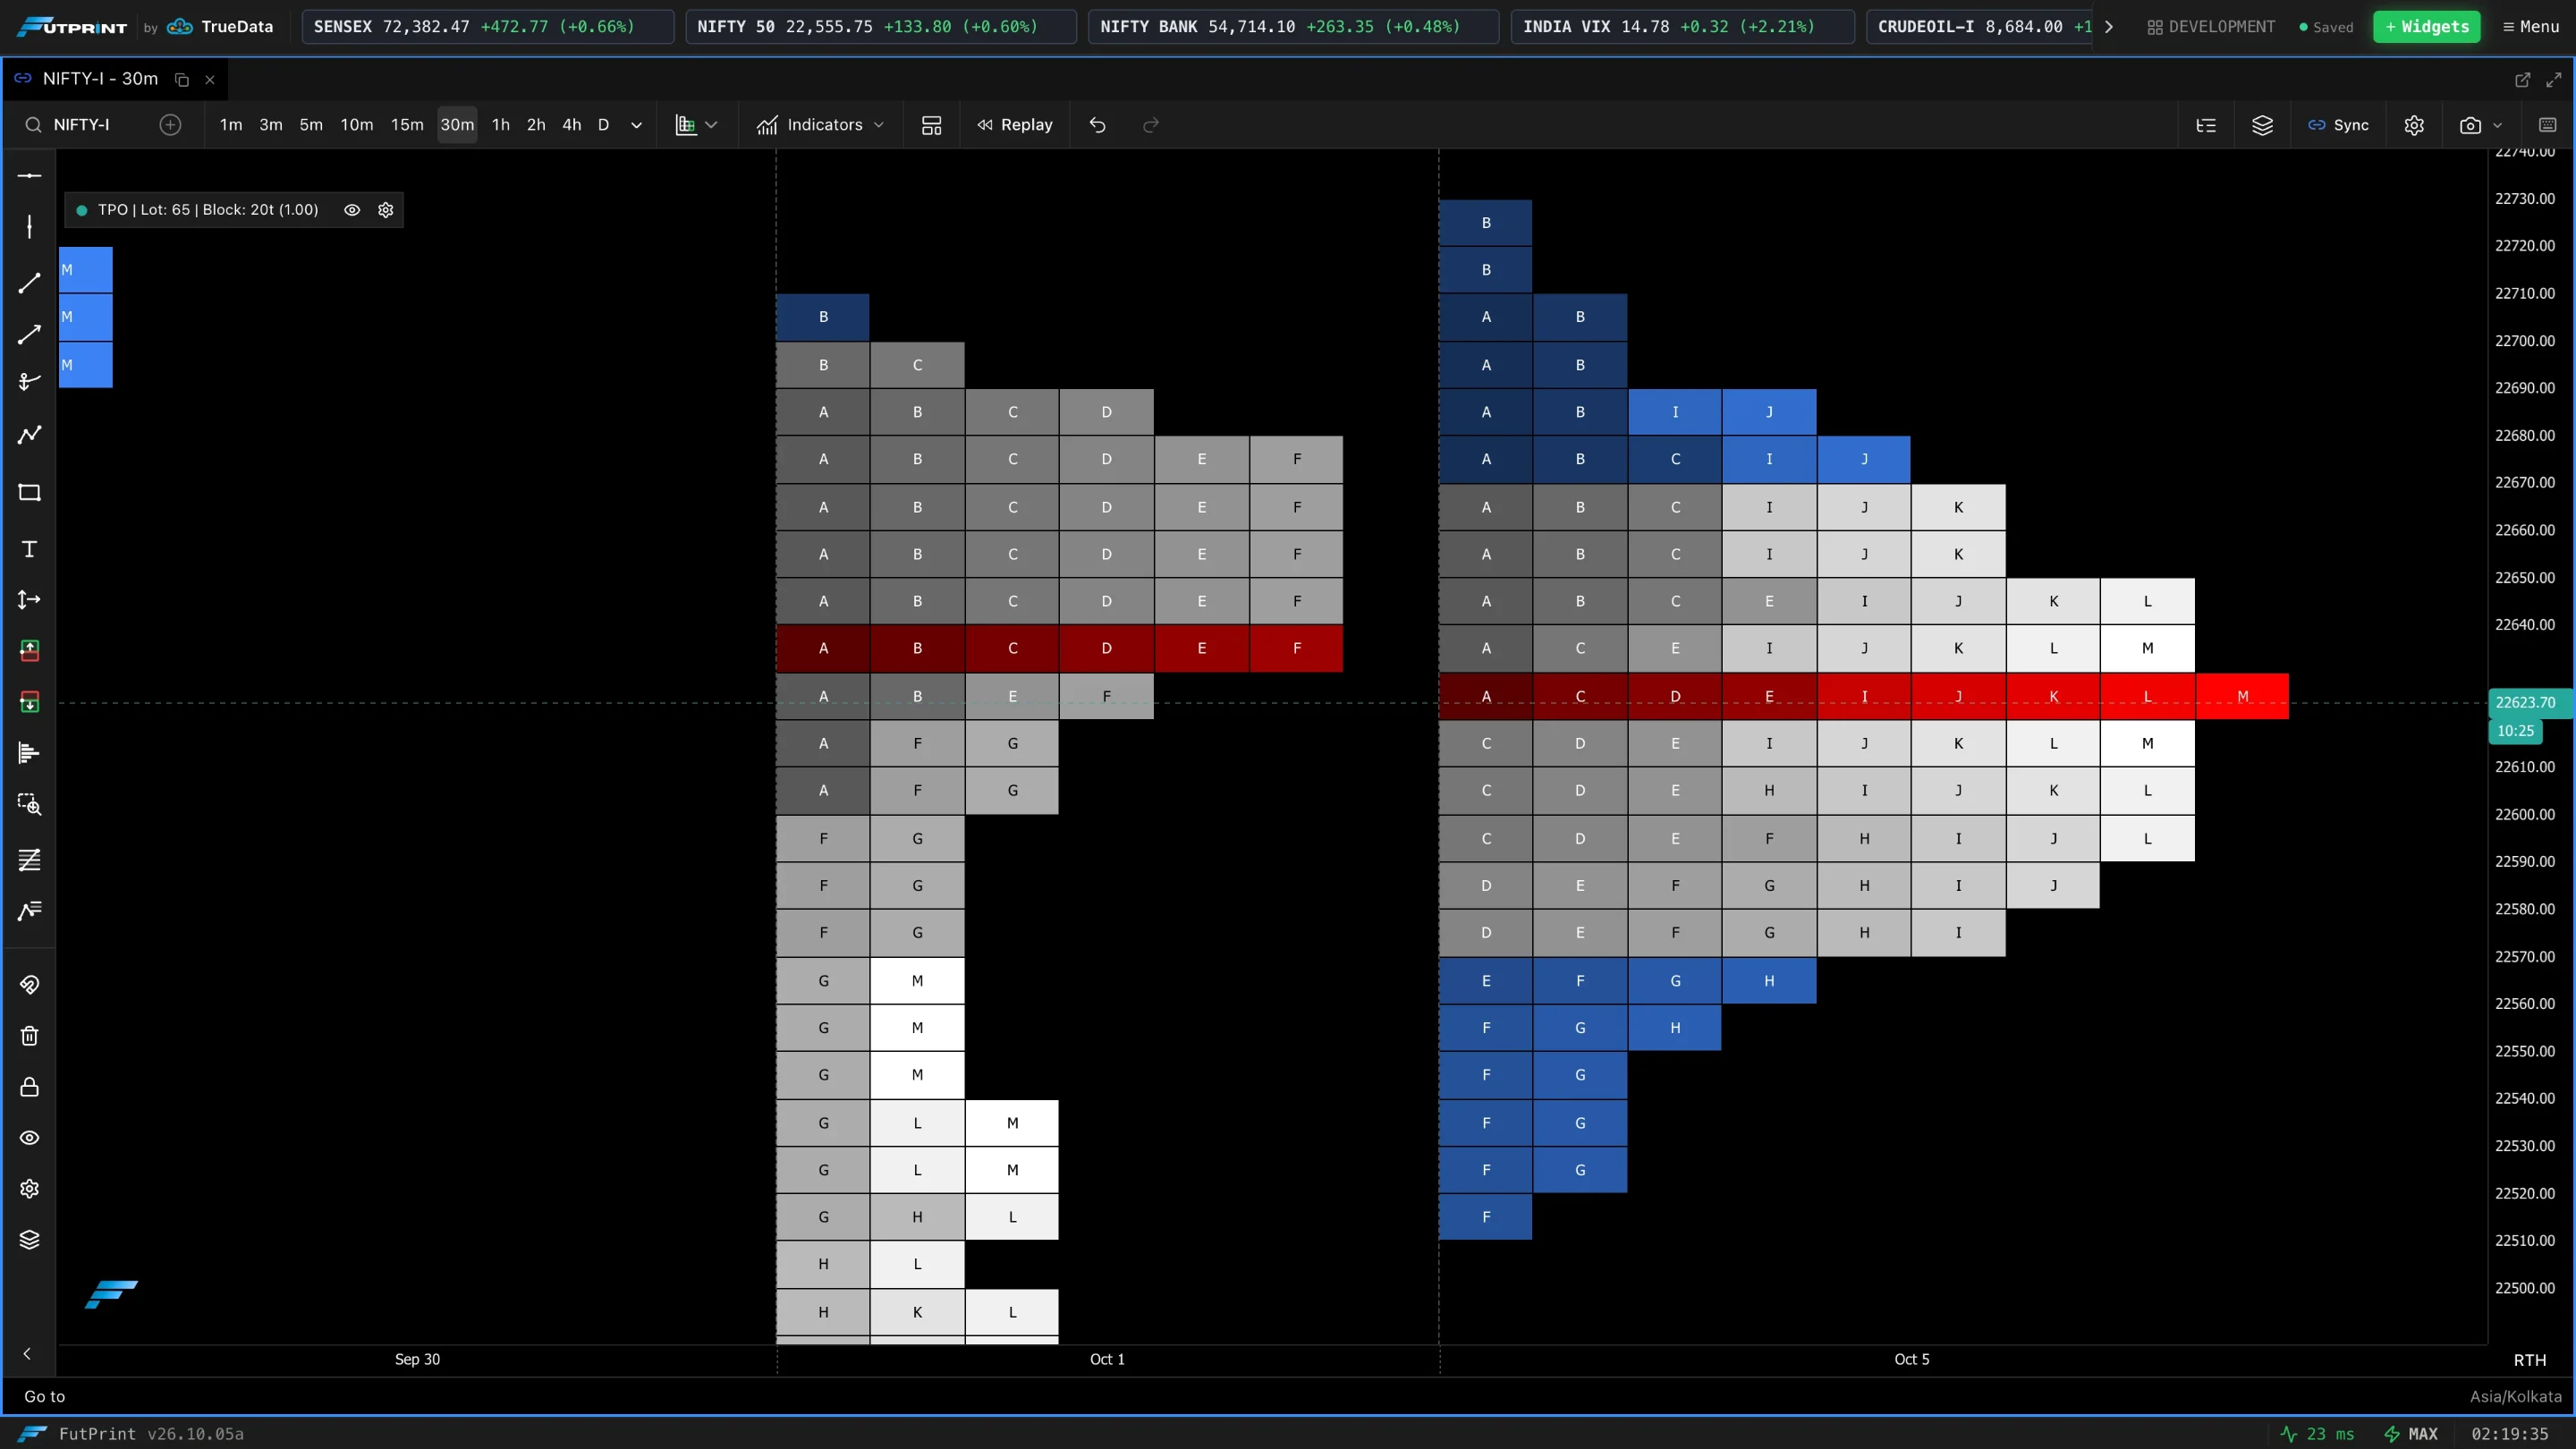
Distribution Color sets the default block colour.
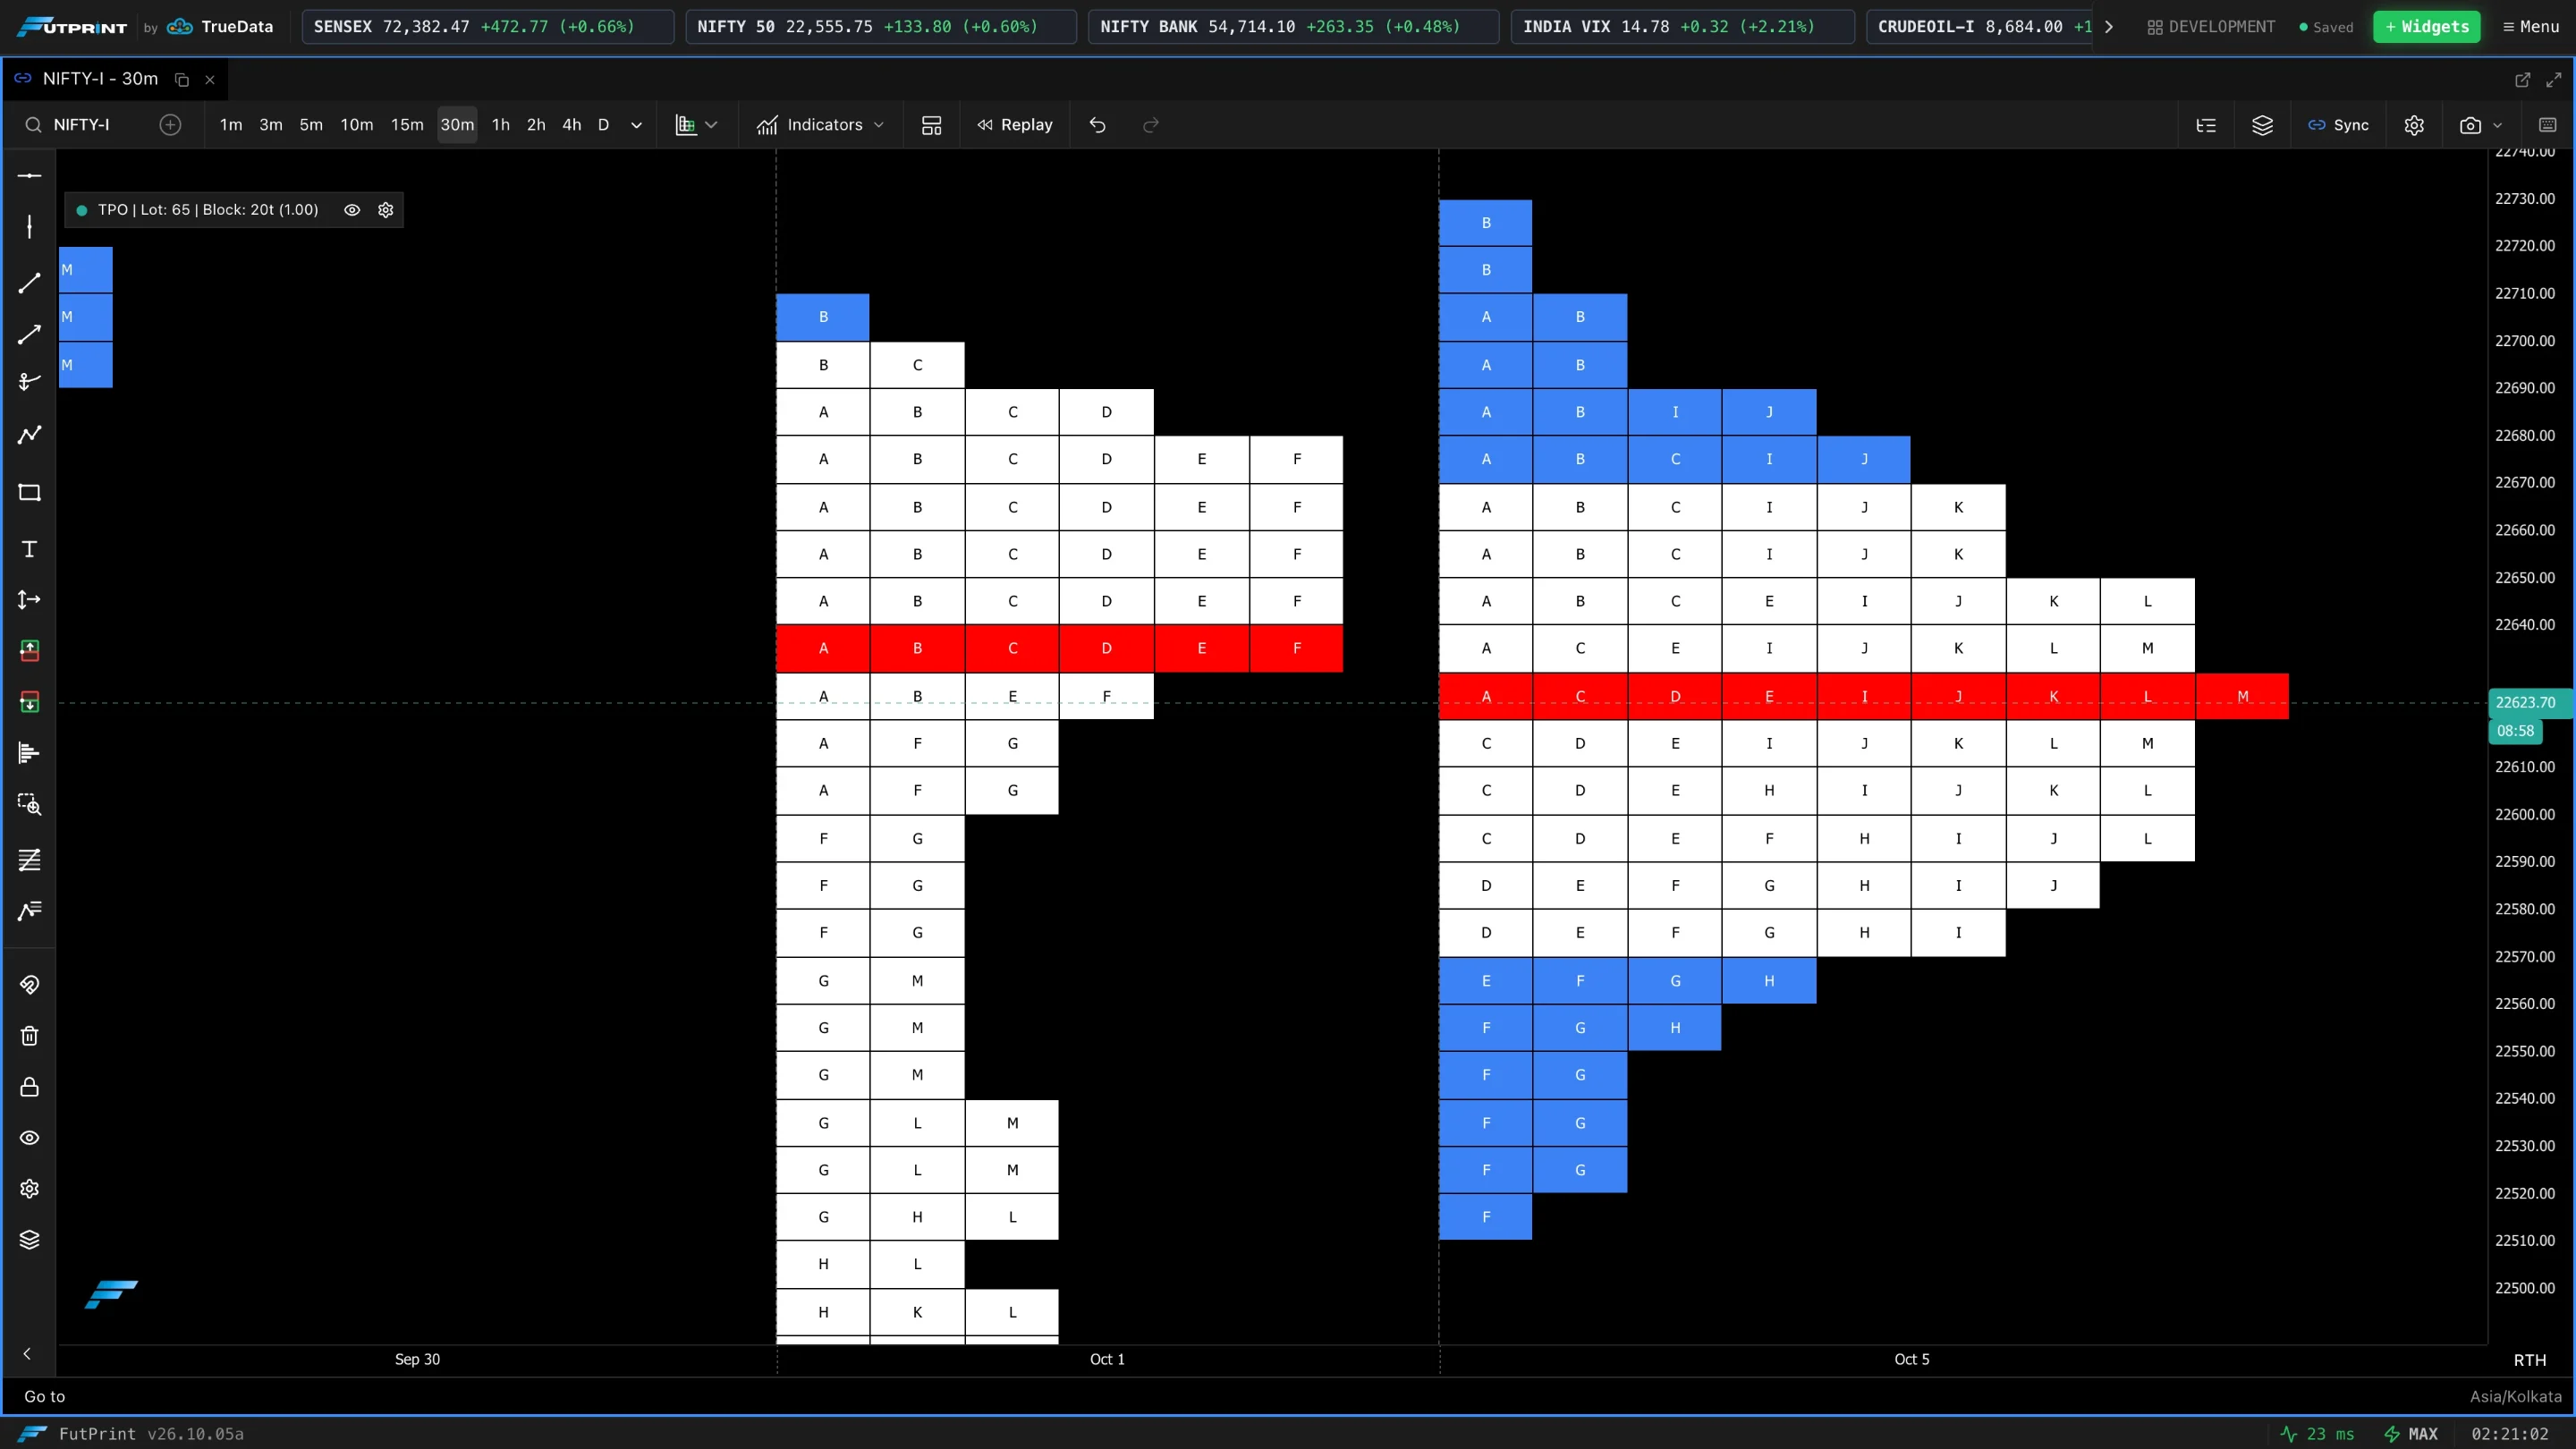
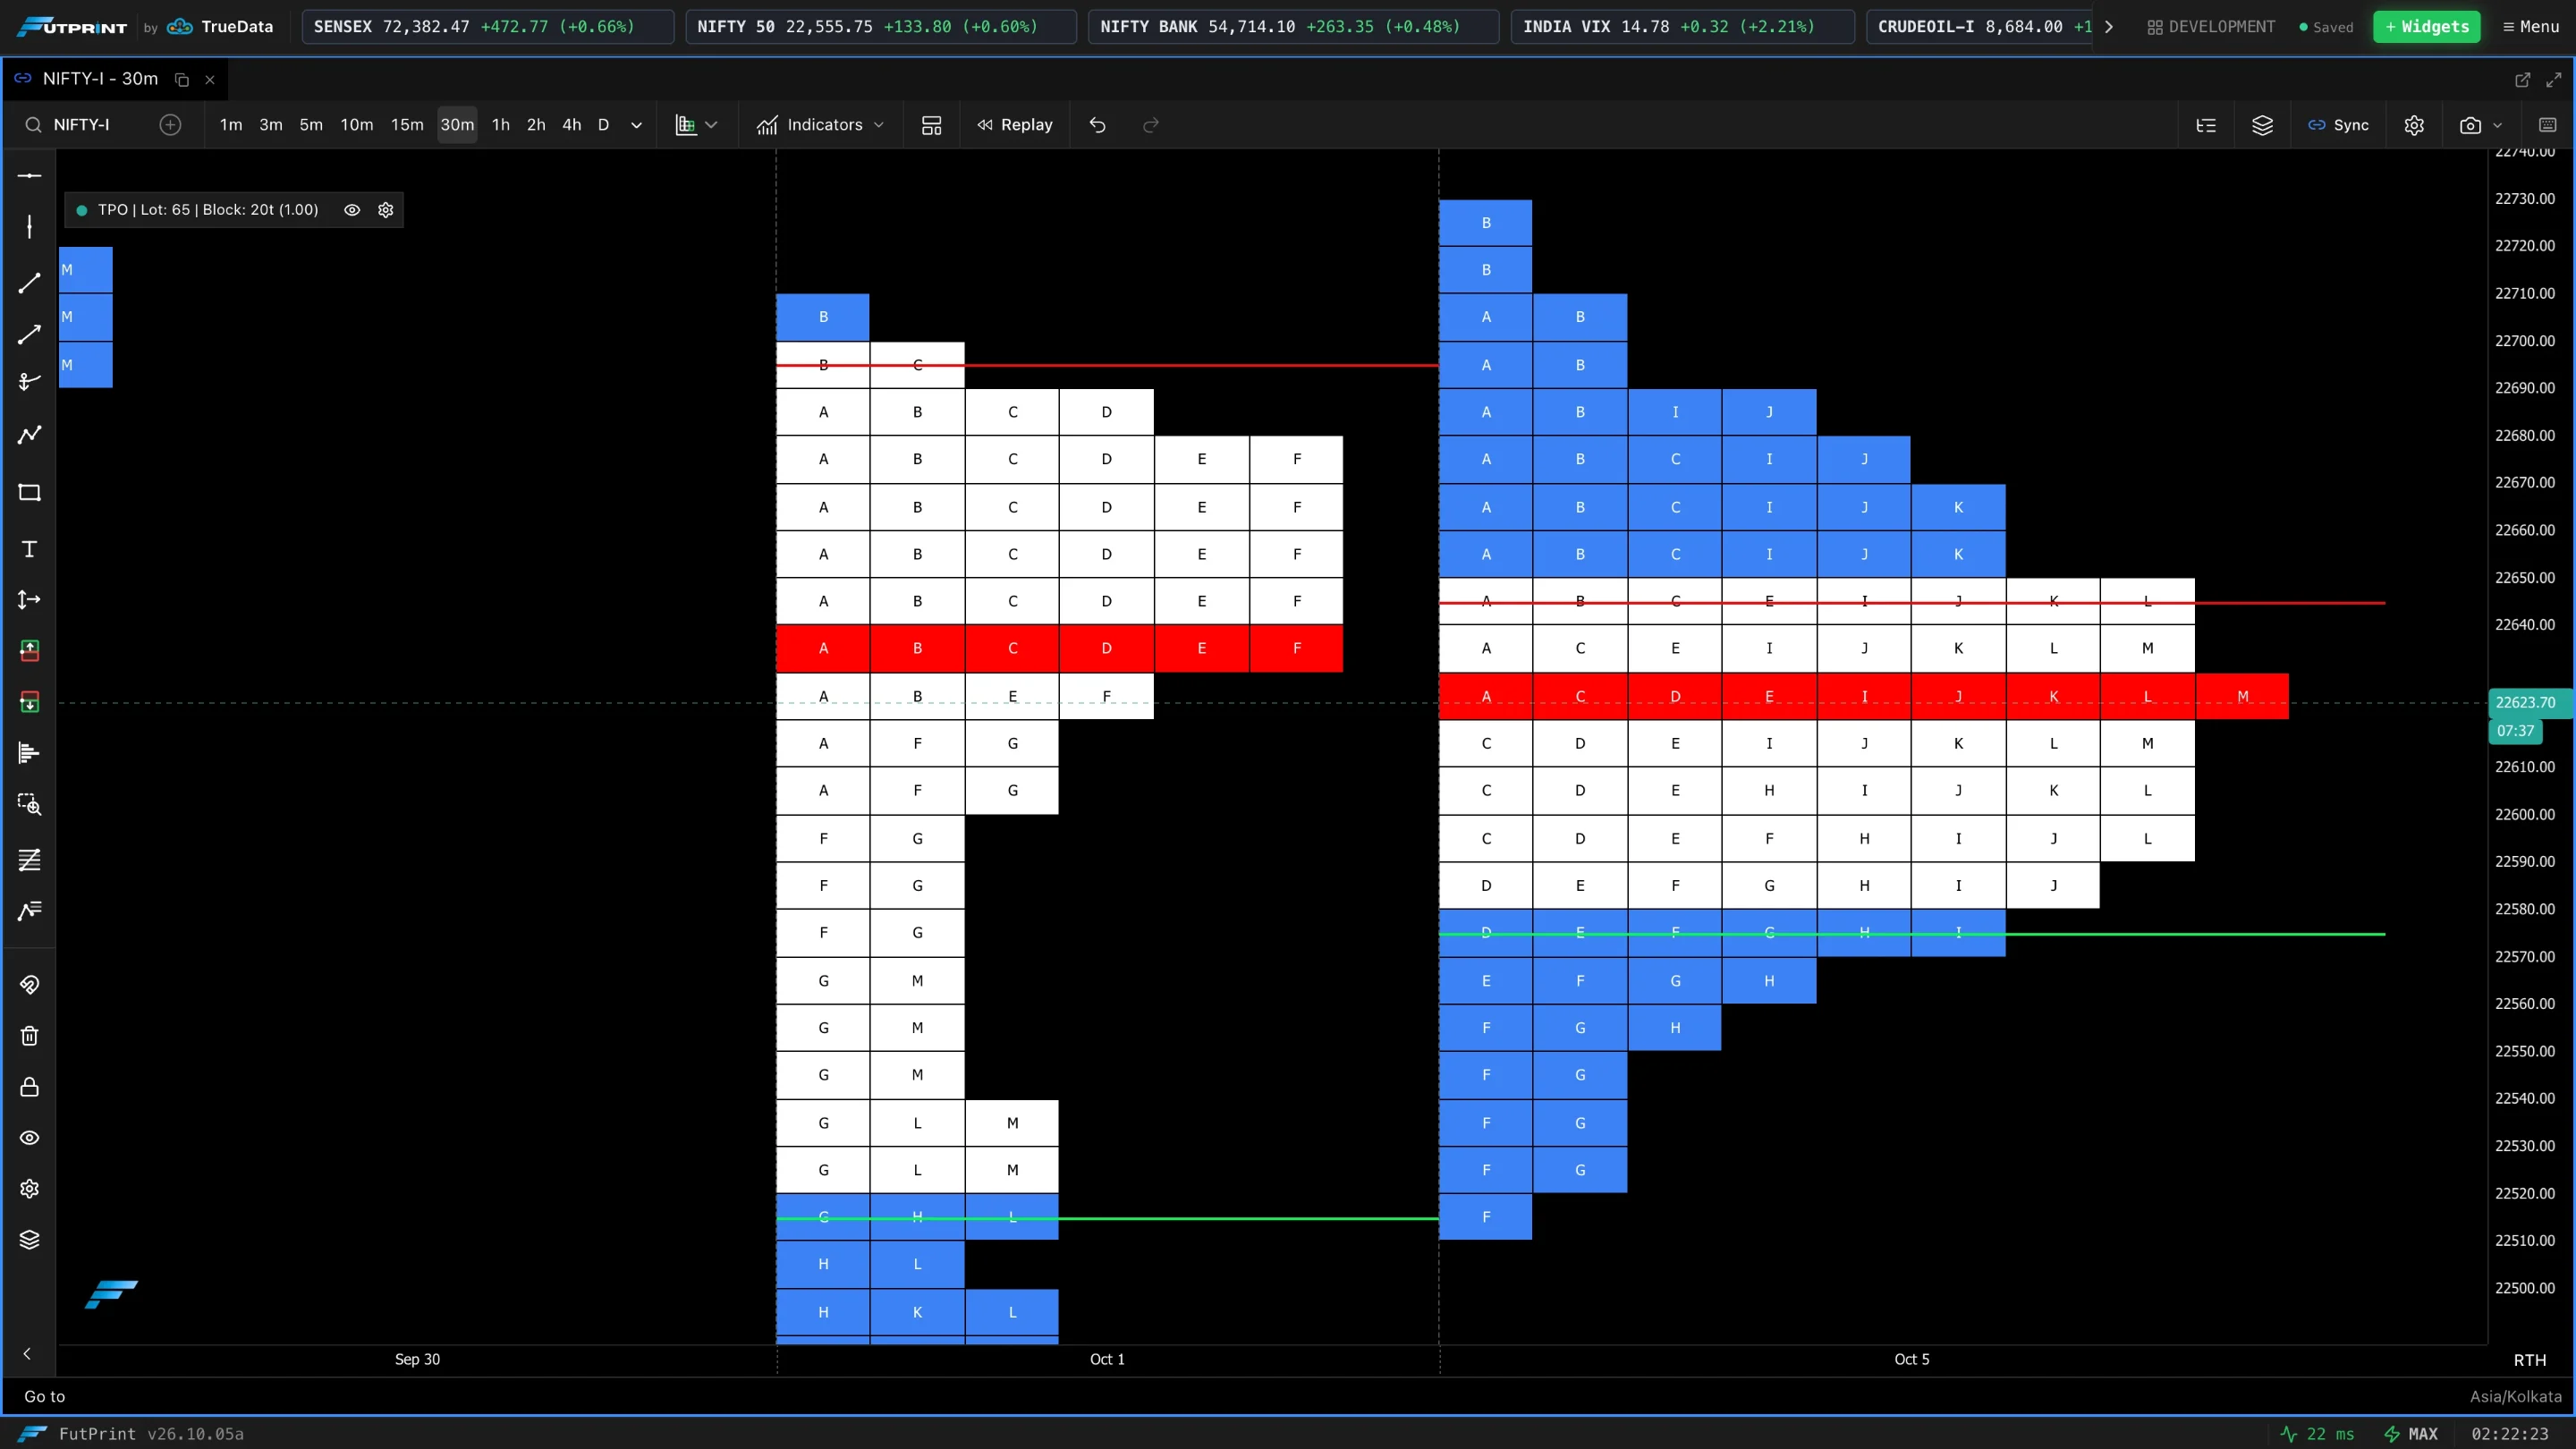
POC Line
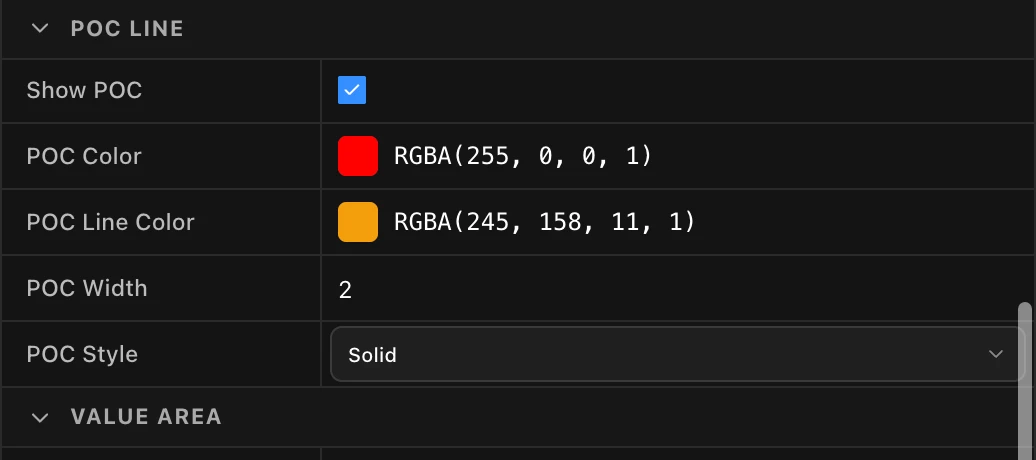
| Setting | What it does |
|---|---|
| Show POC | Highlights the Point of Control — the price level with the most TPOs. |
| POC Color | Colour of the POC row. |
| POC Line Color, POC Width, POC Style | The POC line; style is Solid, Dashed or Dotted. |
| Extend Naked POC | Extends a profile's POC through later profiles until that price trades again. |
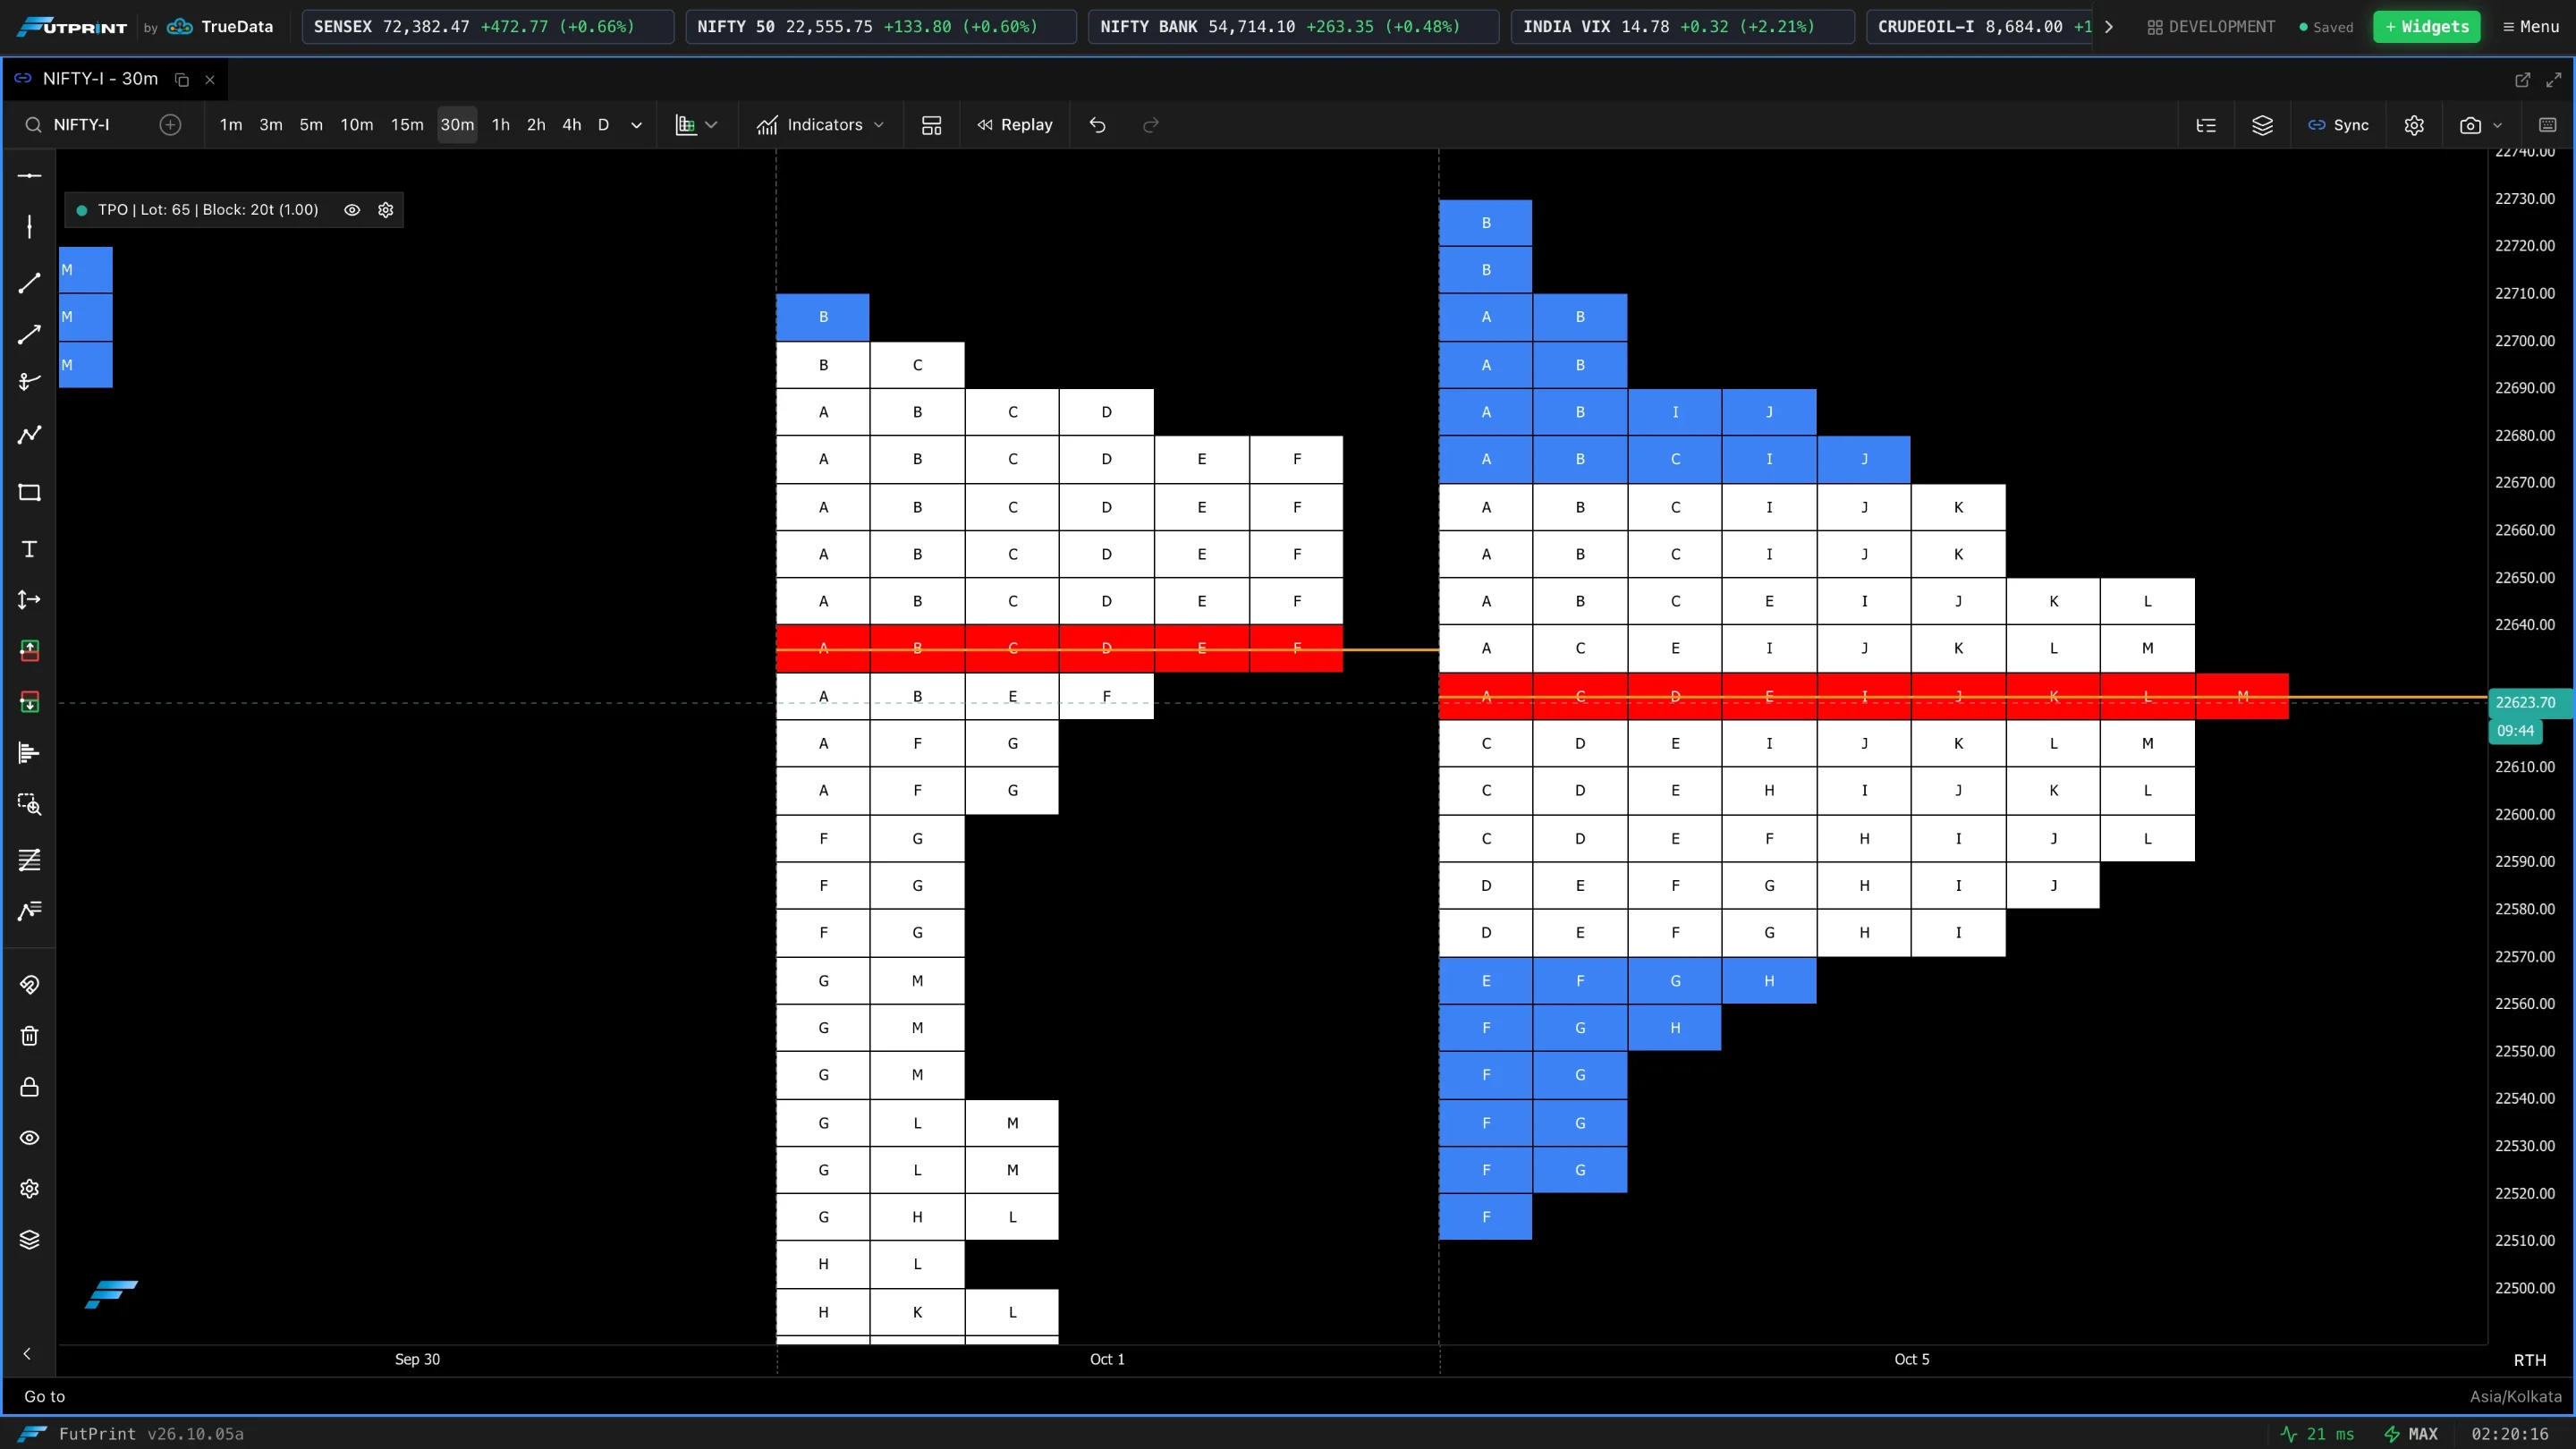
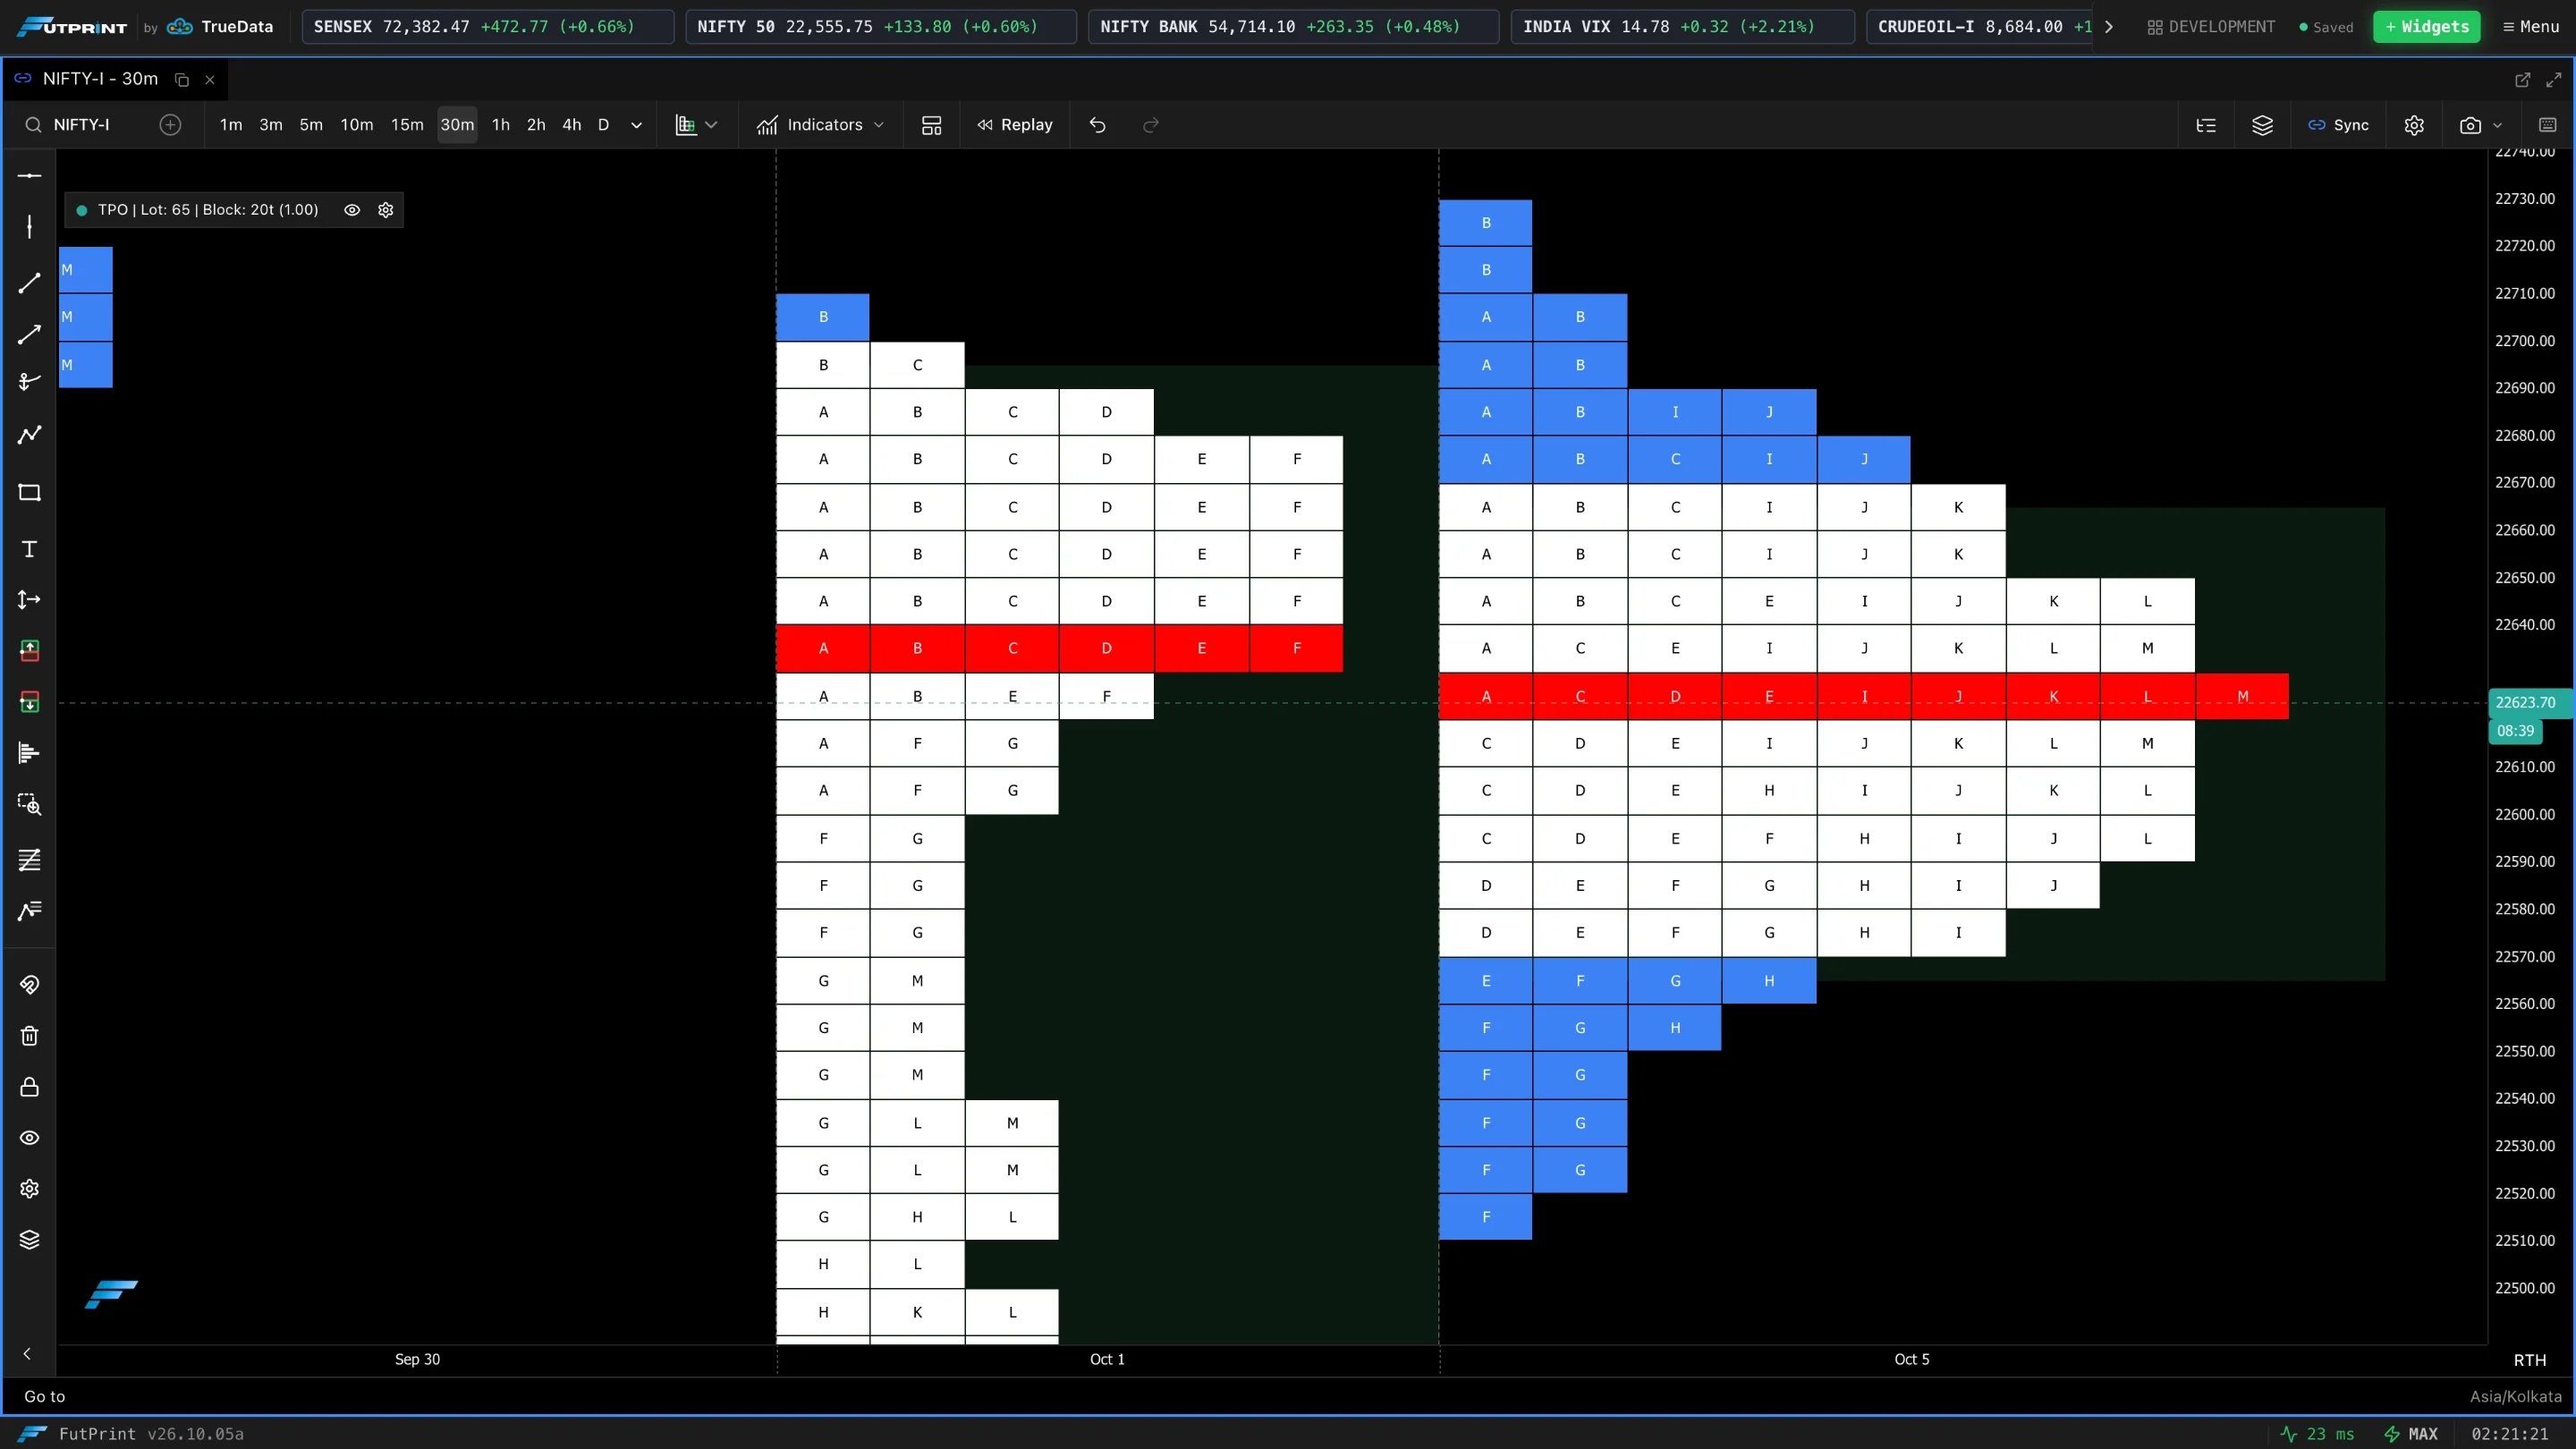
Value Area
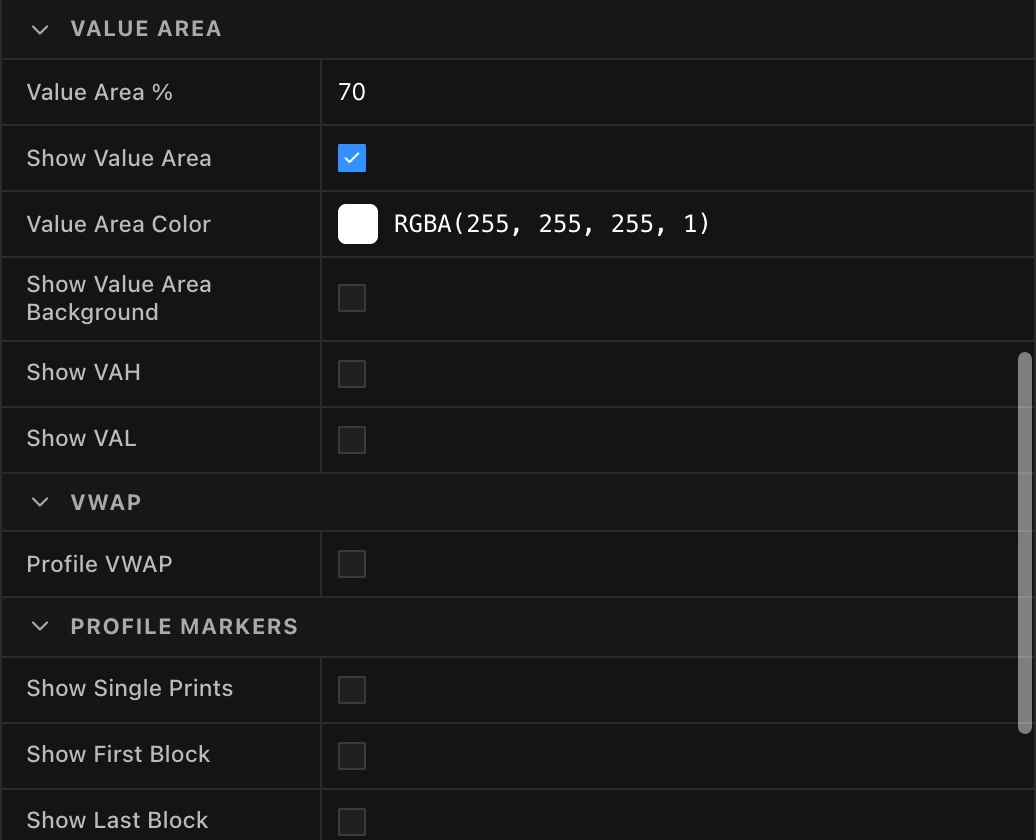
| Setting | What it does |
|---|---|
| Value Area % | The share of activity included in the value area (typically 70%). |
| Show Value Area | Picks out the blocks inside the value area. |
| Value Area Color | Colour of those blocks. |
| Show Value Area Background | Fills the value area with a background colour. |
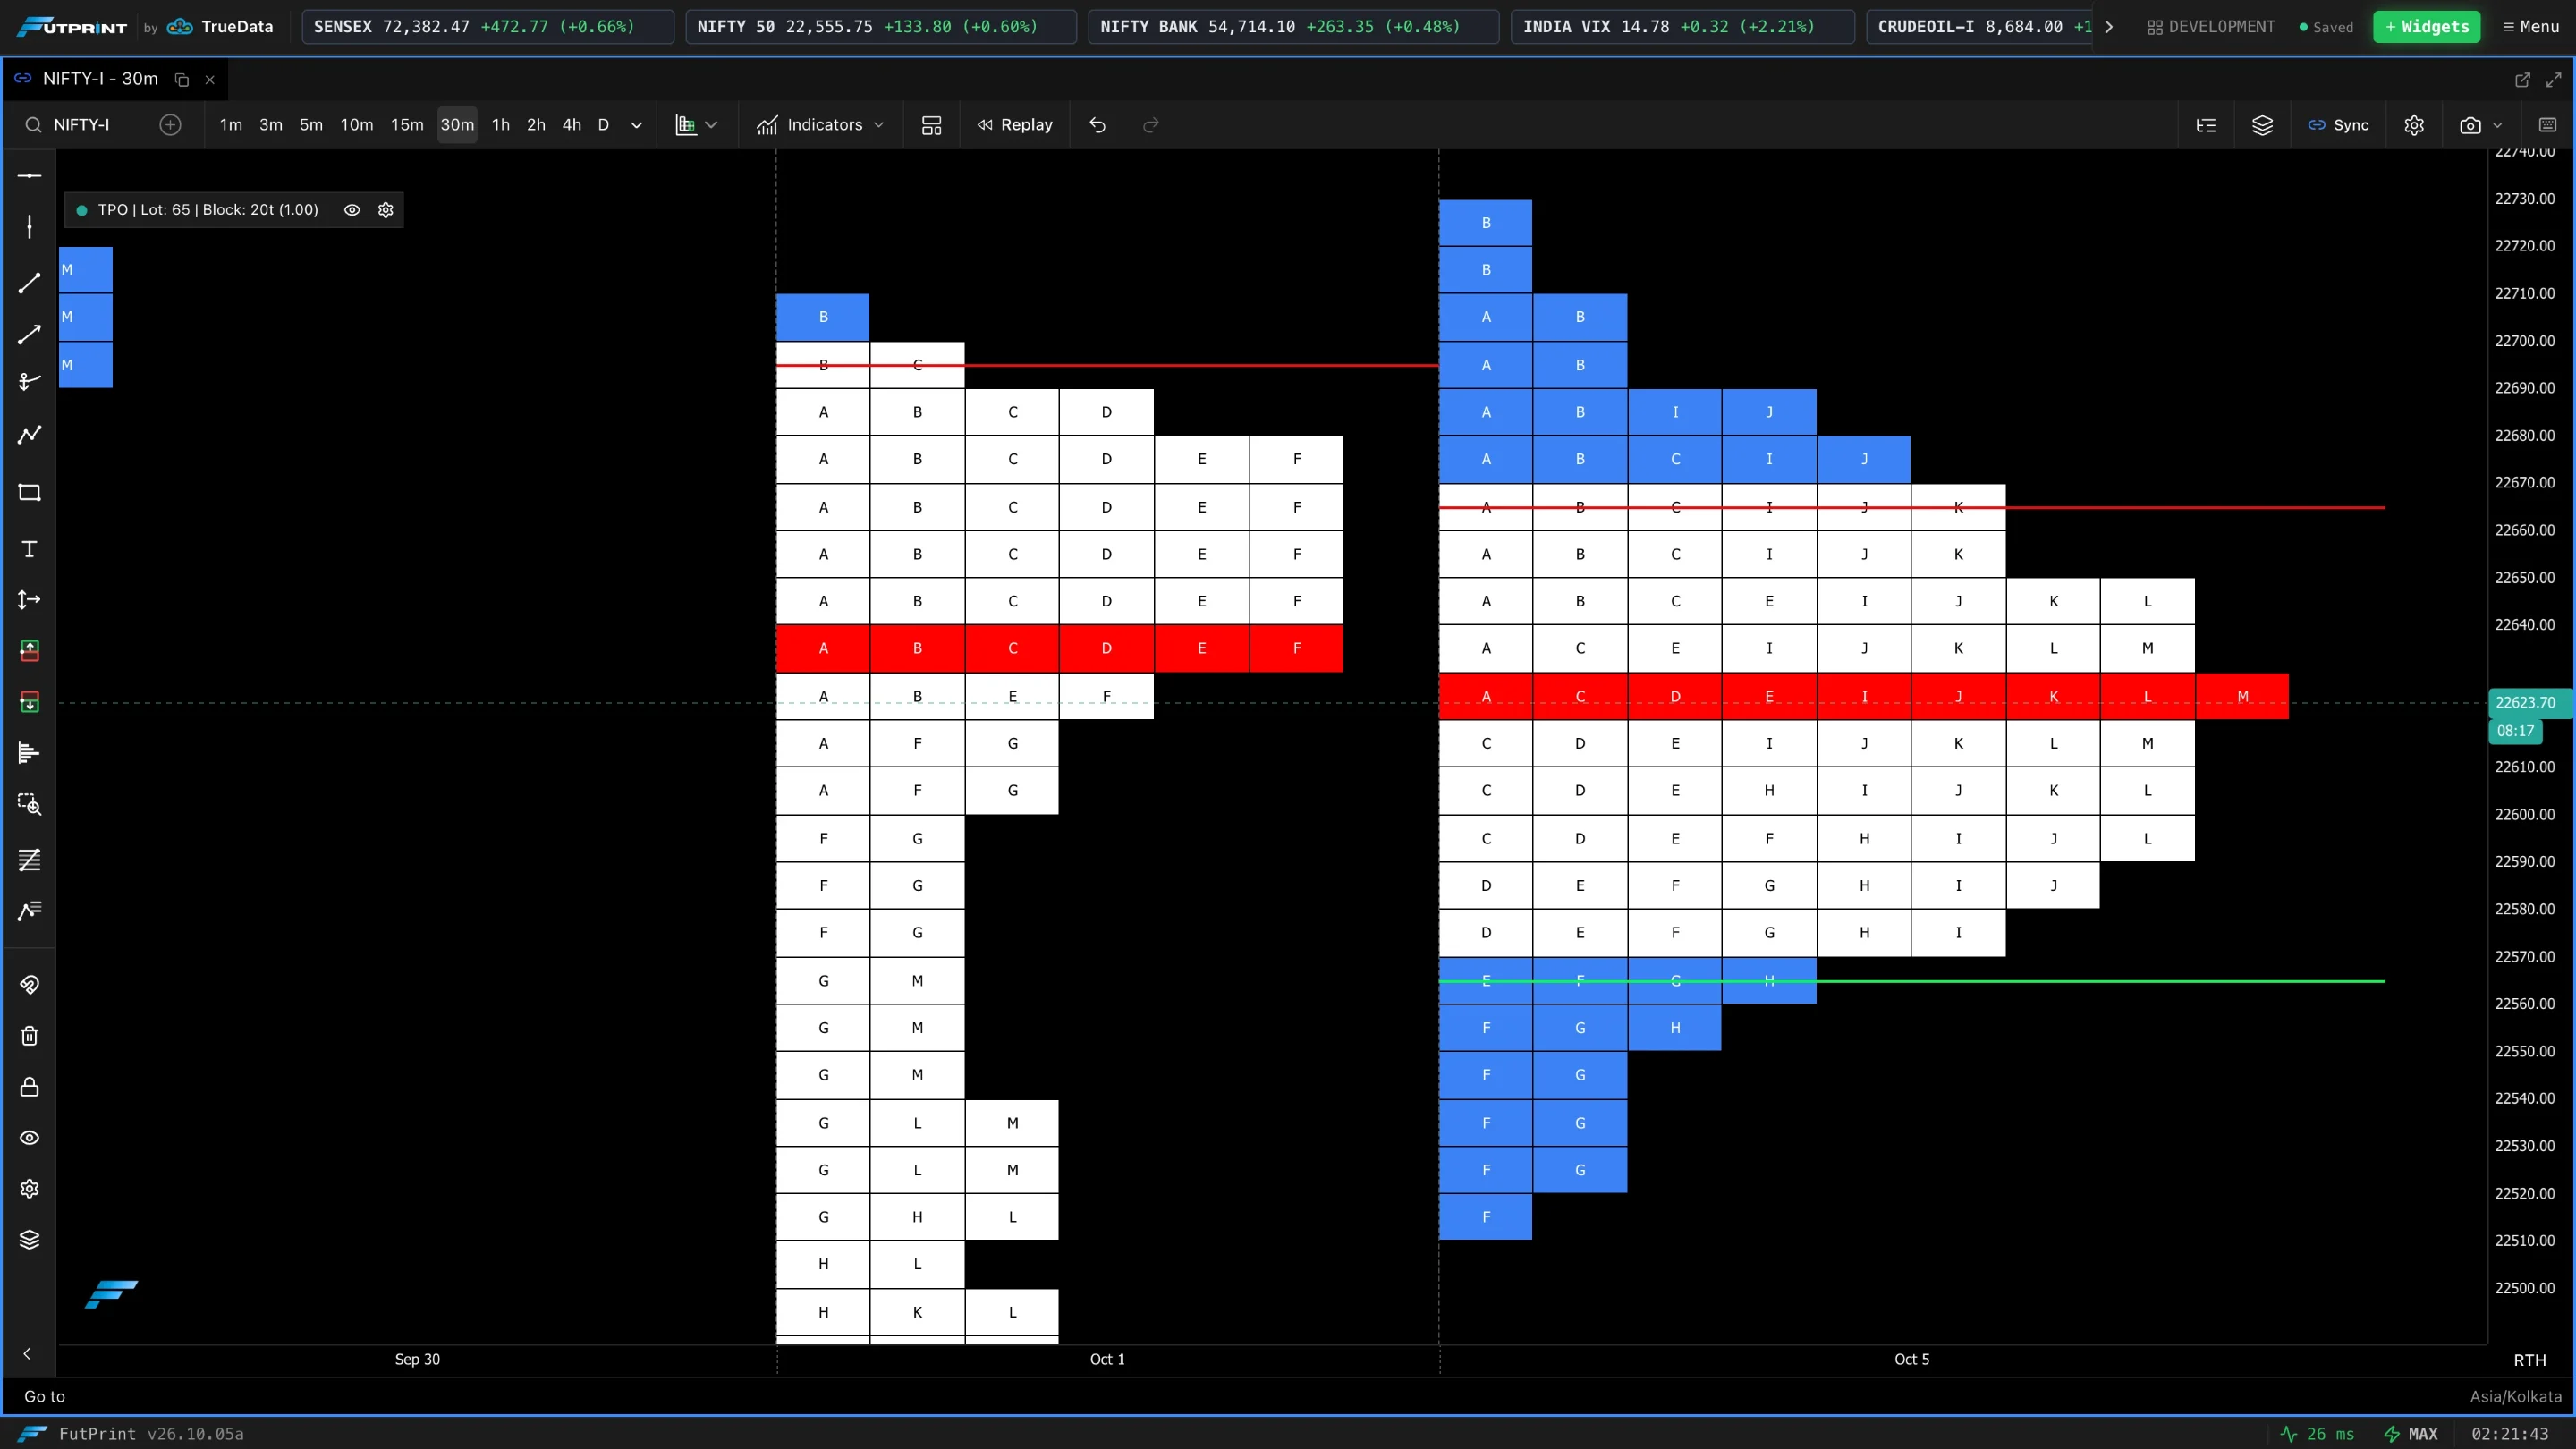
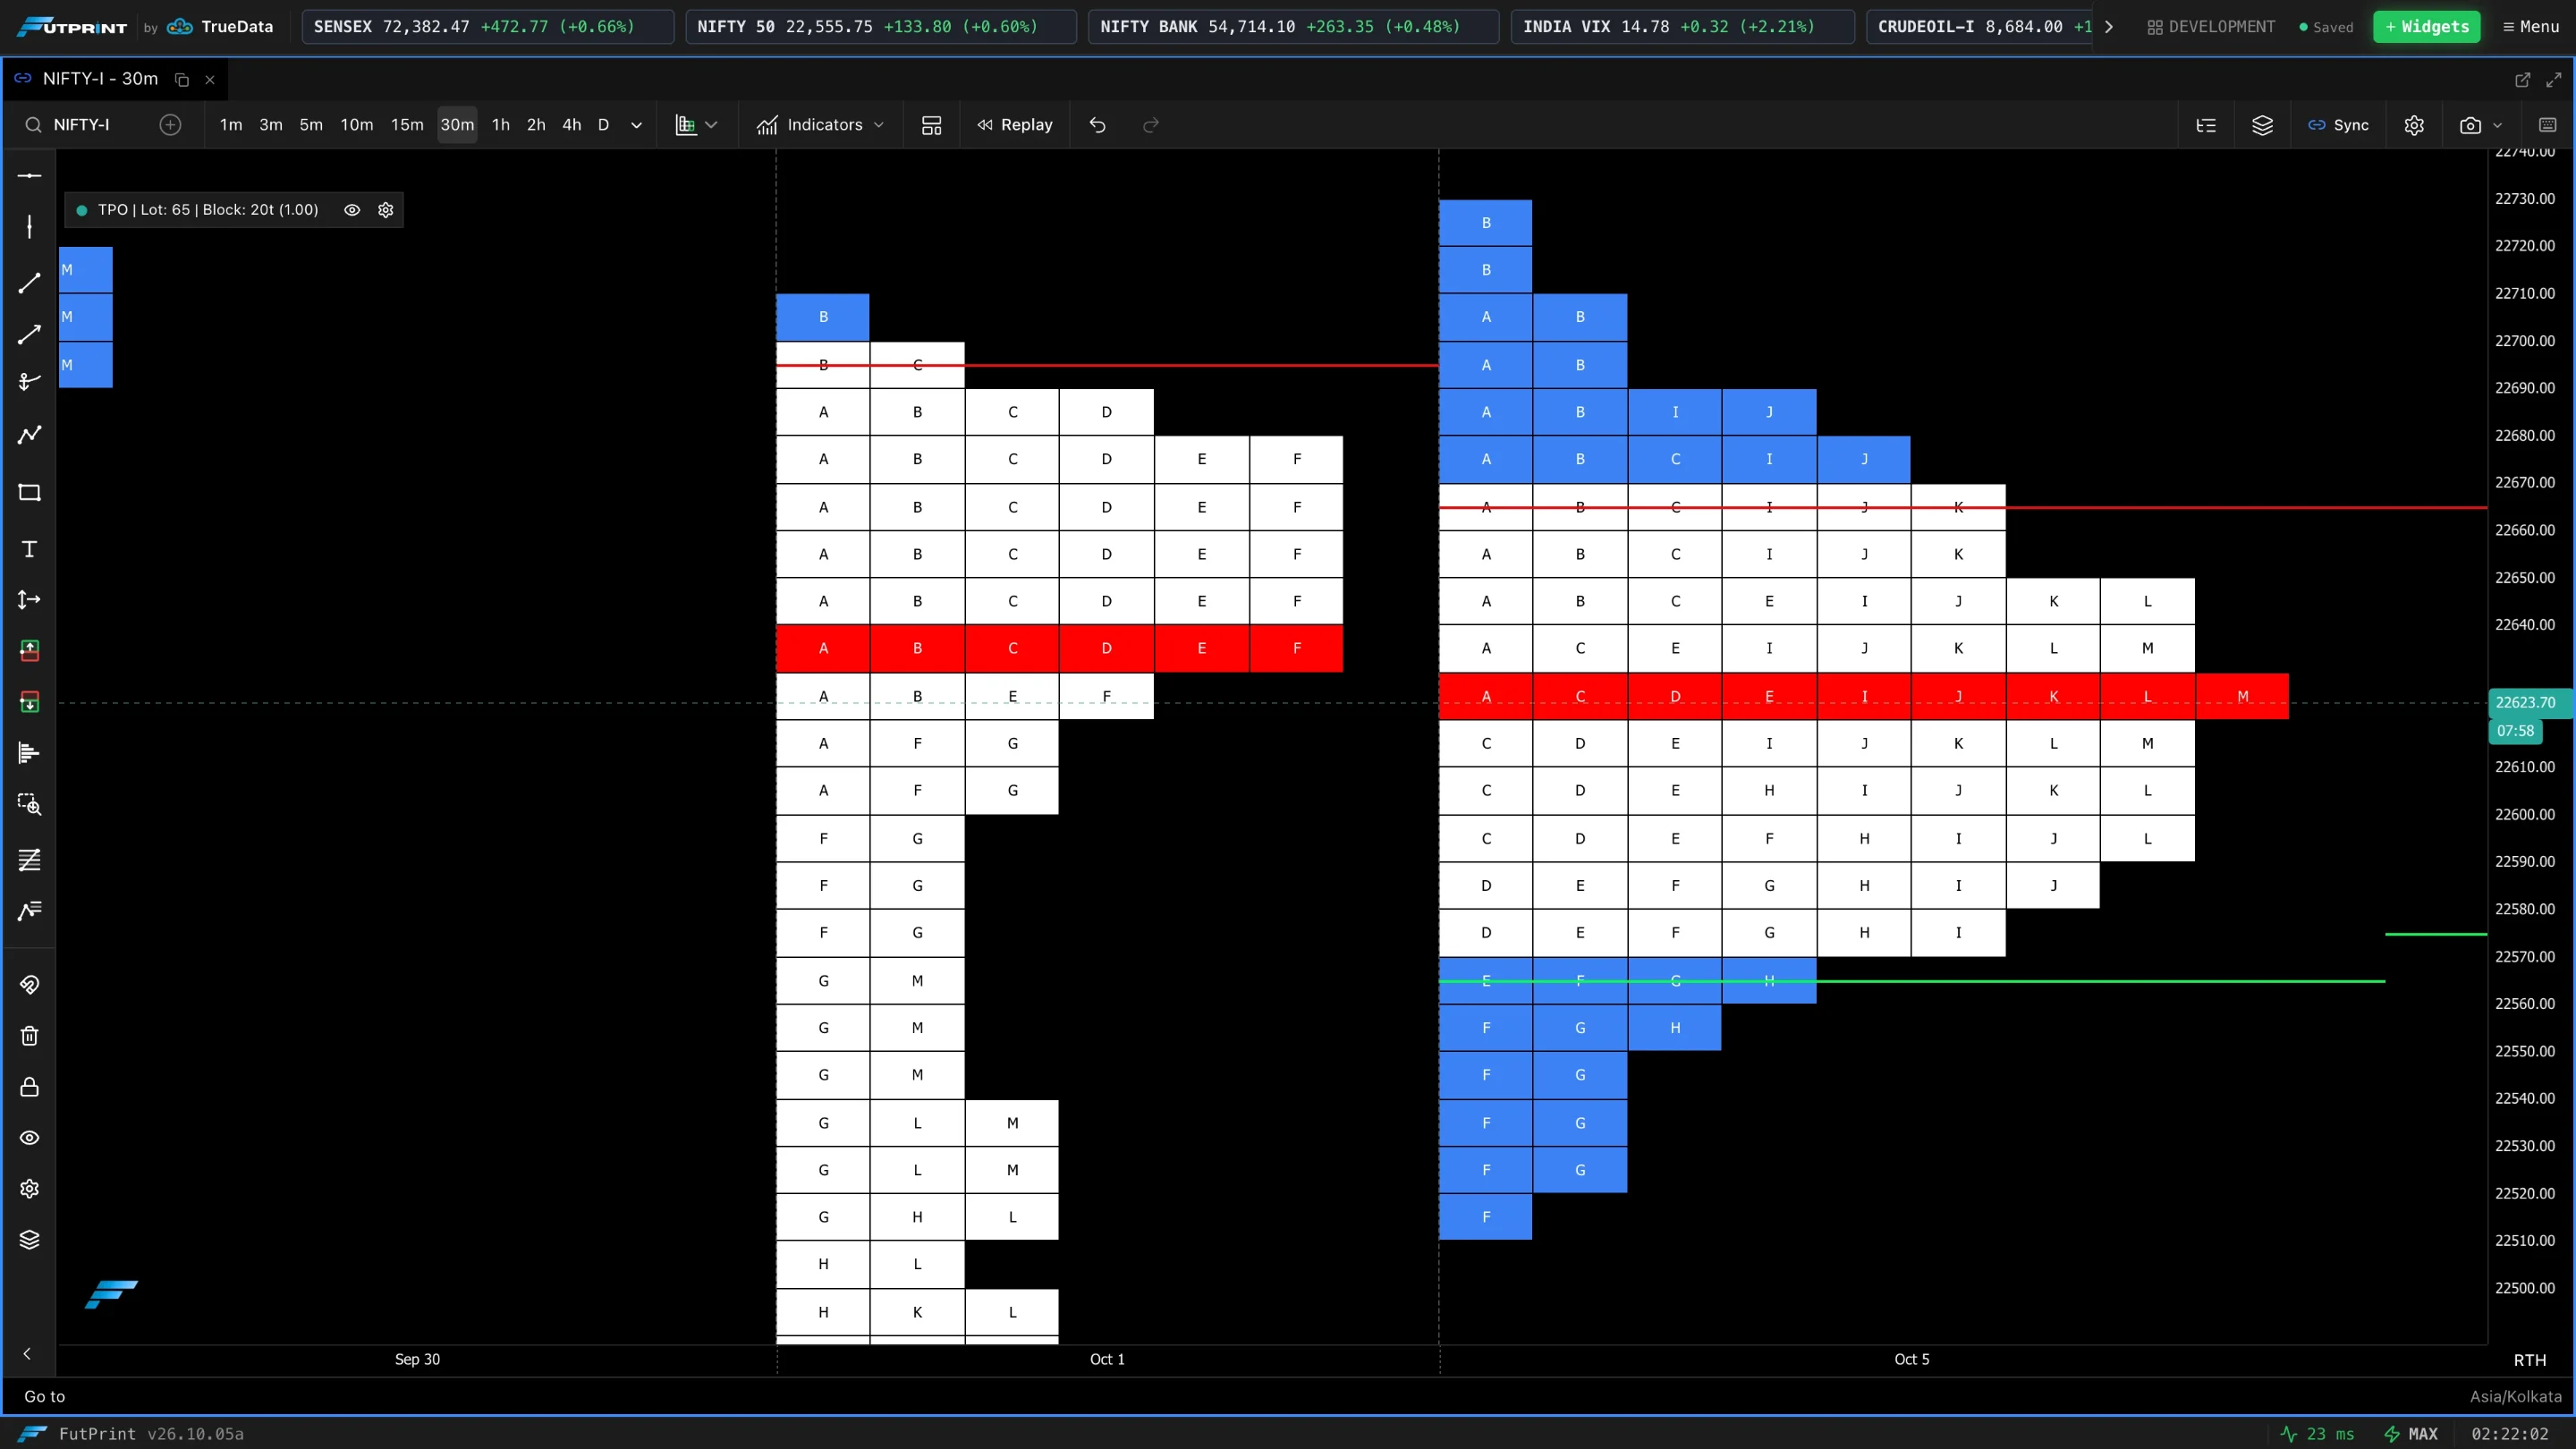
| Show VAH / Show VAL | Draw the Value Area High and Low lines independently, each with its own colour. |
| VA Width, VA Style | Thickness and style of those lines. |
| Extend Naked VA | Extends VAH and VAL through later profiles until those prices trade again. |
VWAP
| Setting | What it does |
|---|---|
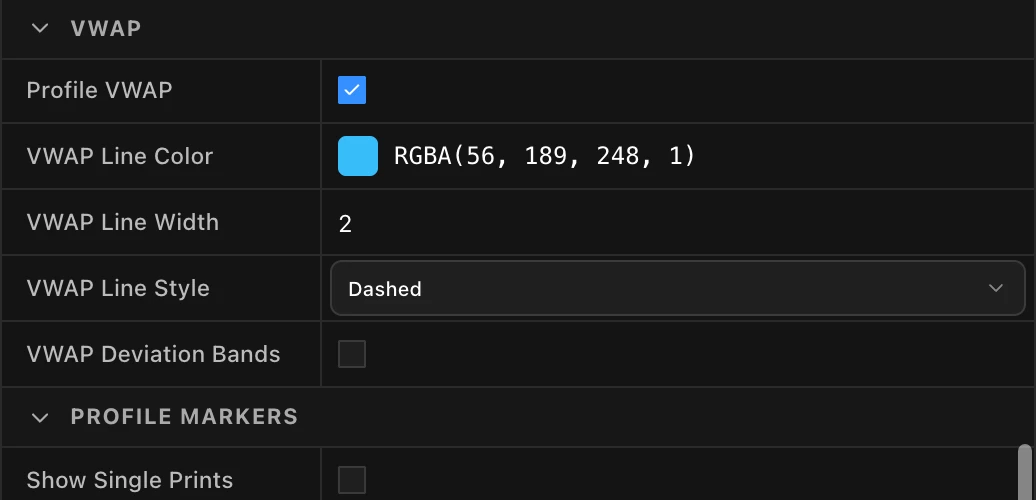
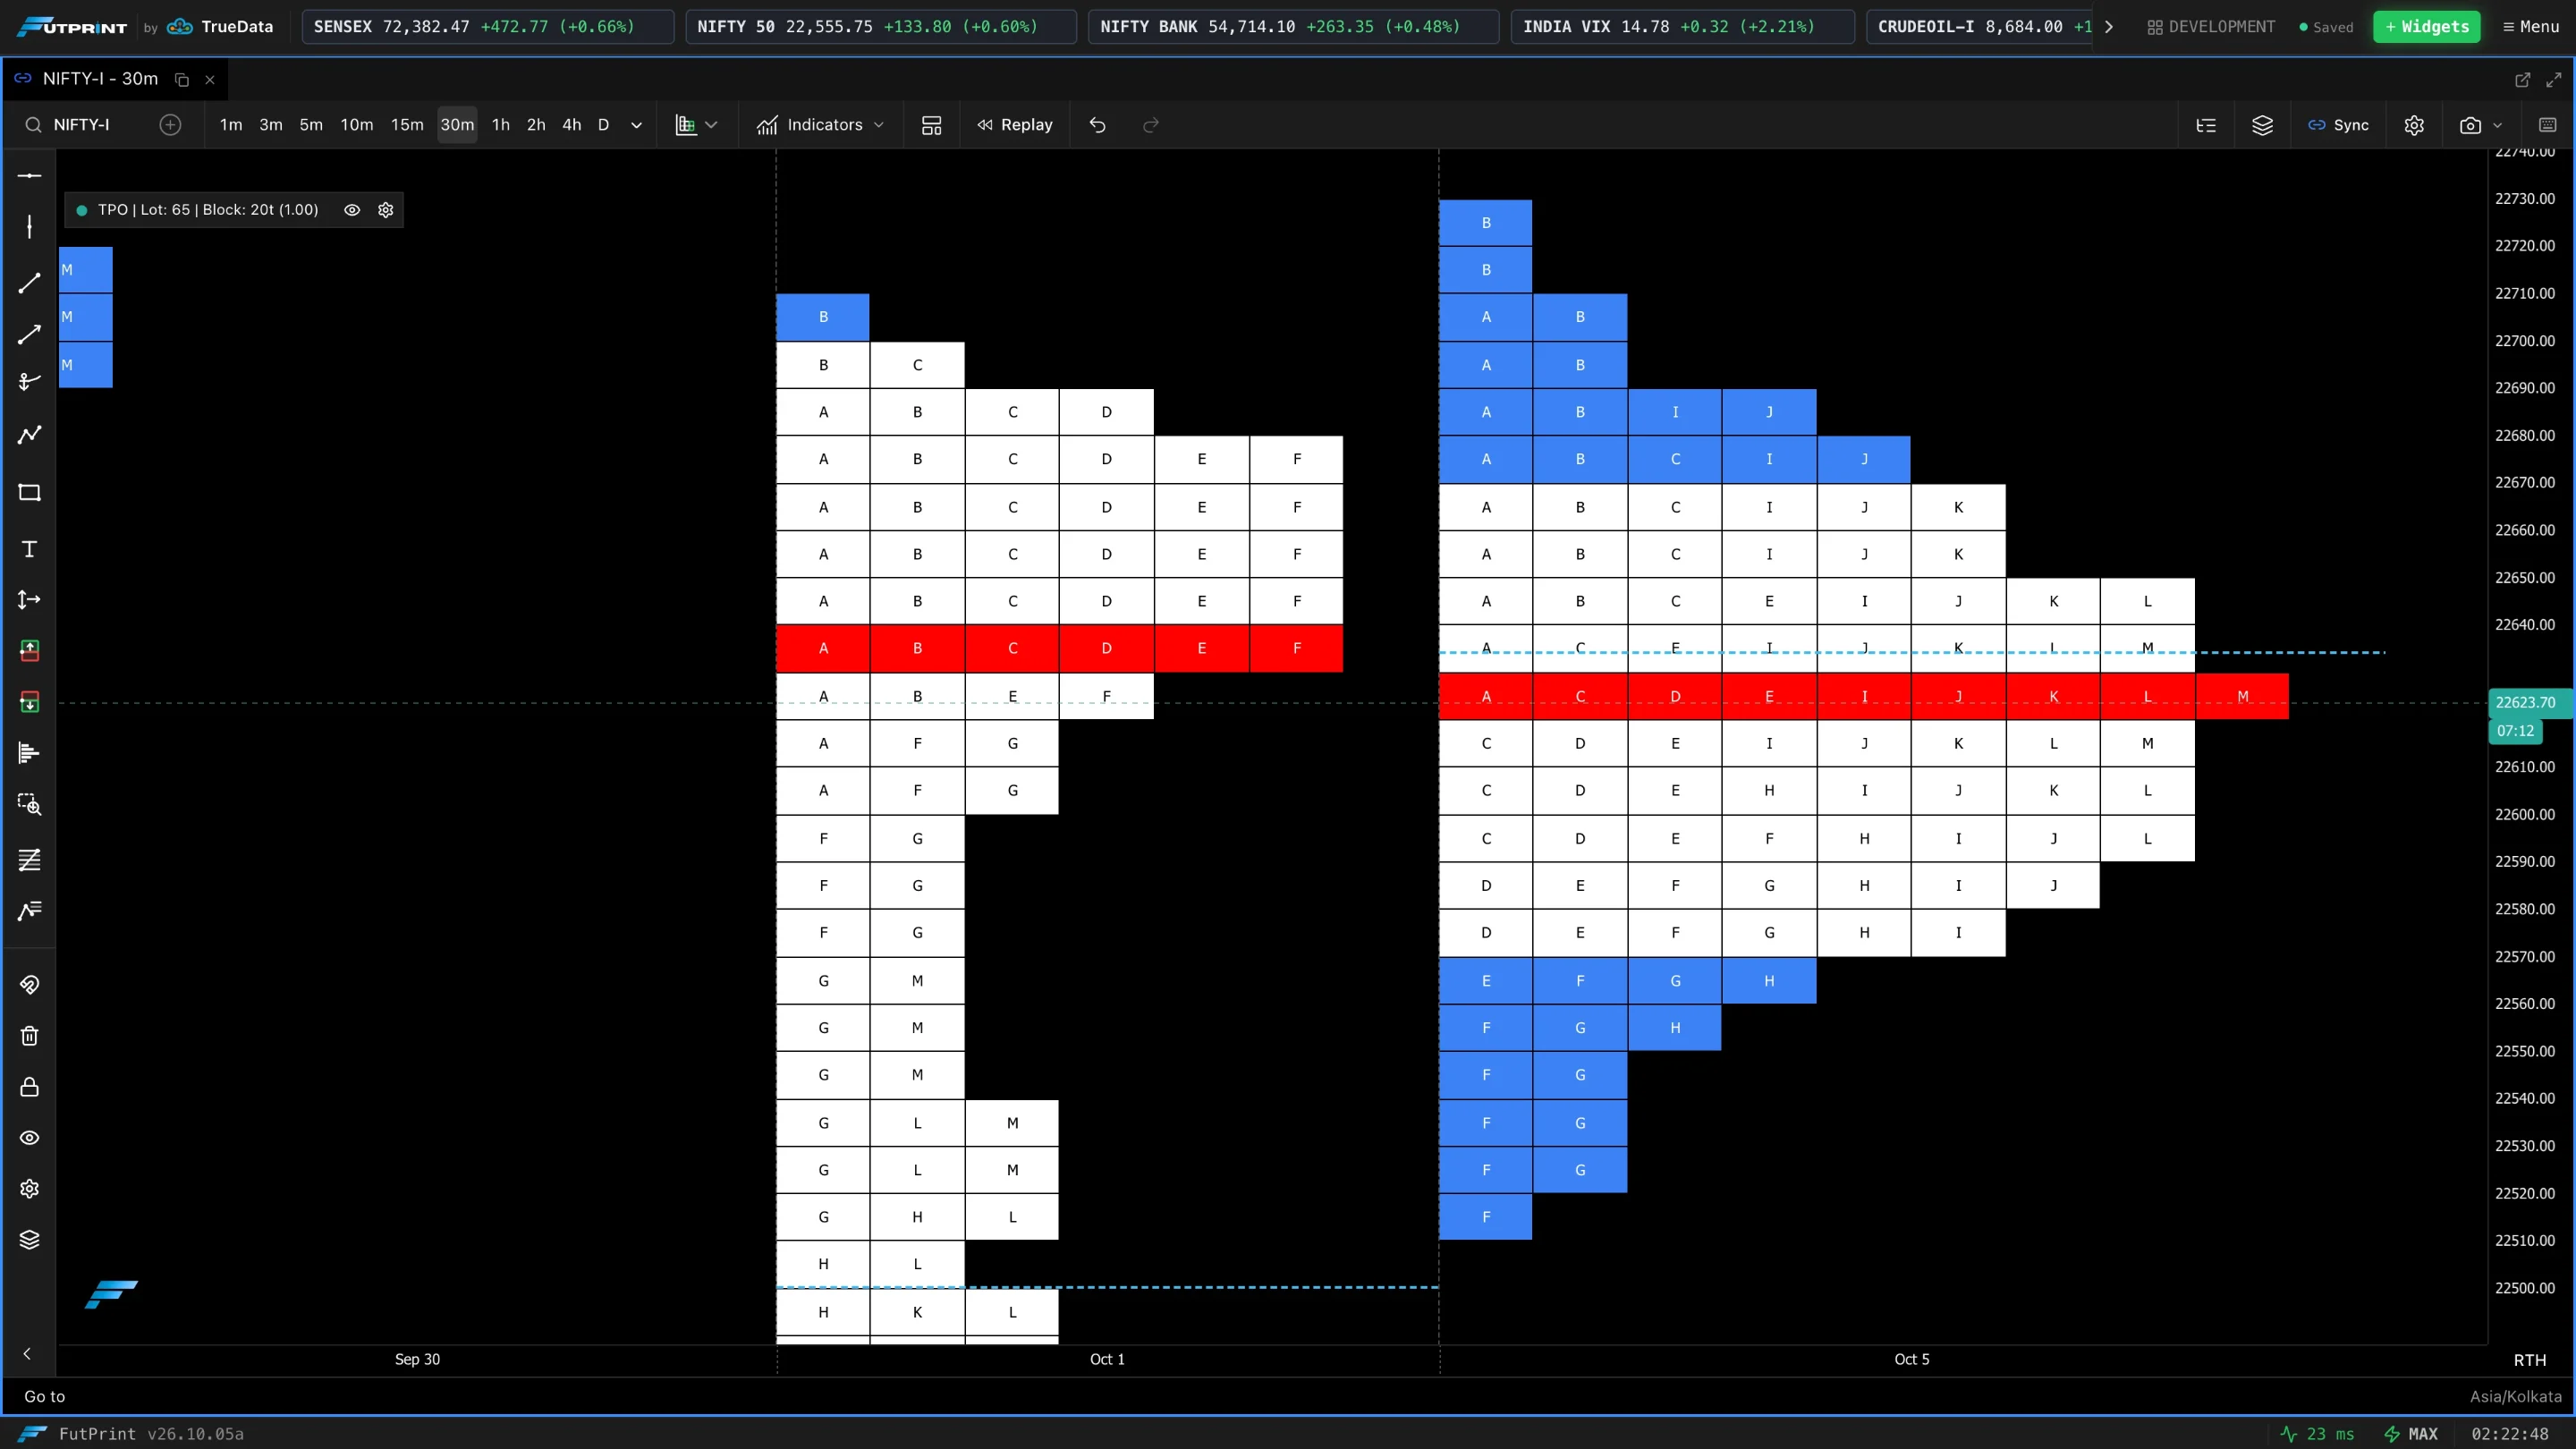
| Profile VWAP | Shows the volume-weighted price as a horizontal level in each profile. |
| VWAP Line Color / Width / Style | Appearance of the level. |
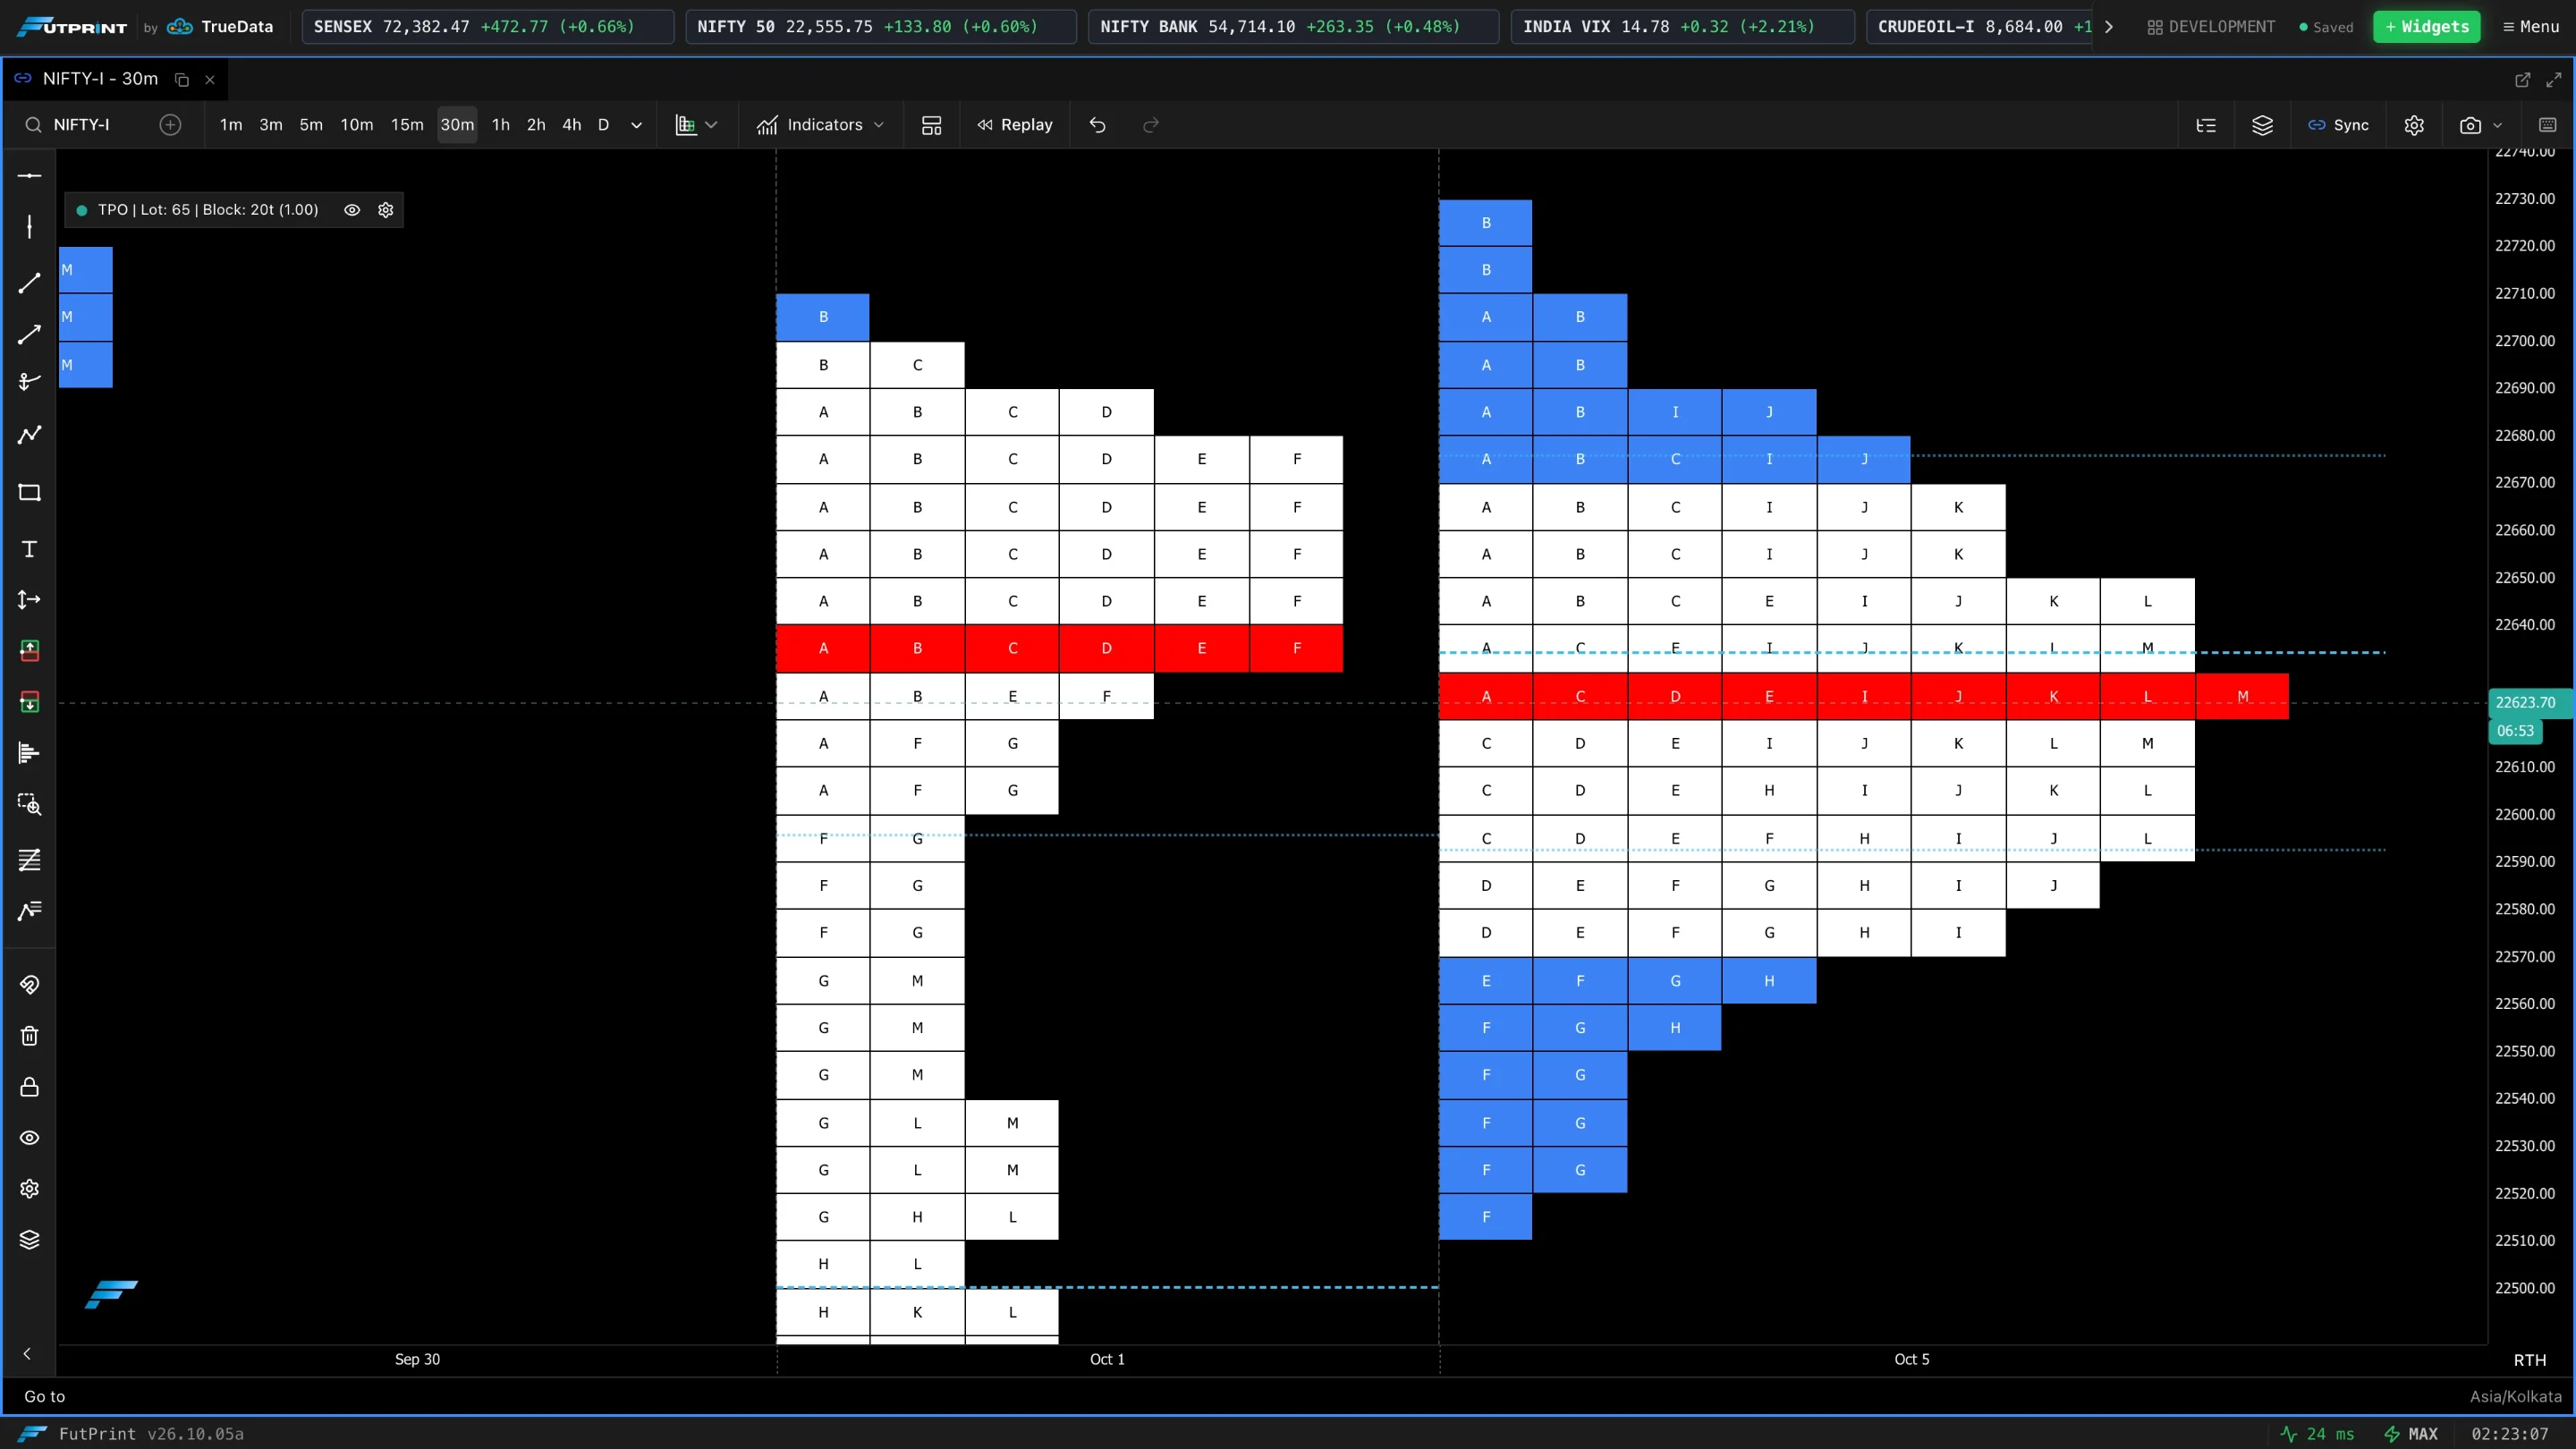
| VWAP Deviation Bands | Adds volume-weighted standard-deviation levels around the profile VWAP. |
| VWAP Band σ | The standard-deviation multiplier used by the bands. |
Profile Markers
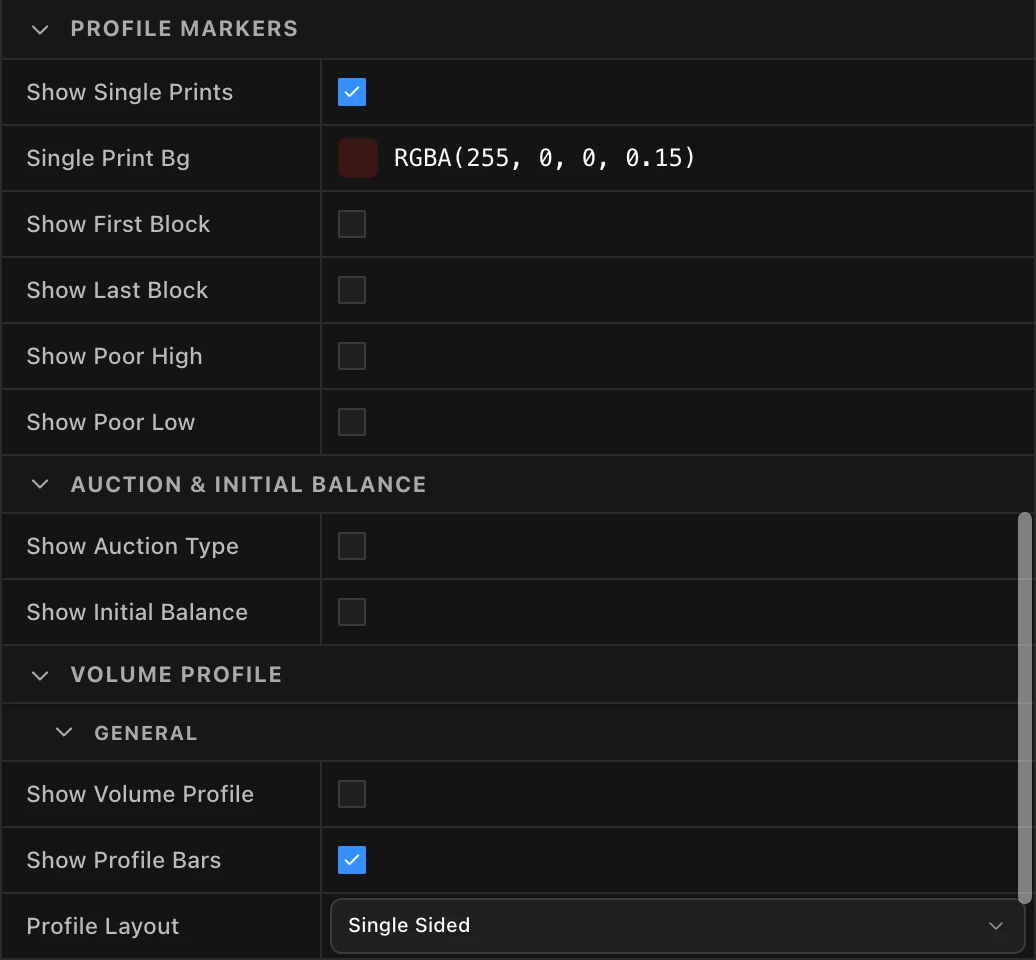
| Setting | What it does |
|---|---|
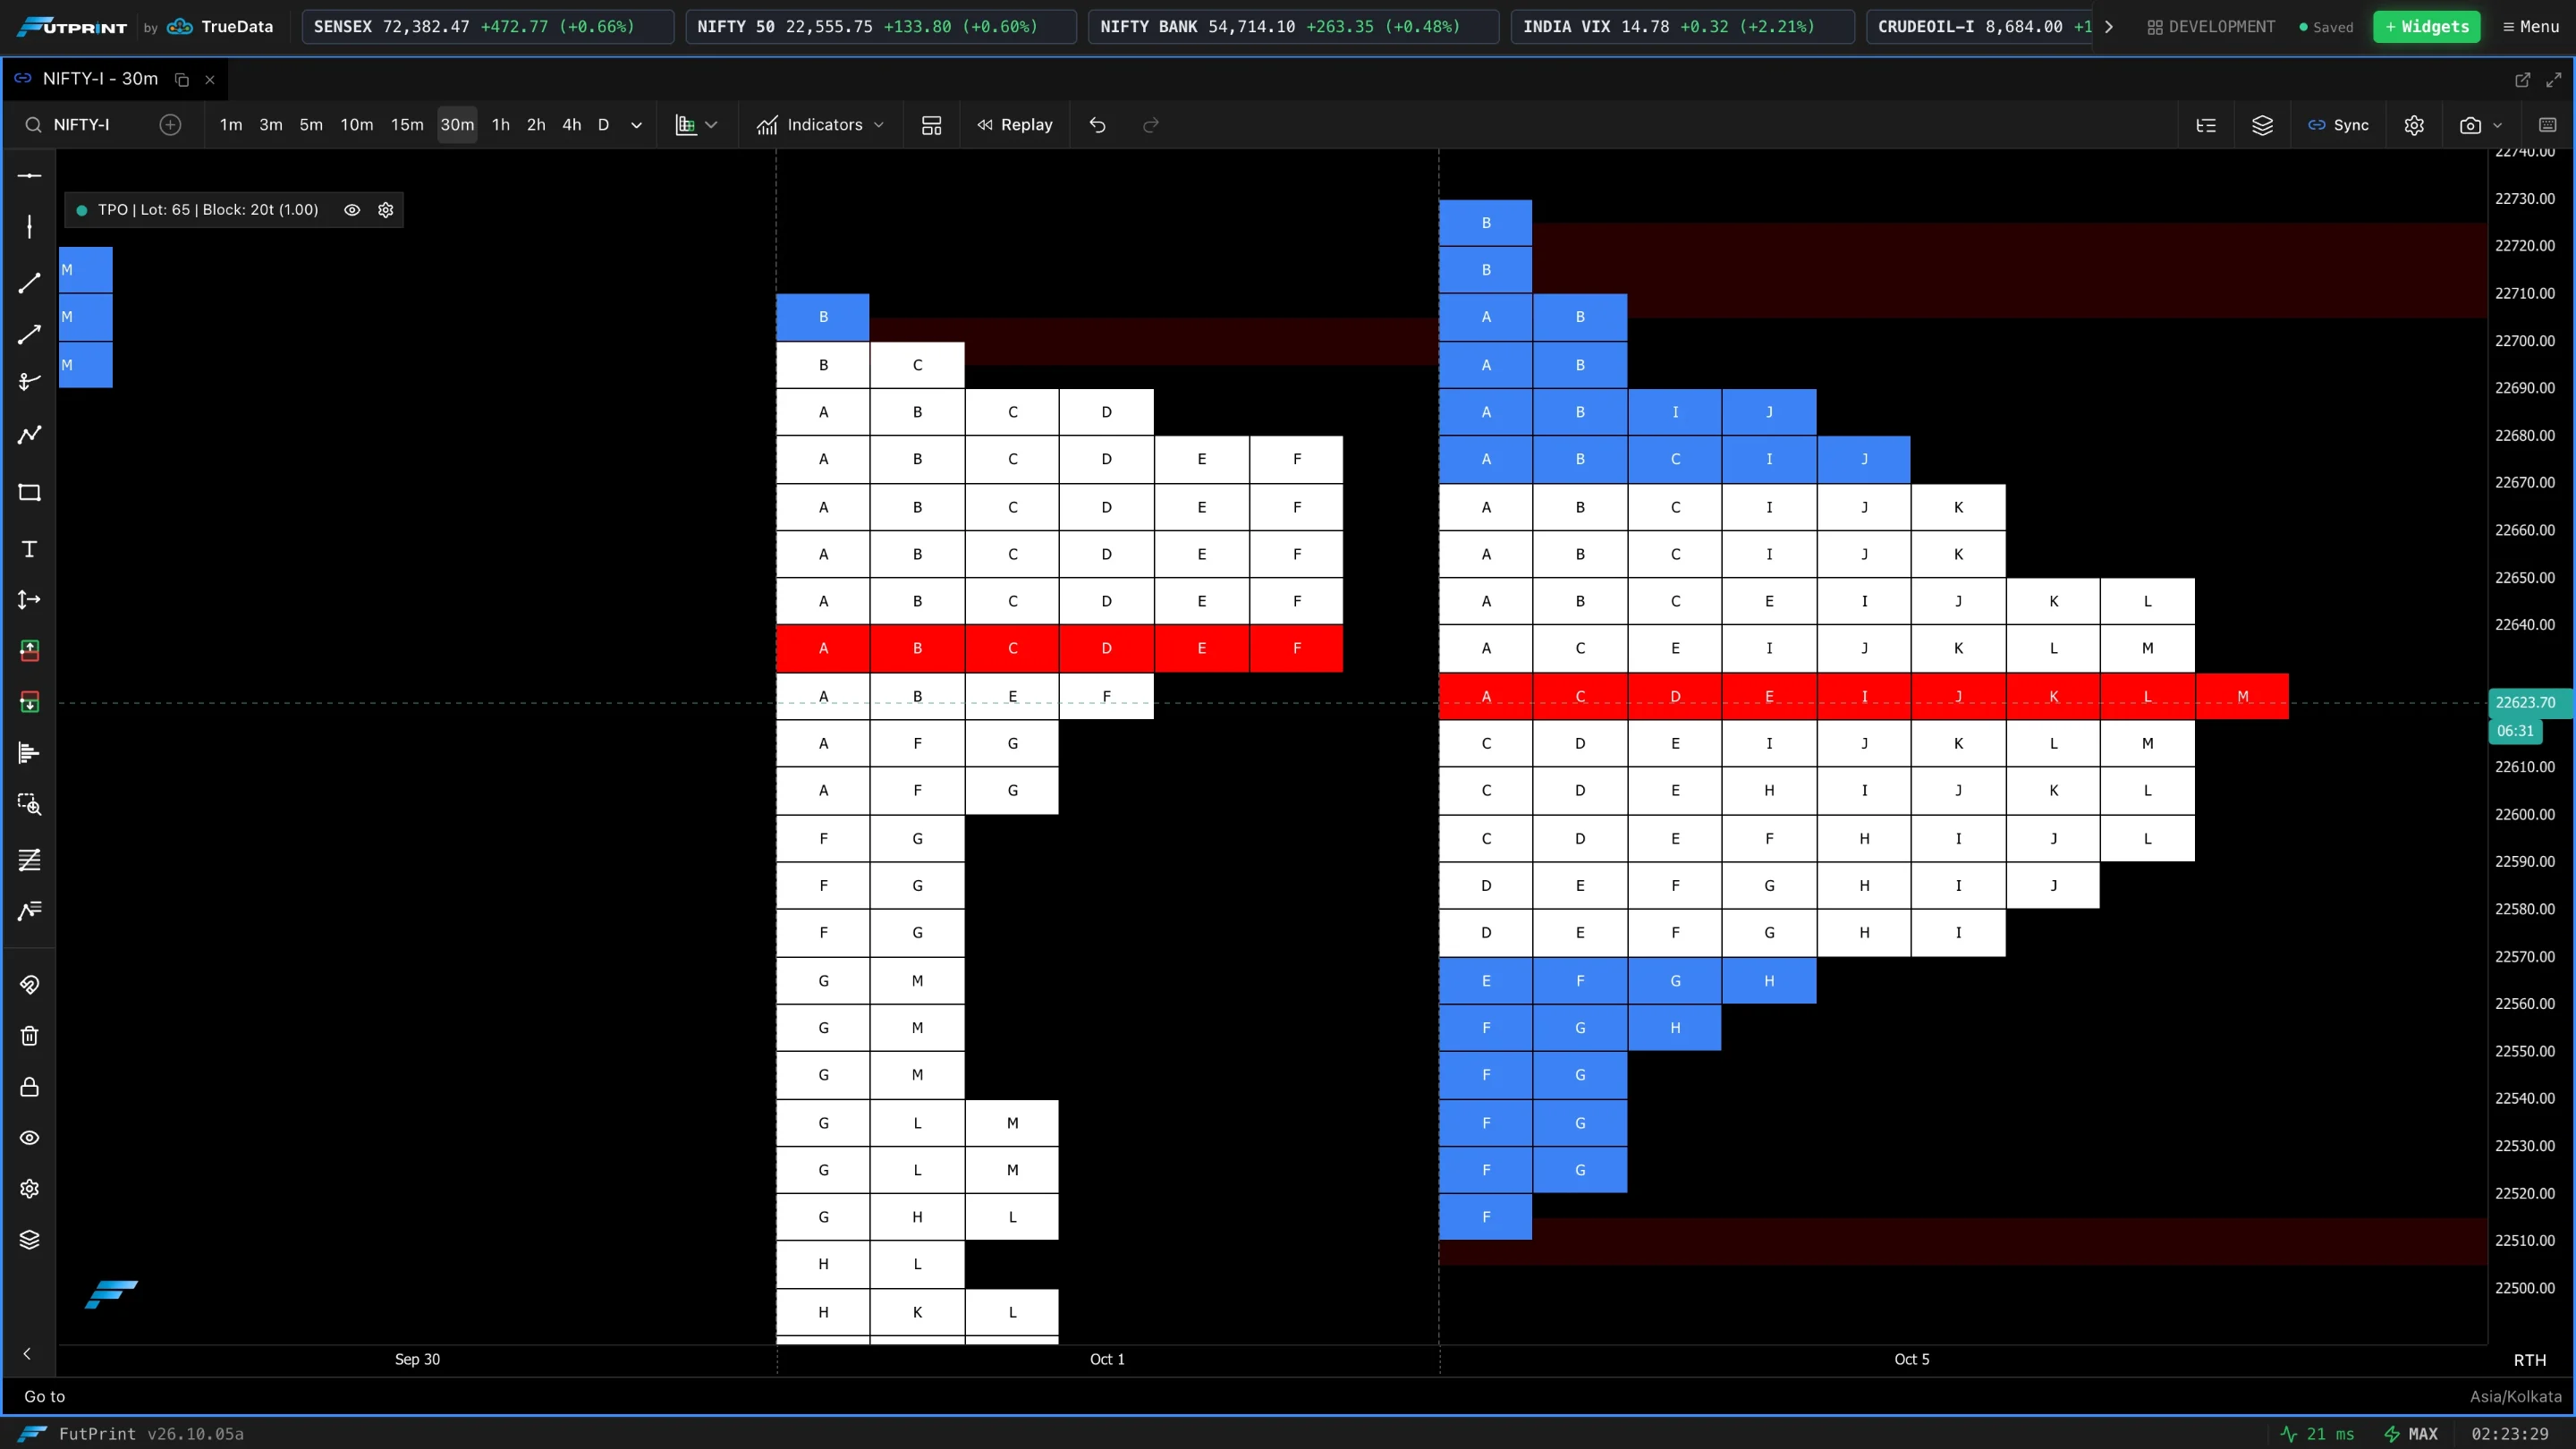
| Show Single Prints | Highlights single-print zones — price levels with only one TPO. |
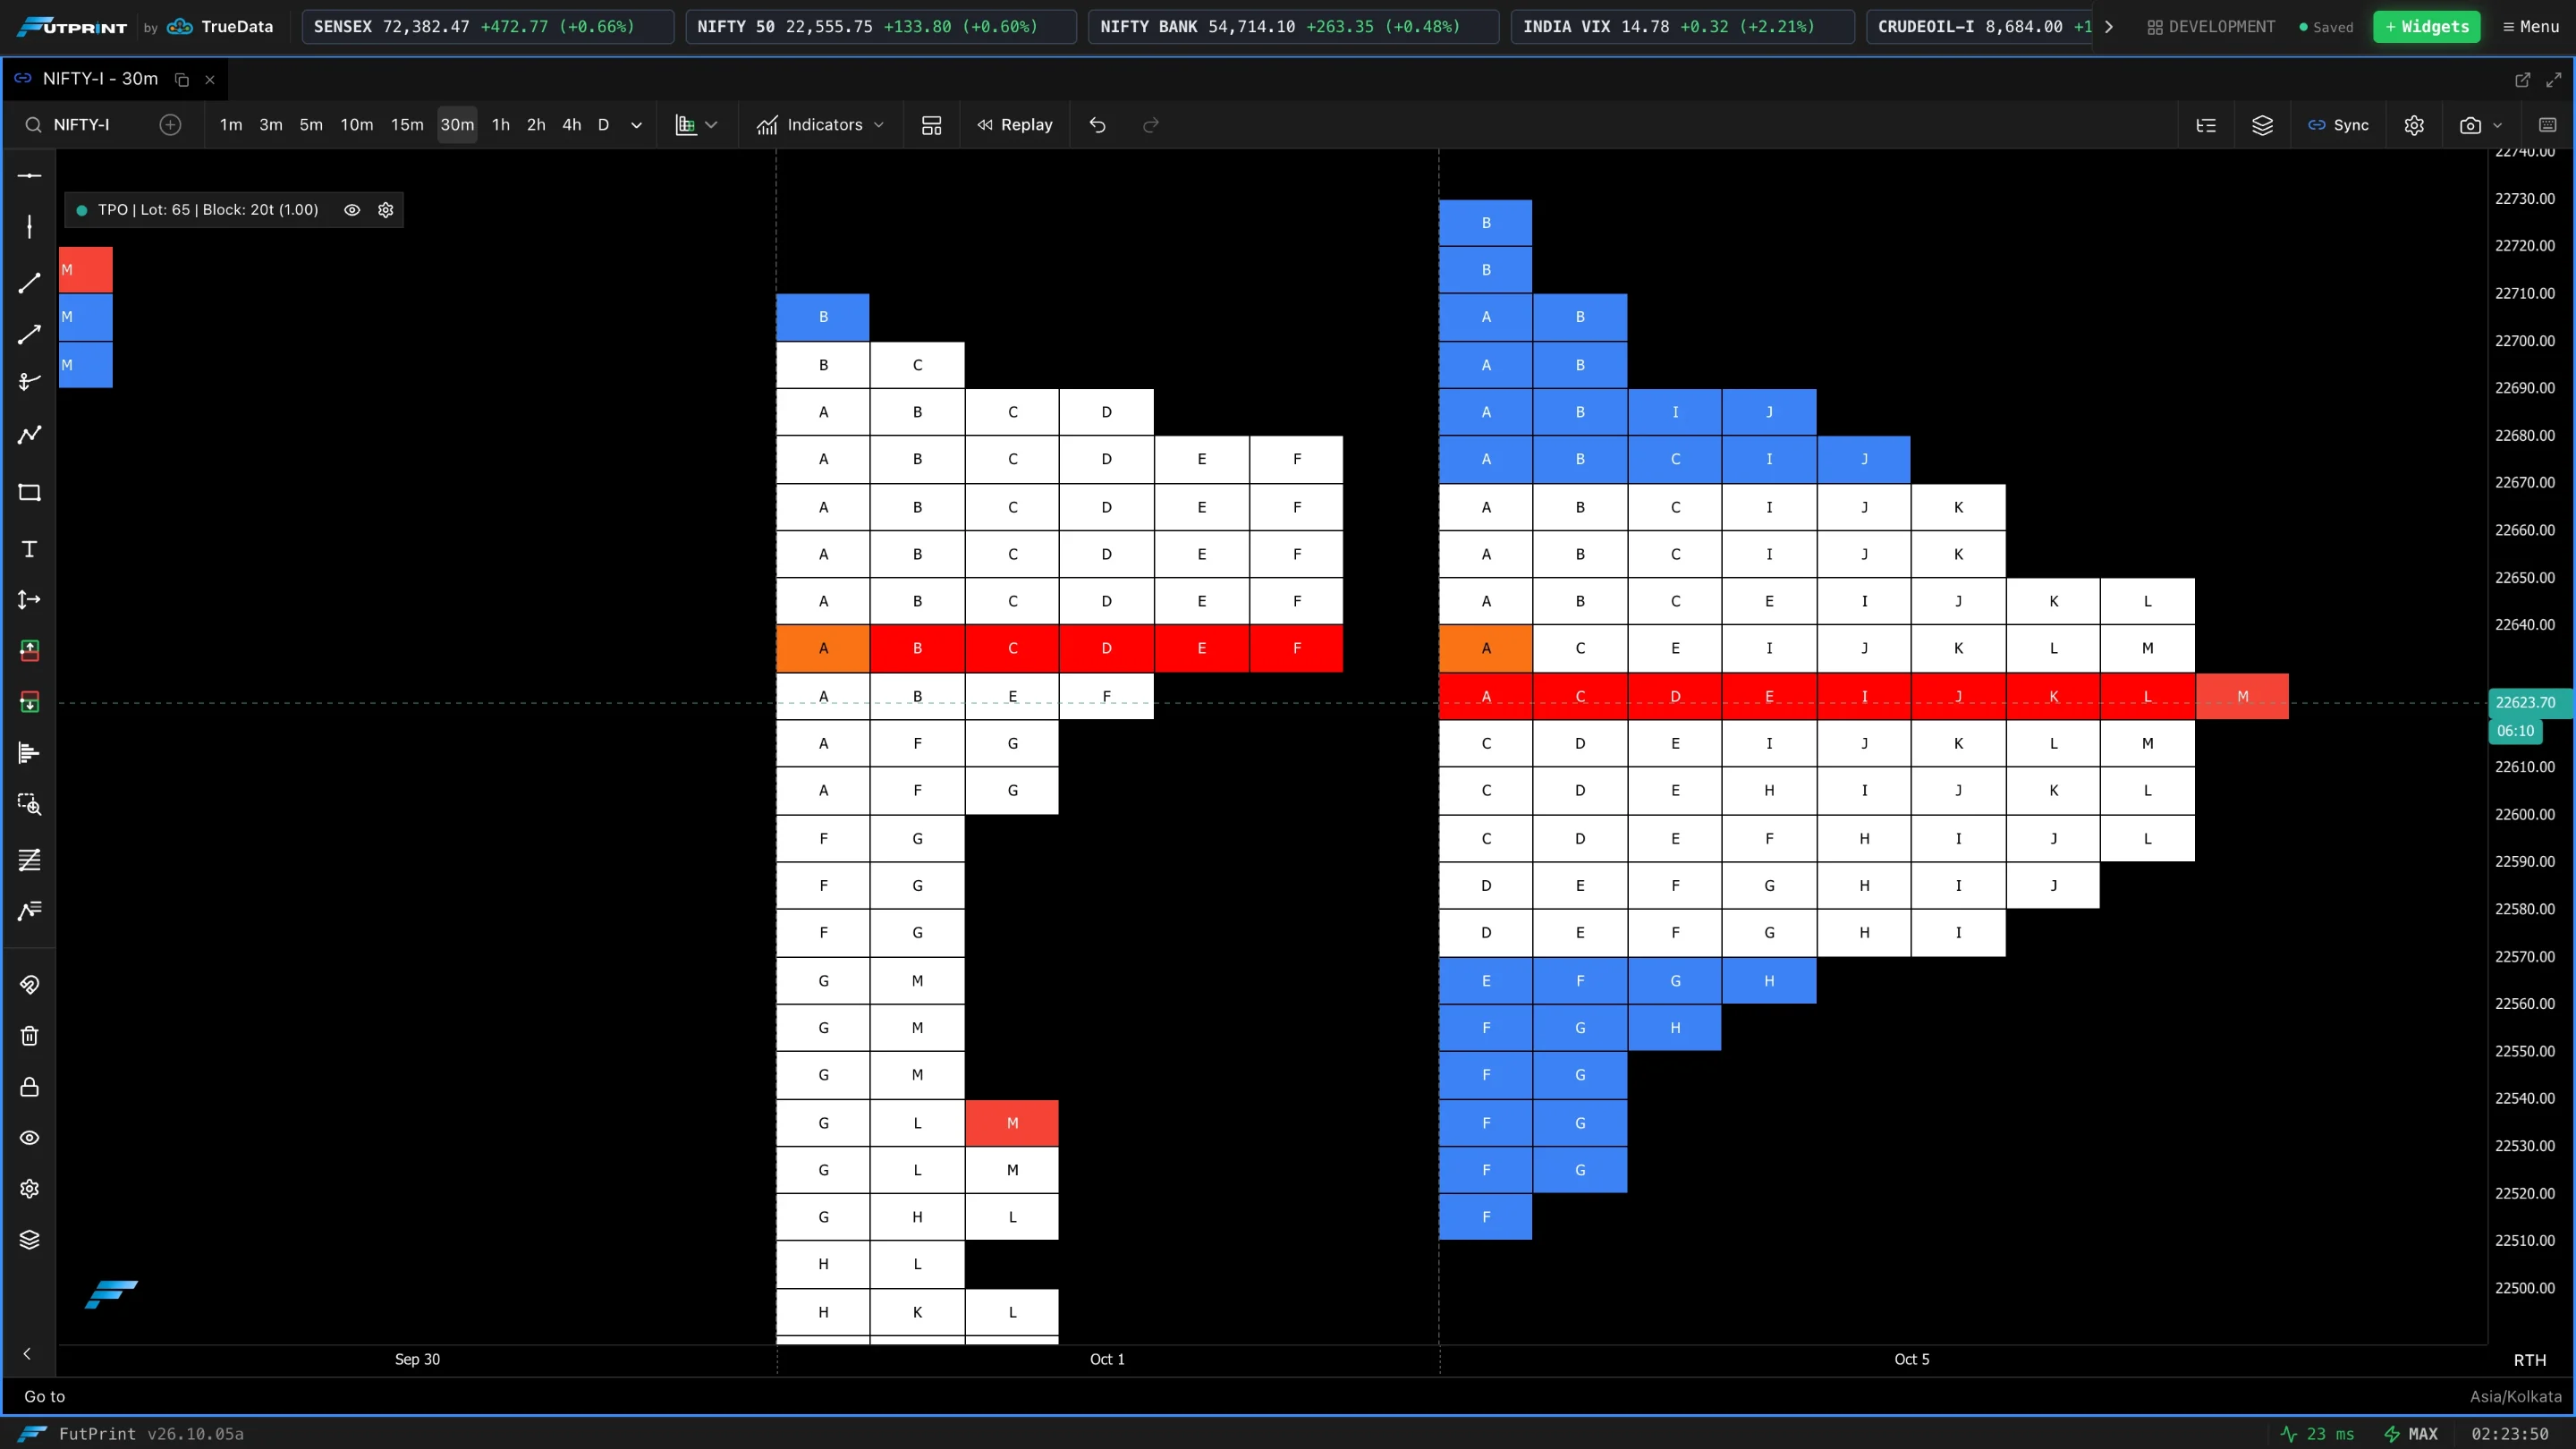
| Show First Block | Highlights the first TPO block (the open). |
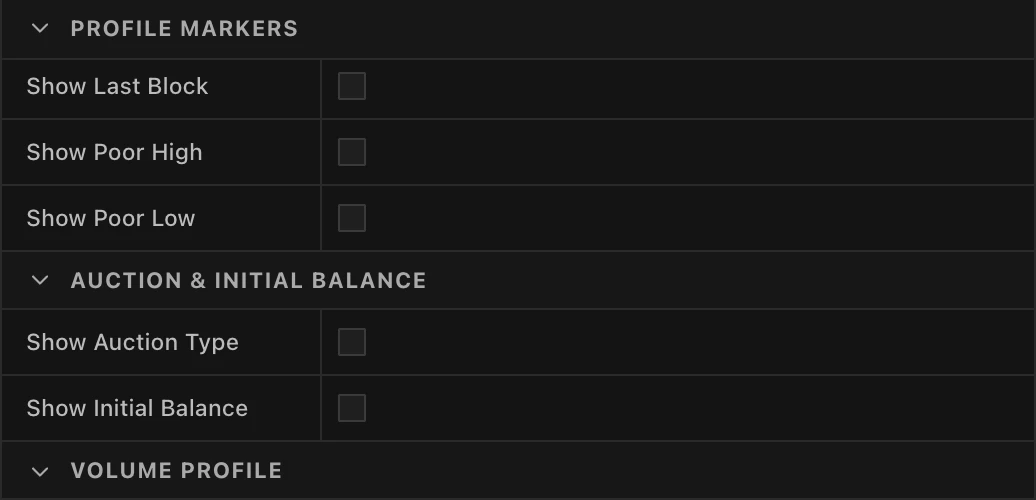
| Show Last Block | Highlights the last TPO block (the close). |
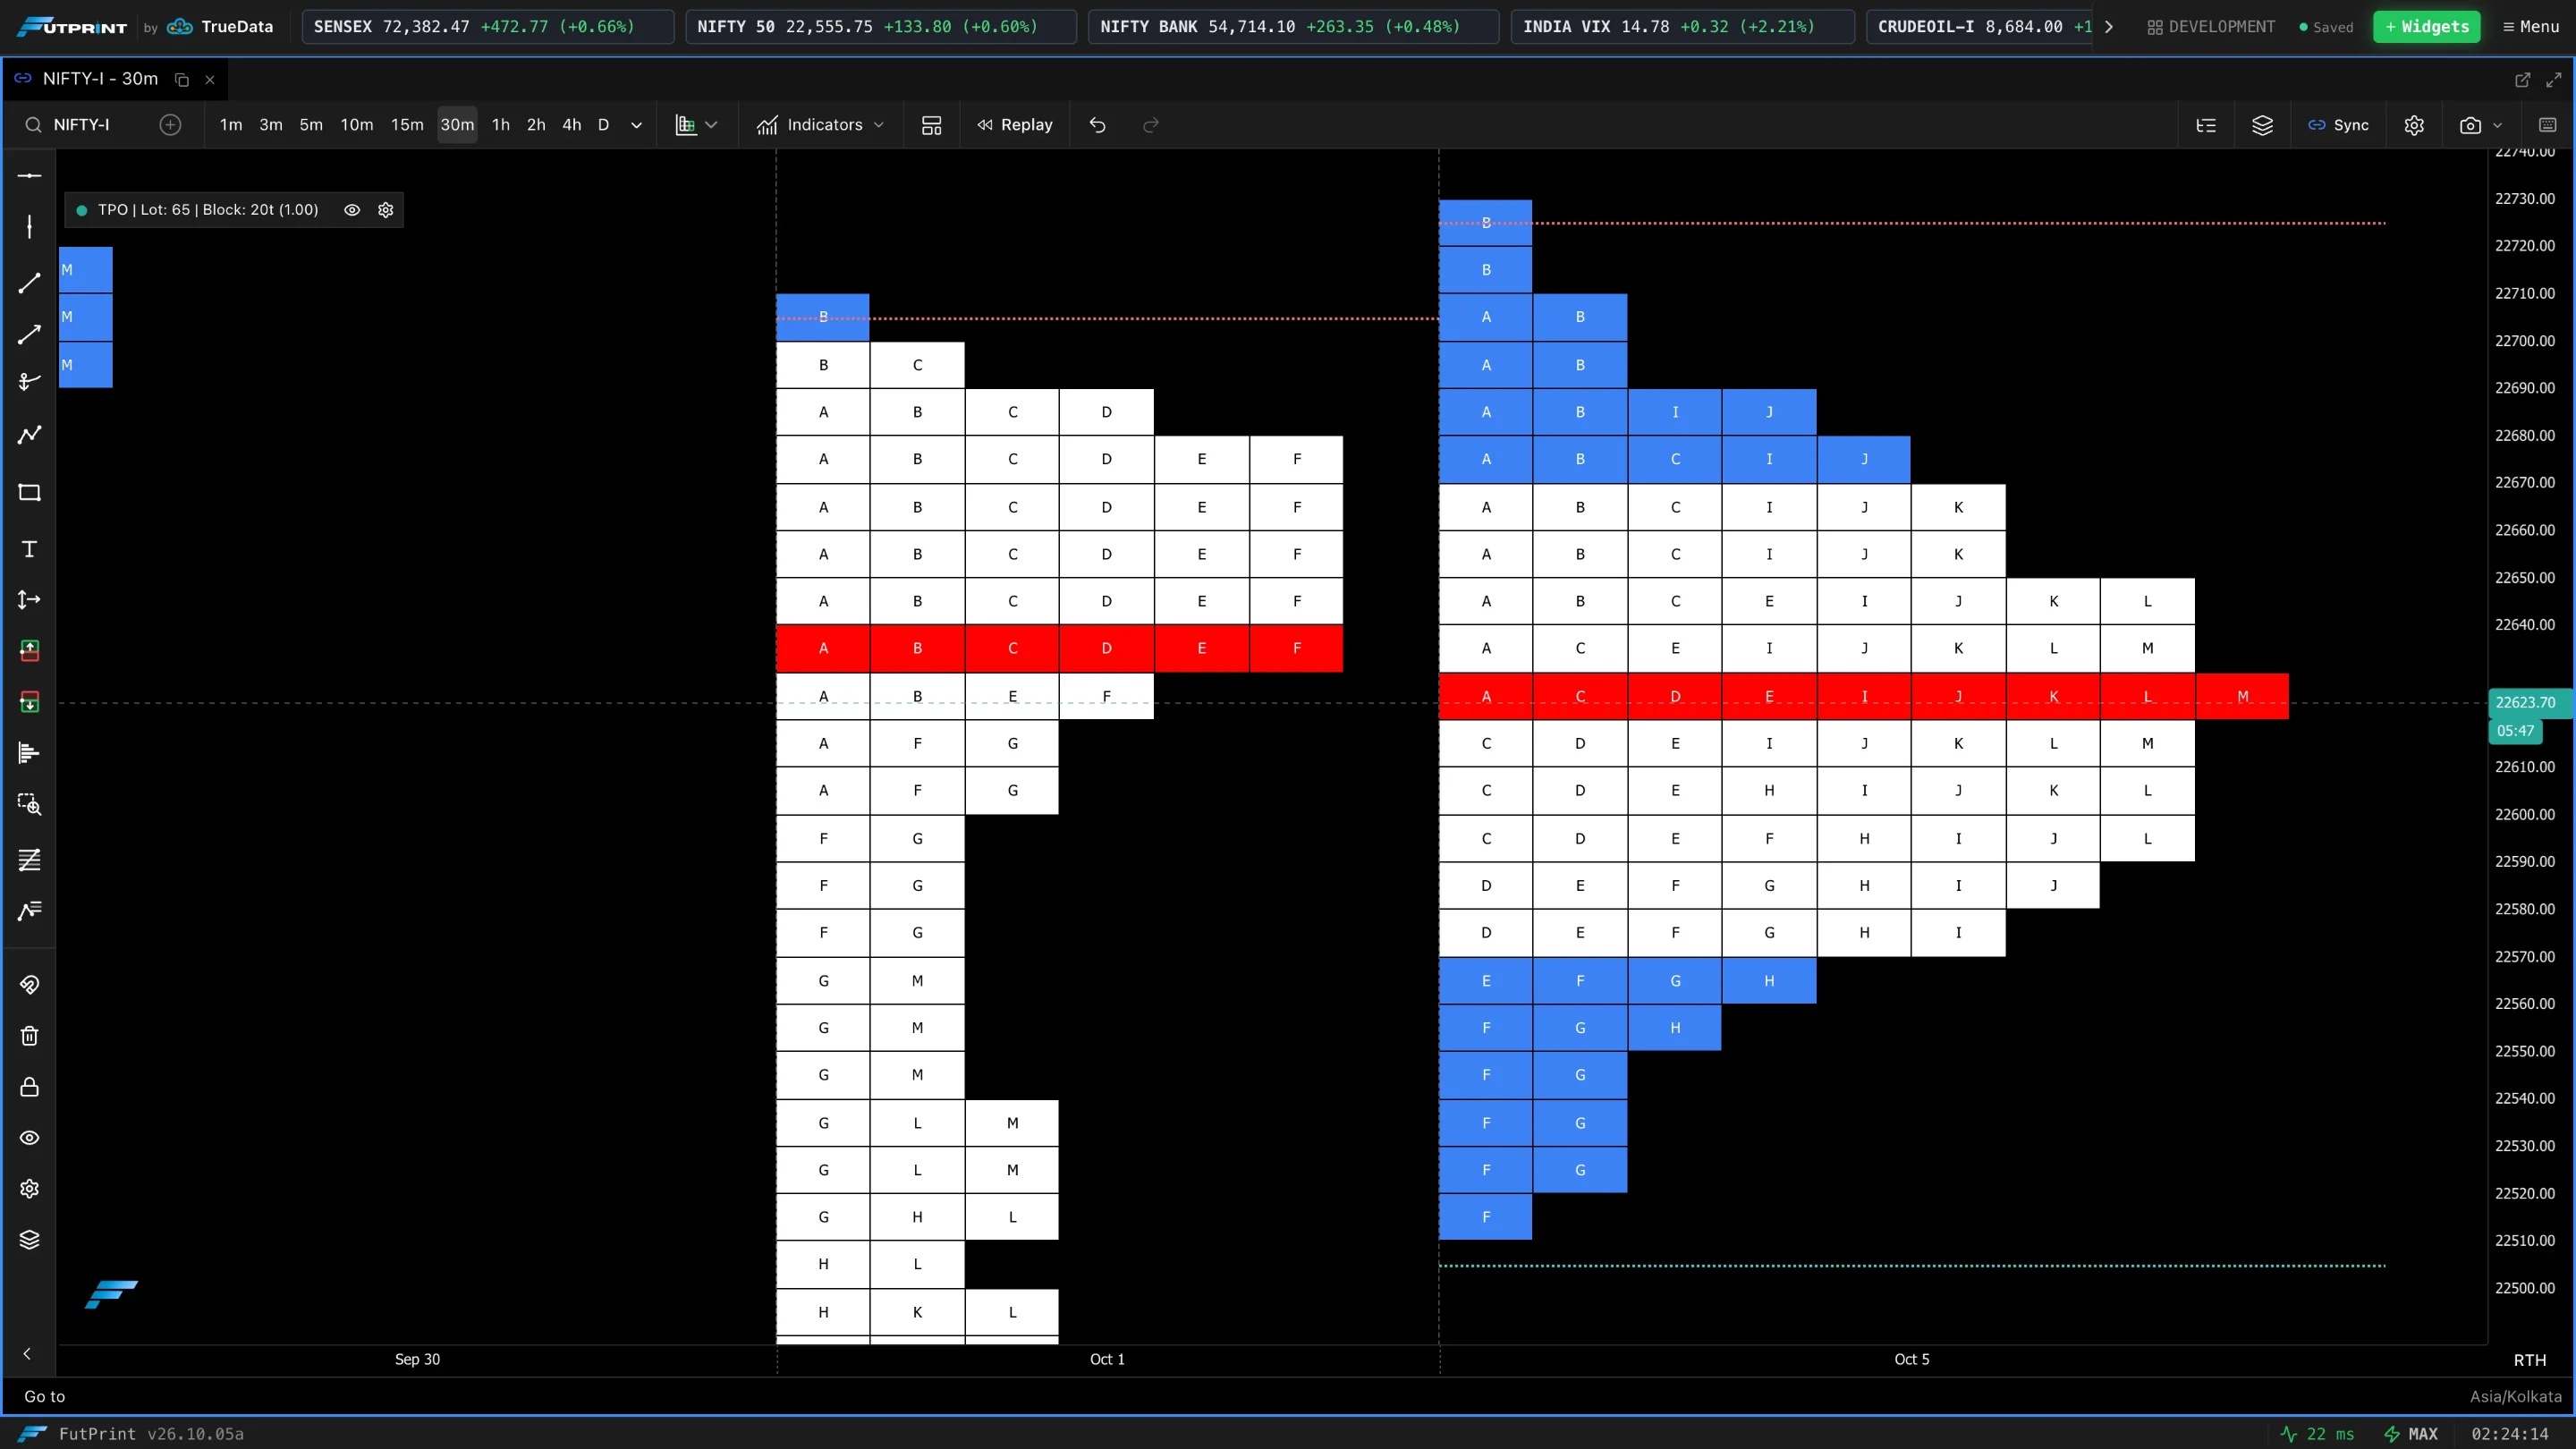
| Show Poor High | Marks a poor high. |
| Show Poor Low | Marks a poor low. |
Each marker has its own colour; poor highs and lows also have a line width and style.
Auction & Initial Balance
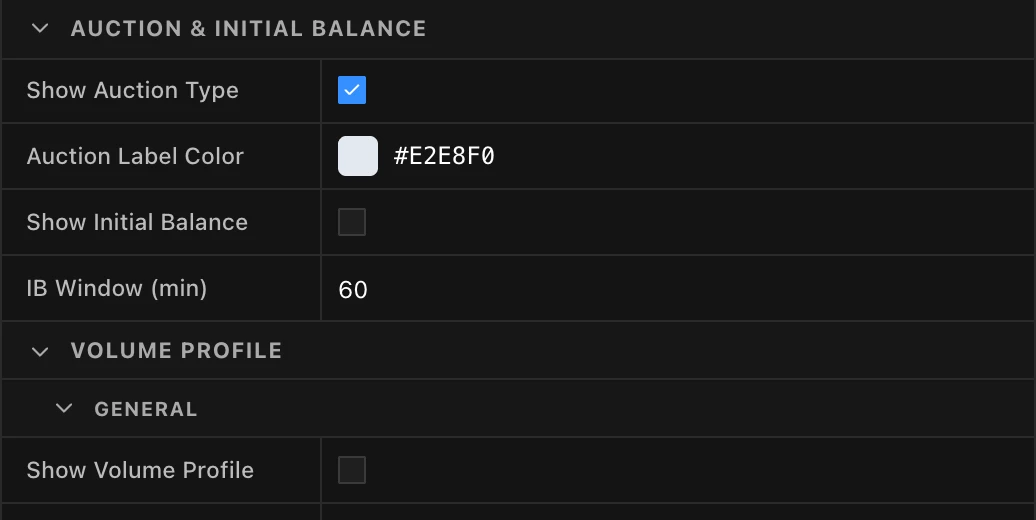
| Setting | What it does |
|---|---|
| Show Auction Type | Labels each session with its Auction Market Theory type (Open Drive, Trend Day, Neutral, and so on). |
| Show Initial Balance | Marks the Initial Balance — the range of the opening window. |
| IB Window (min) | Length of the opening window, used for the IB lines and for auction-type detection. |
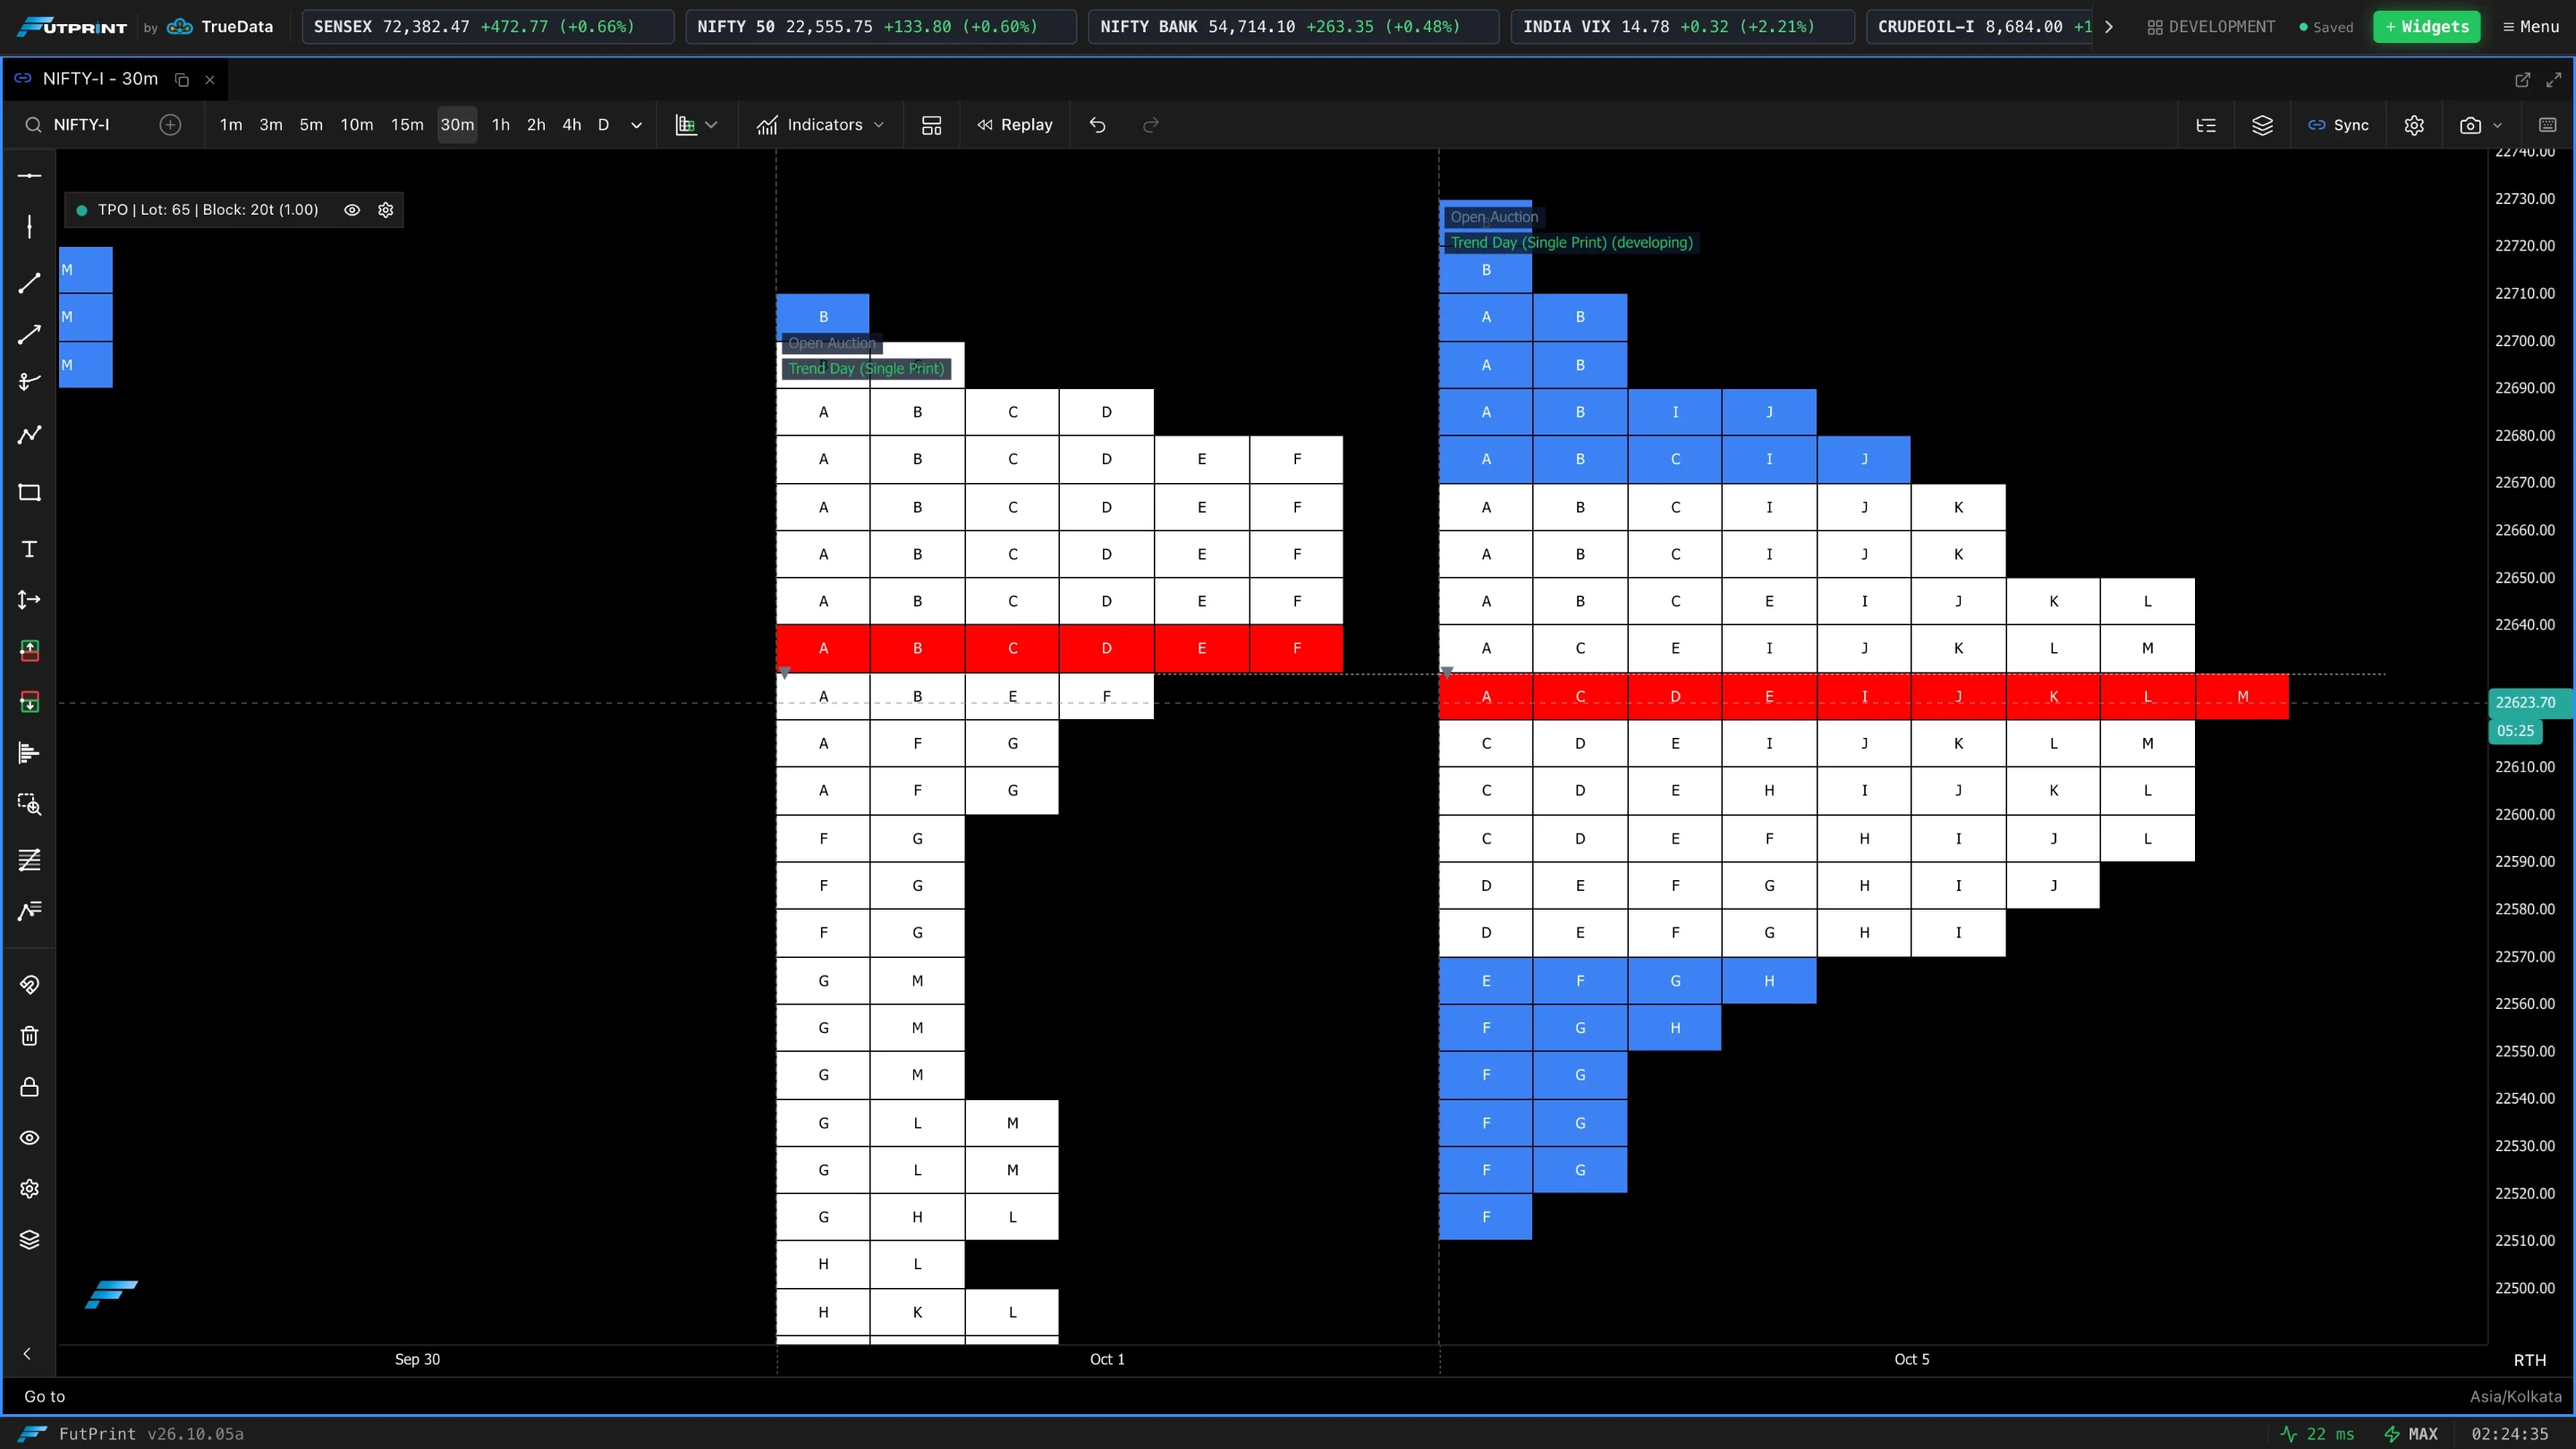
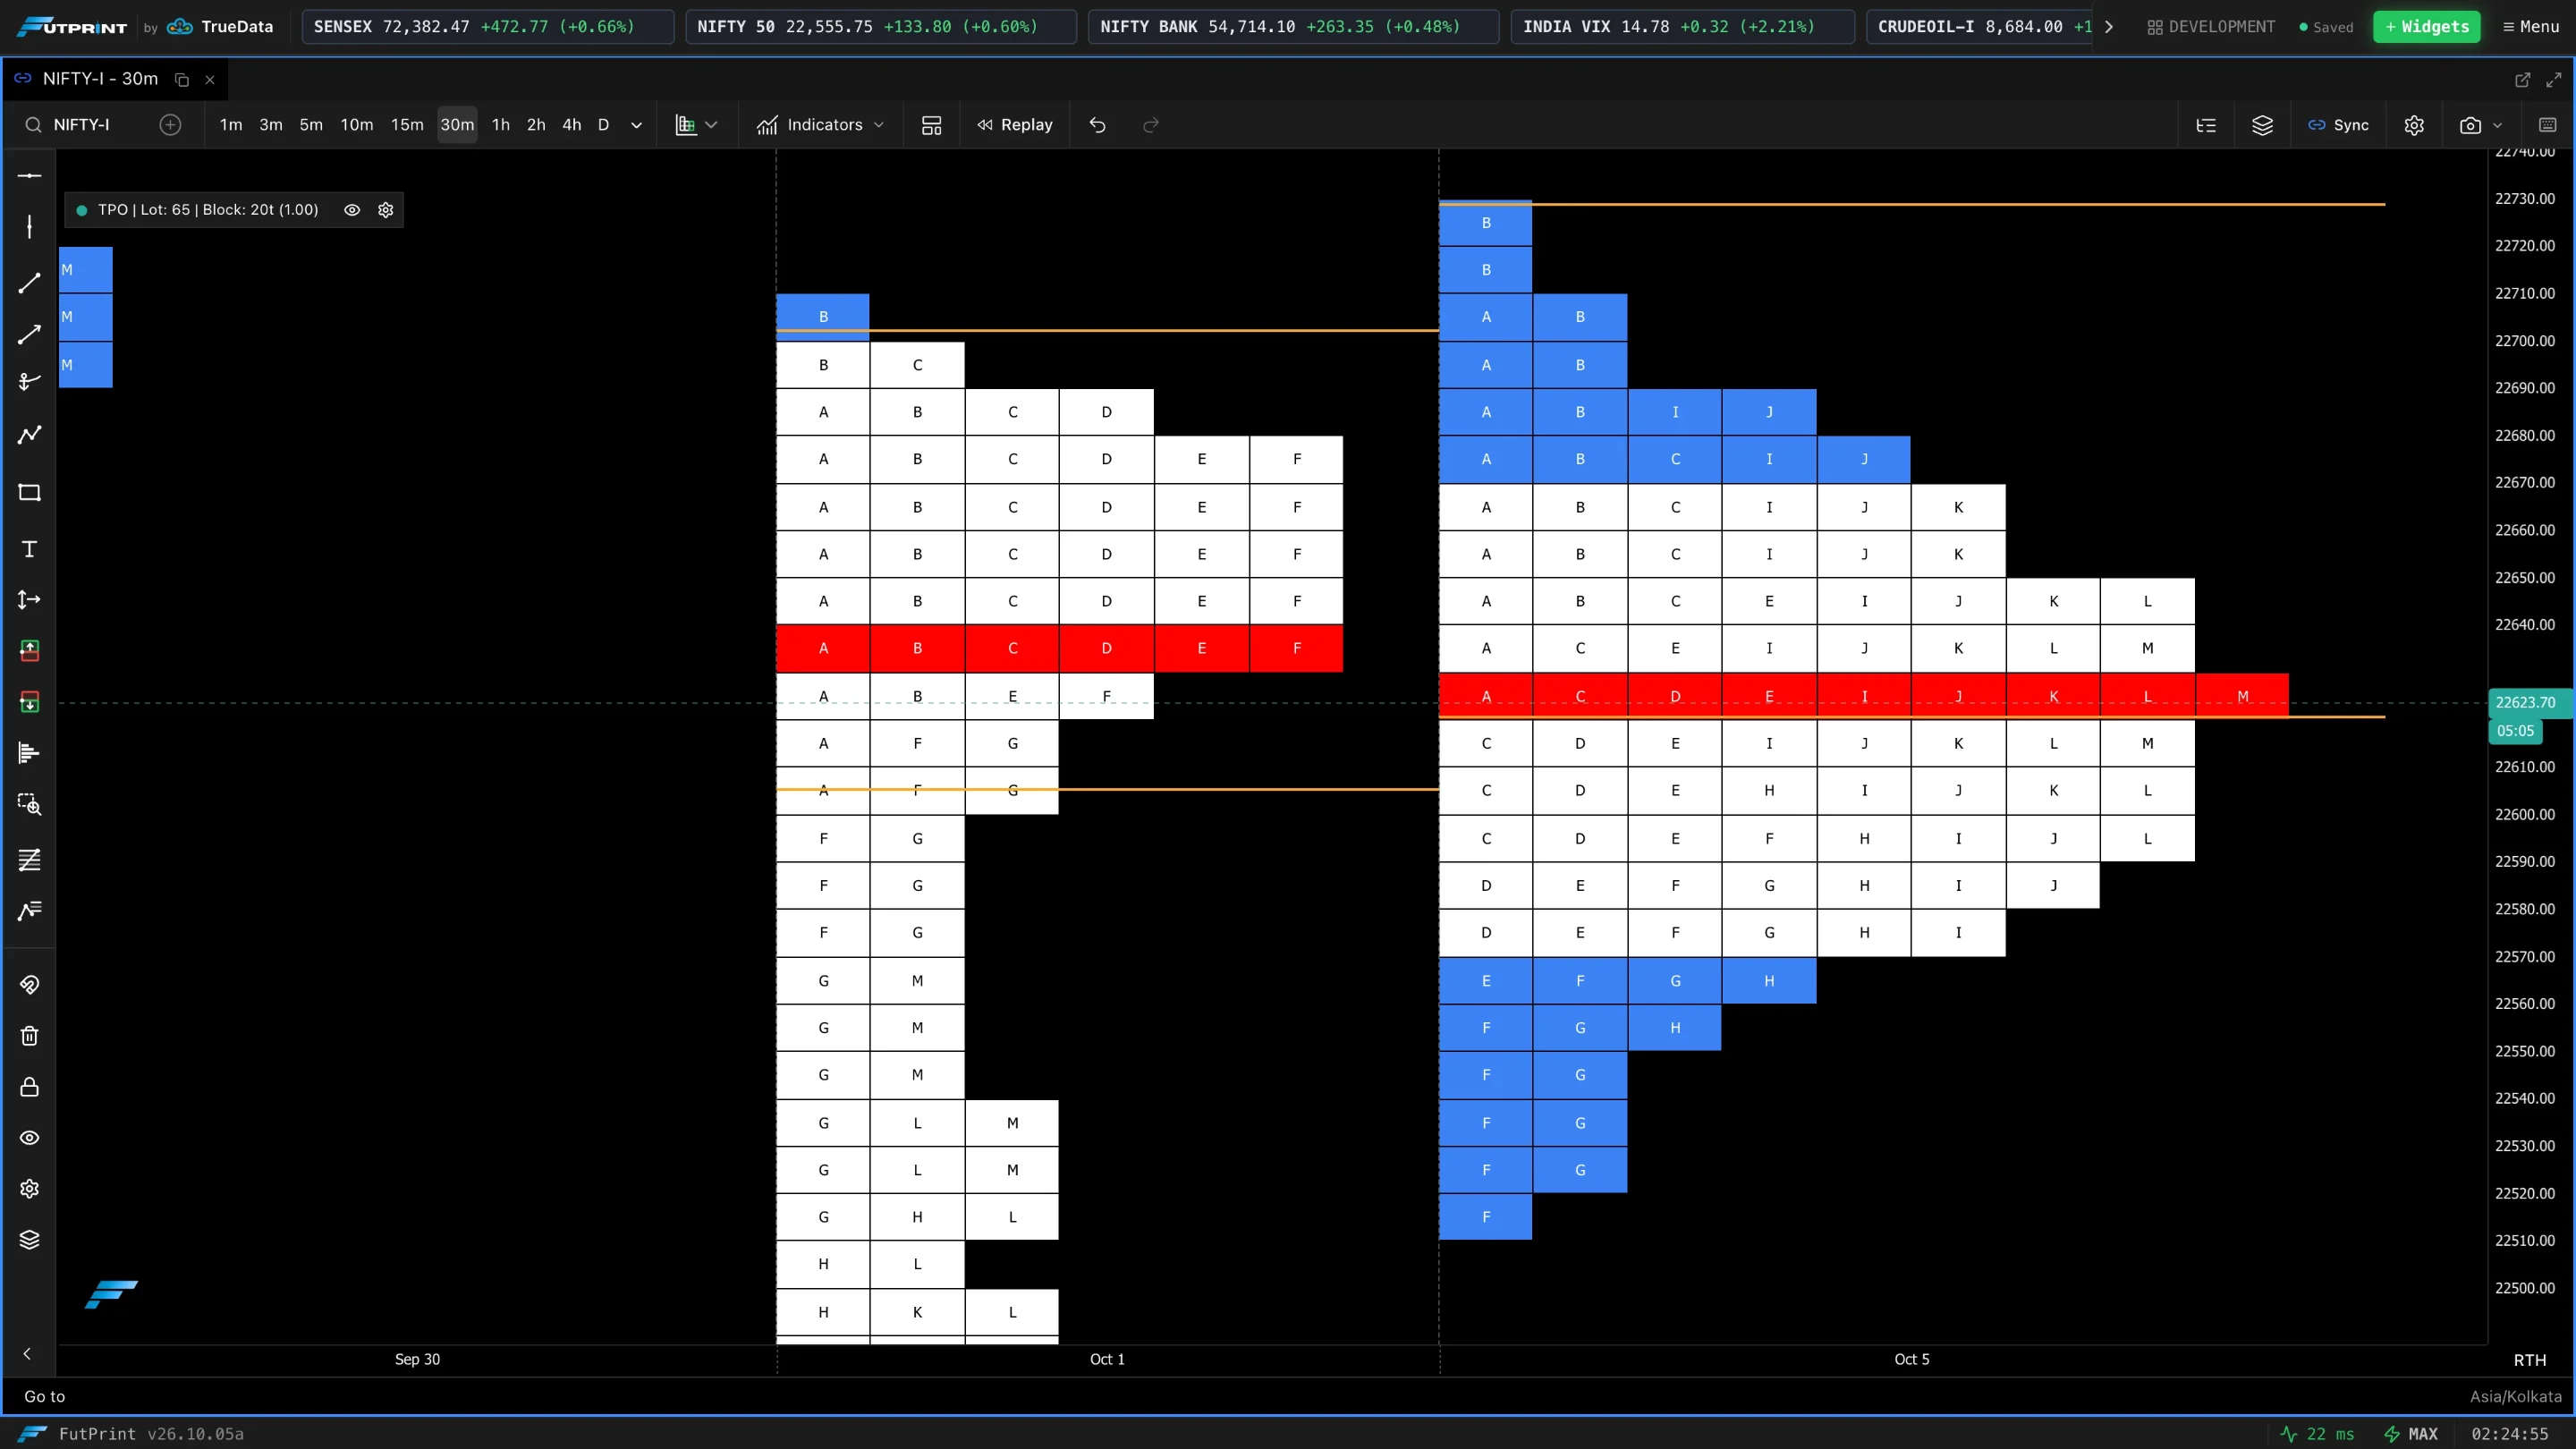
Volume Profile
A volume profile can be drawn alongside each TPO profile, so time at price and volume at price can be compared directly.
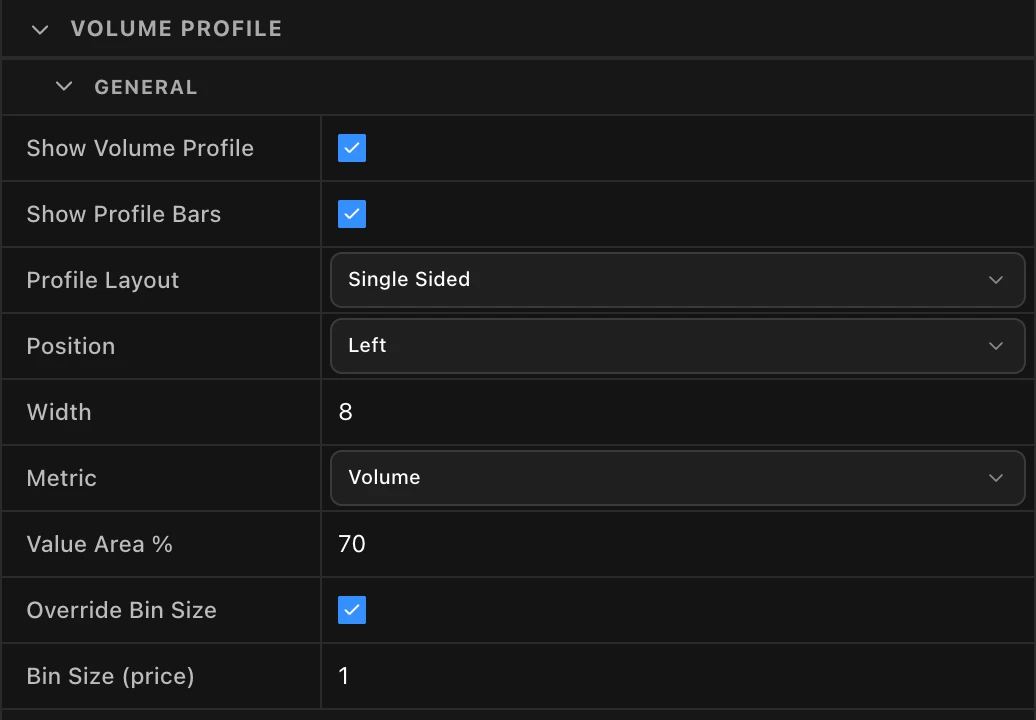
| Setting | What it does |
|---|---|
| Show Volume Profile | Turns the companion profile on. |
| Show Profile Bars | Shows or hides its bars (its lines can still draw). |
| Profile Layout, Position, Width | Single or two sided, left or right of the TPO, and how wide. |
| Metric | Volume, Delta or Bid × Ask. |
| Value Area % | Value area of the volume profile, independent of the TPO's. |
| Override Bin Size, Bin Size (price) | Give the volume profile its own, finer bin size. |
The remaining groups — Appearance, Color Palette, POC Line, Value Area Lines, LVN Lines, HVN Lines, Developing Profile, Auction, Labels, Composite Profile, Composite Lines and Highlight Conditions — work as described in the Volume Profile guide.
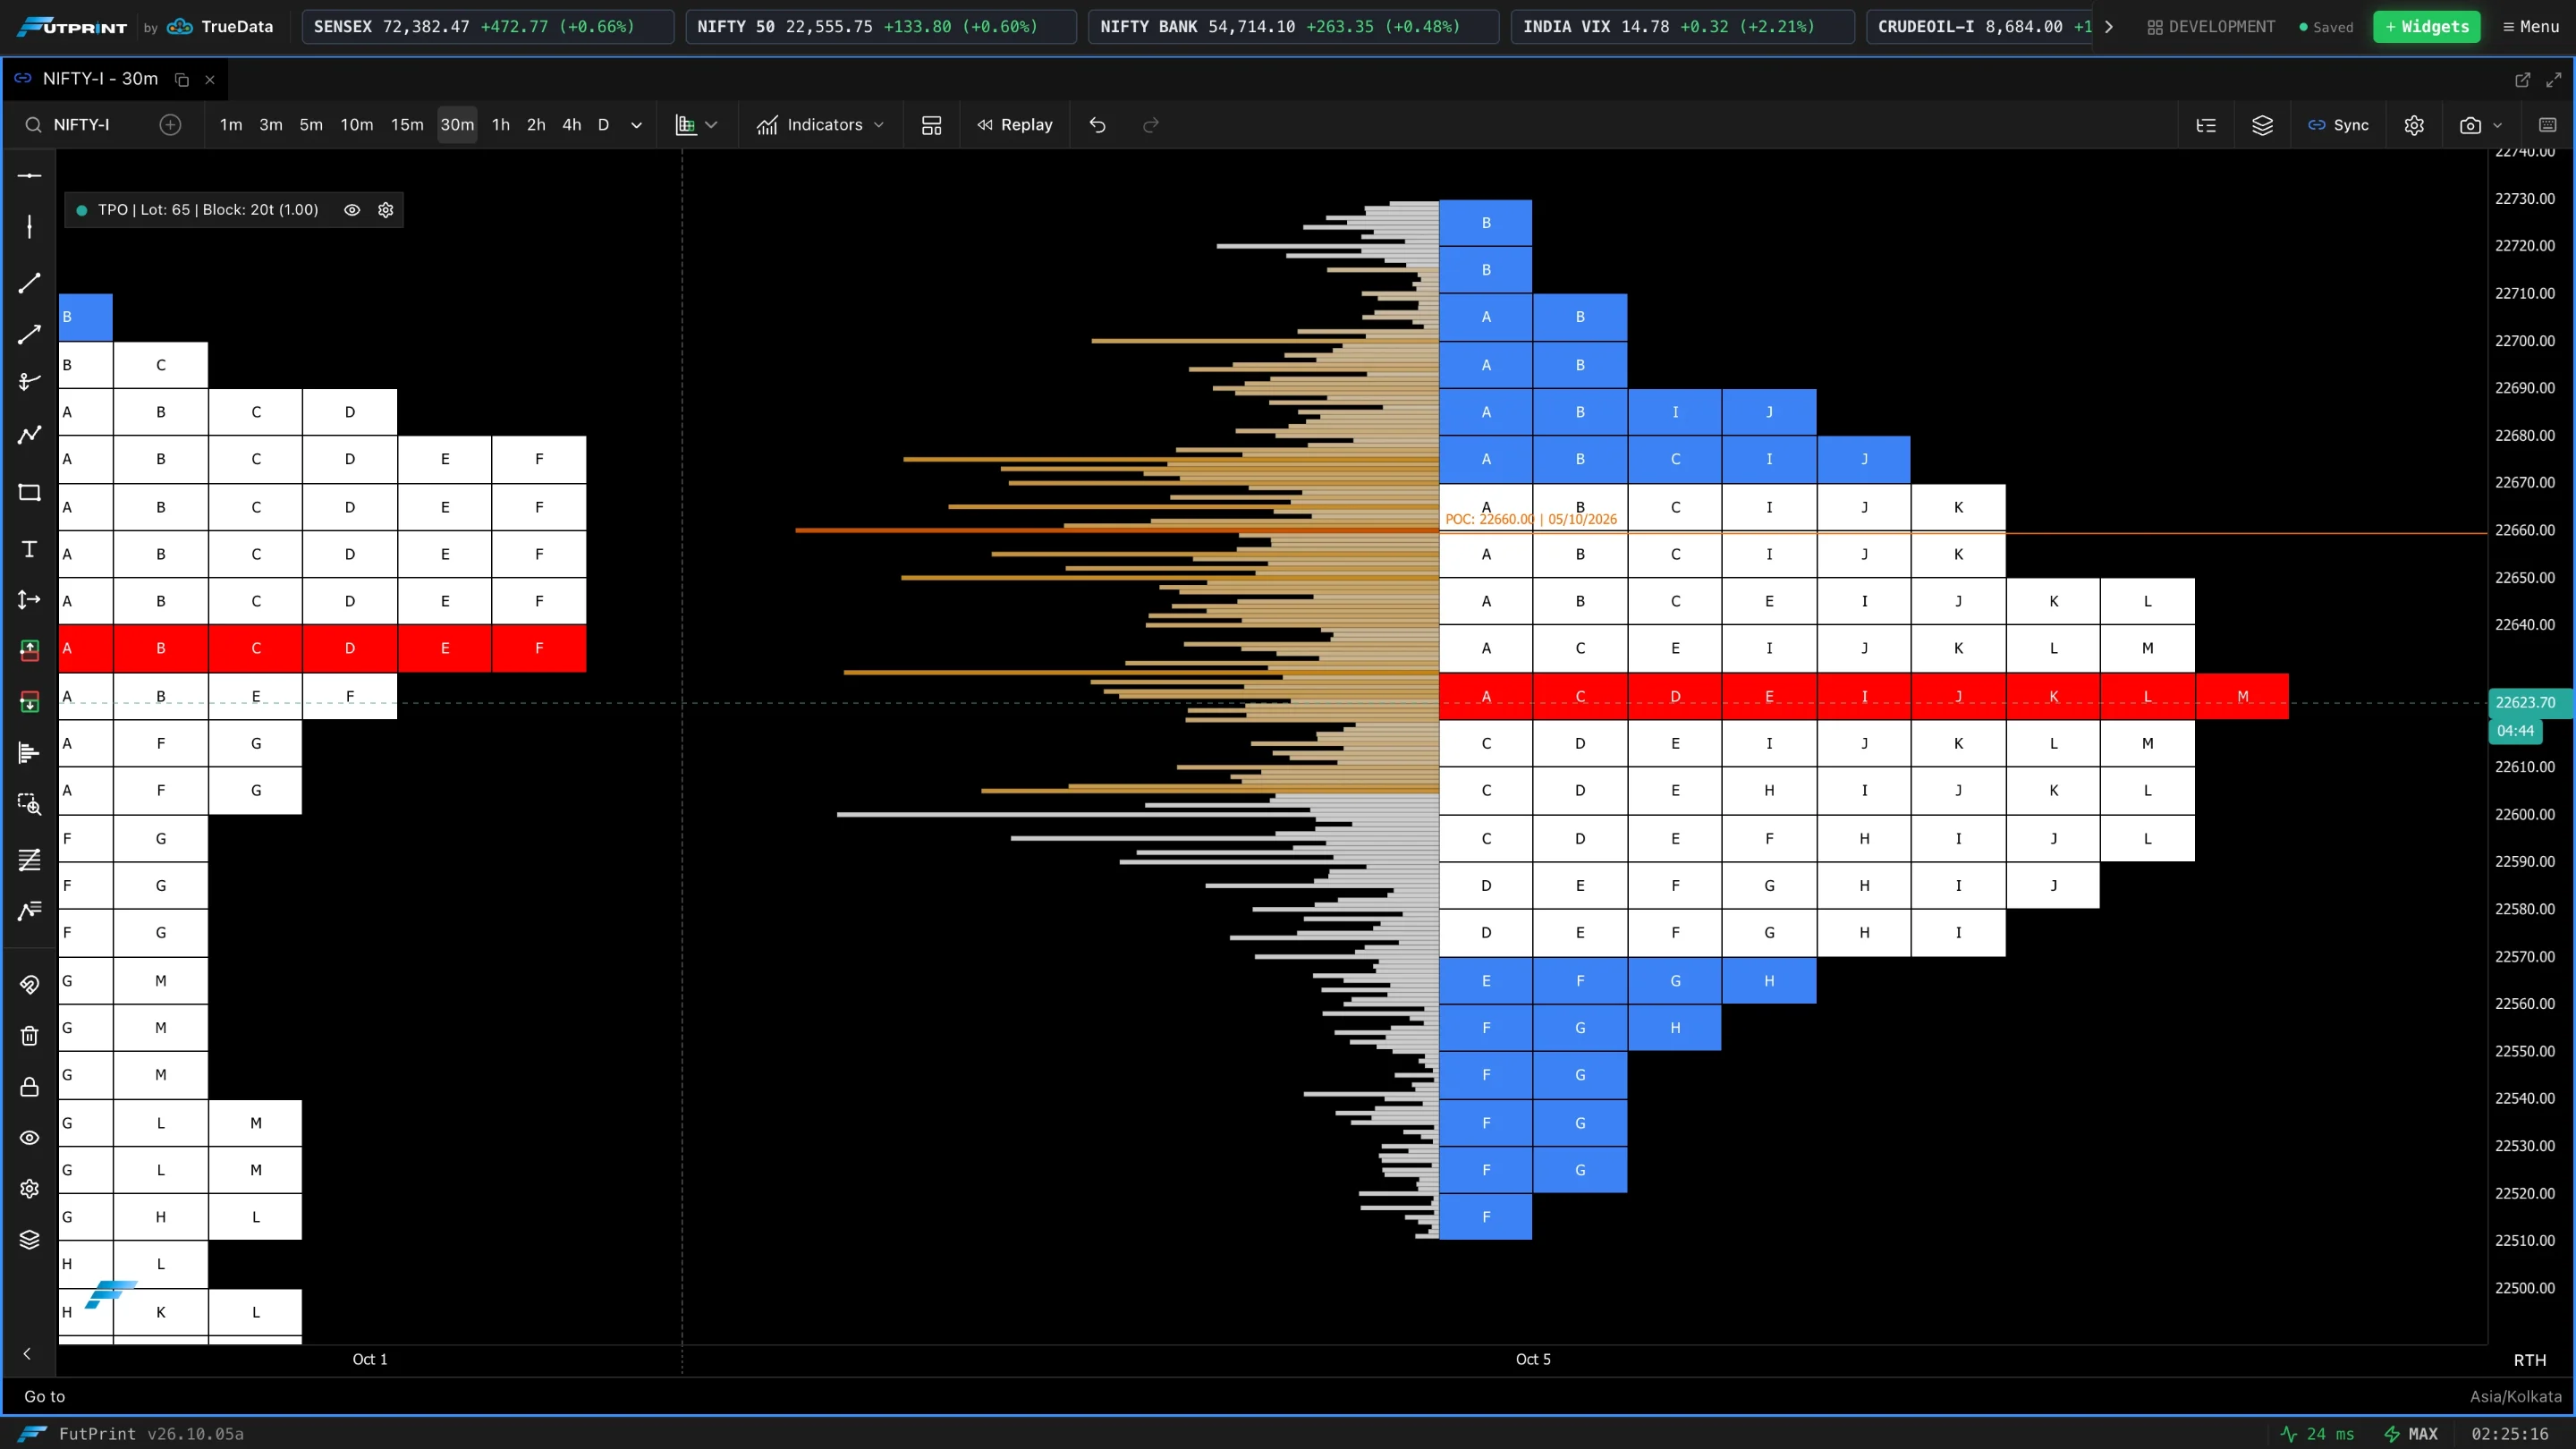
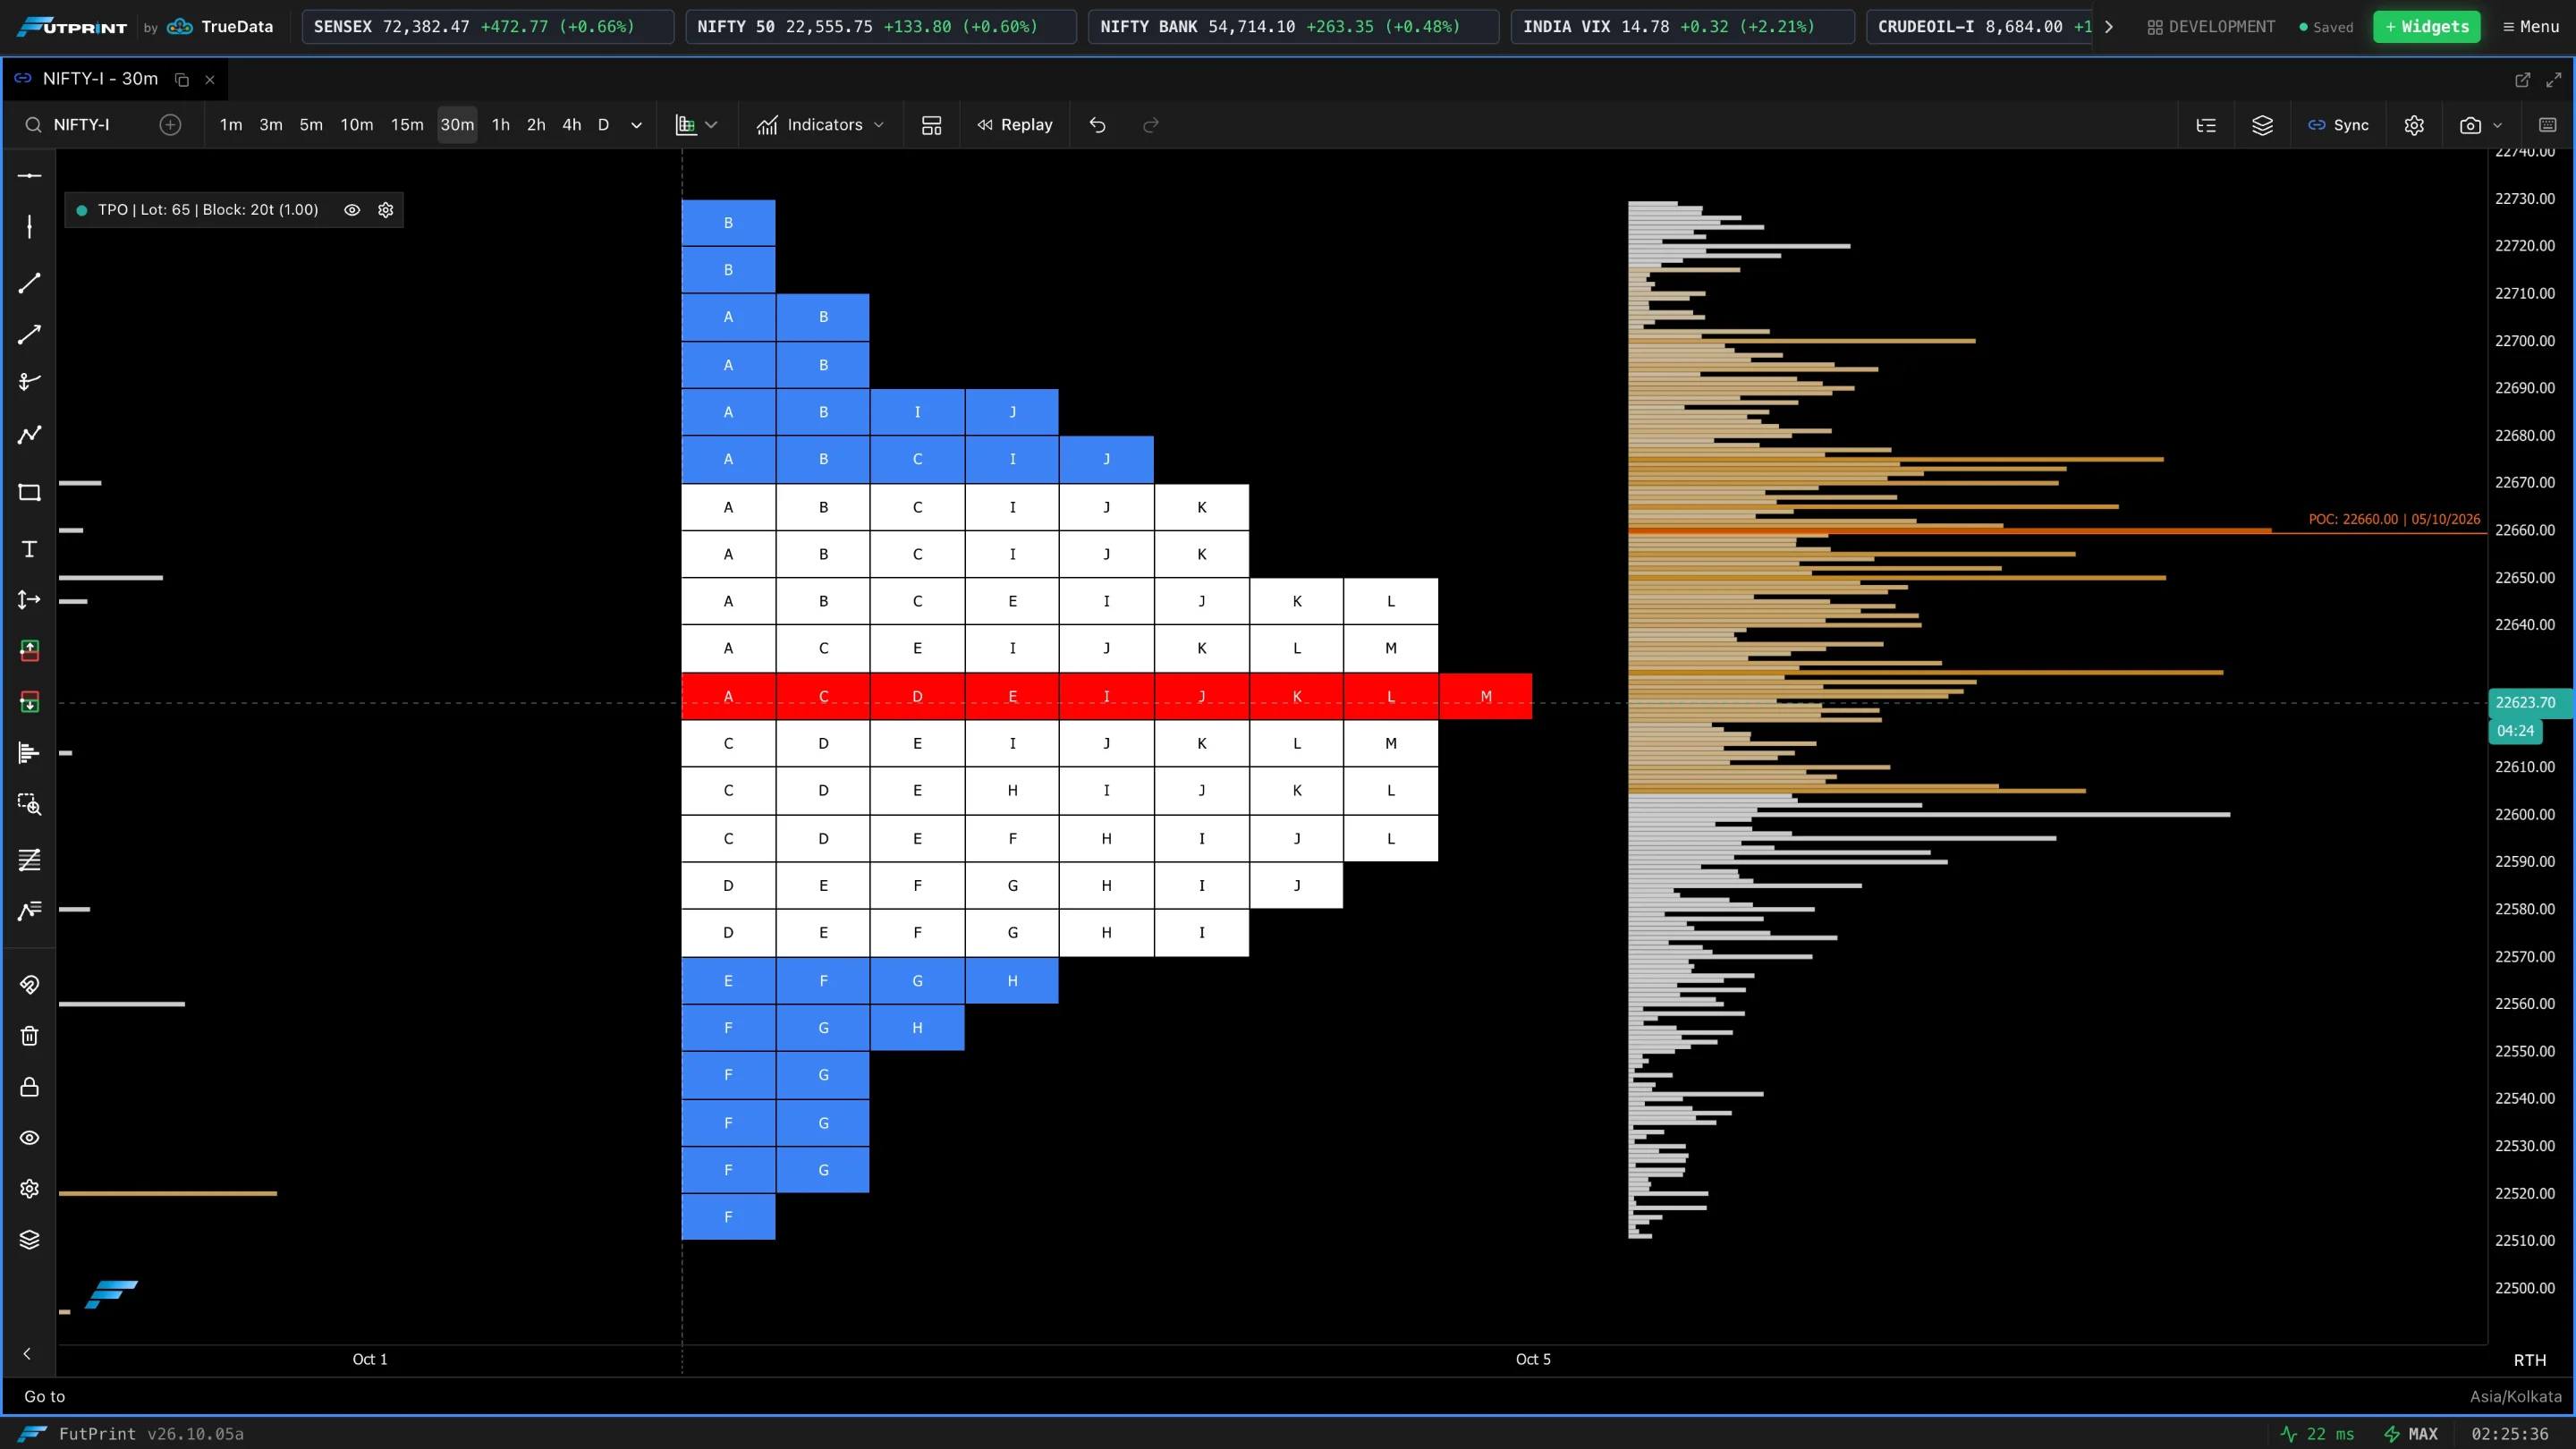
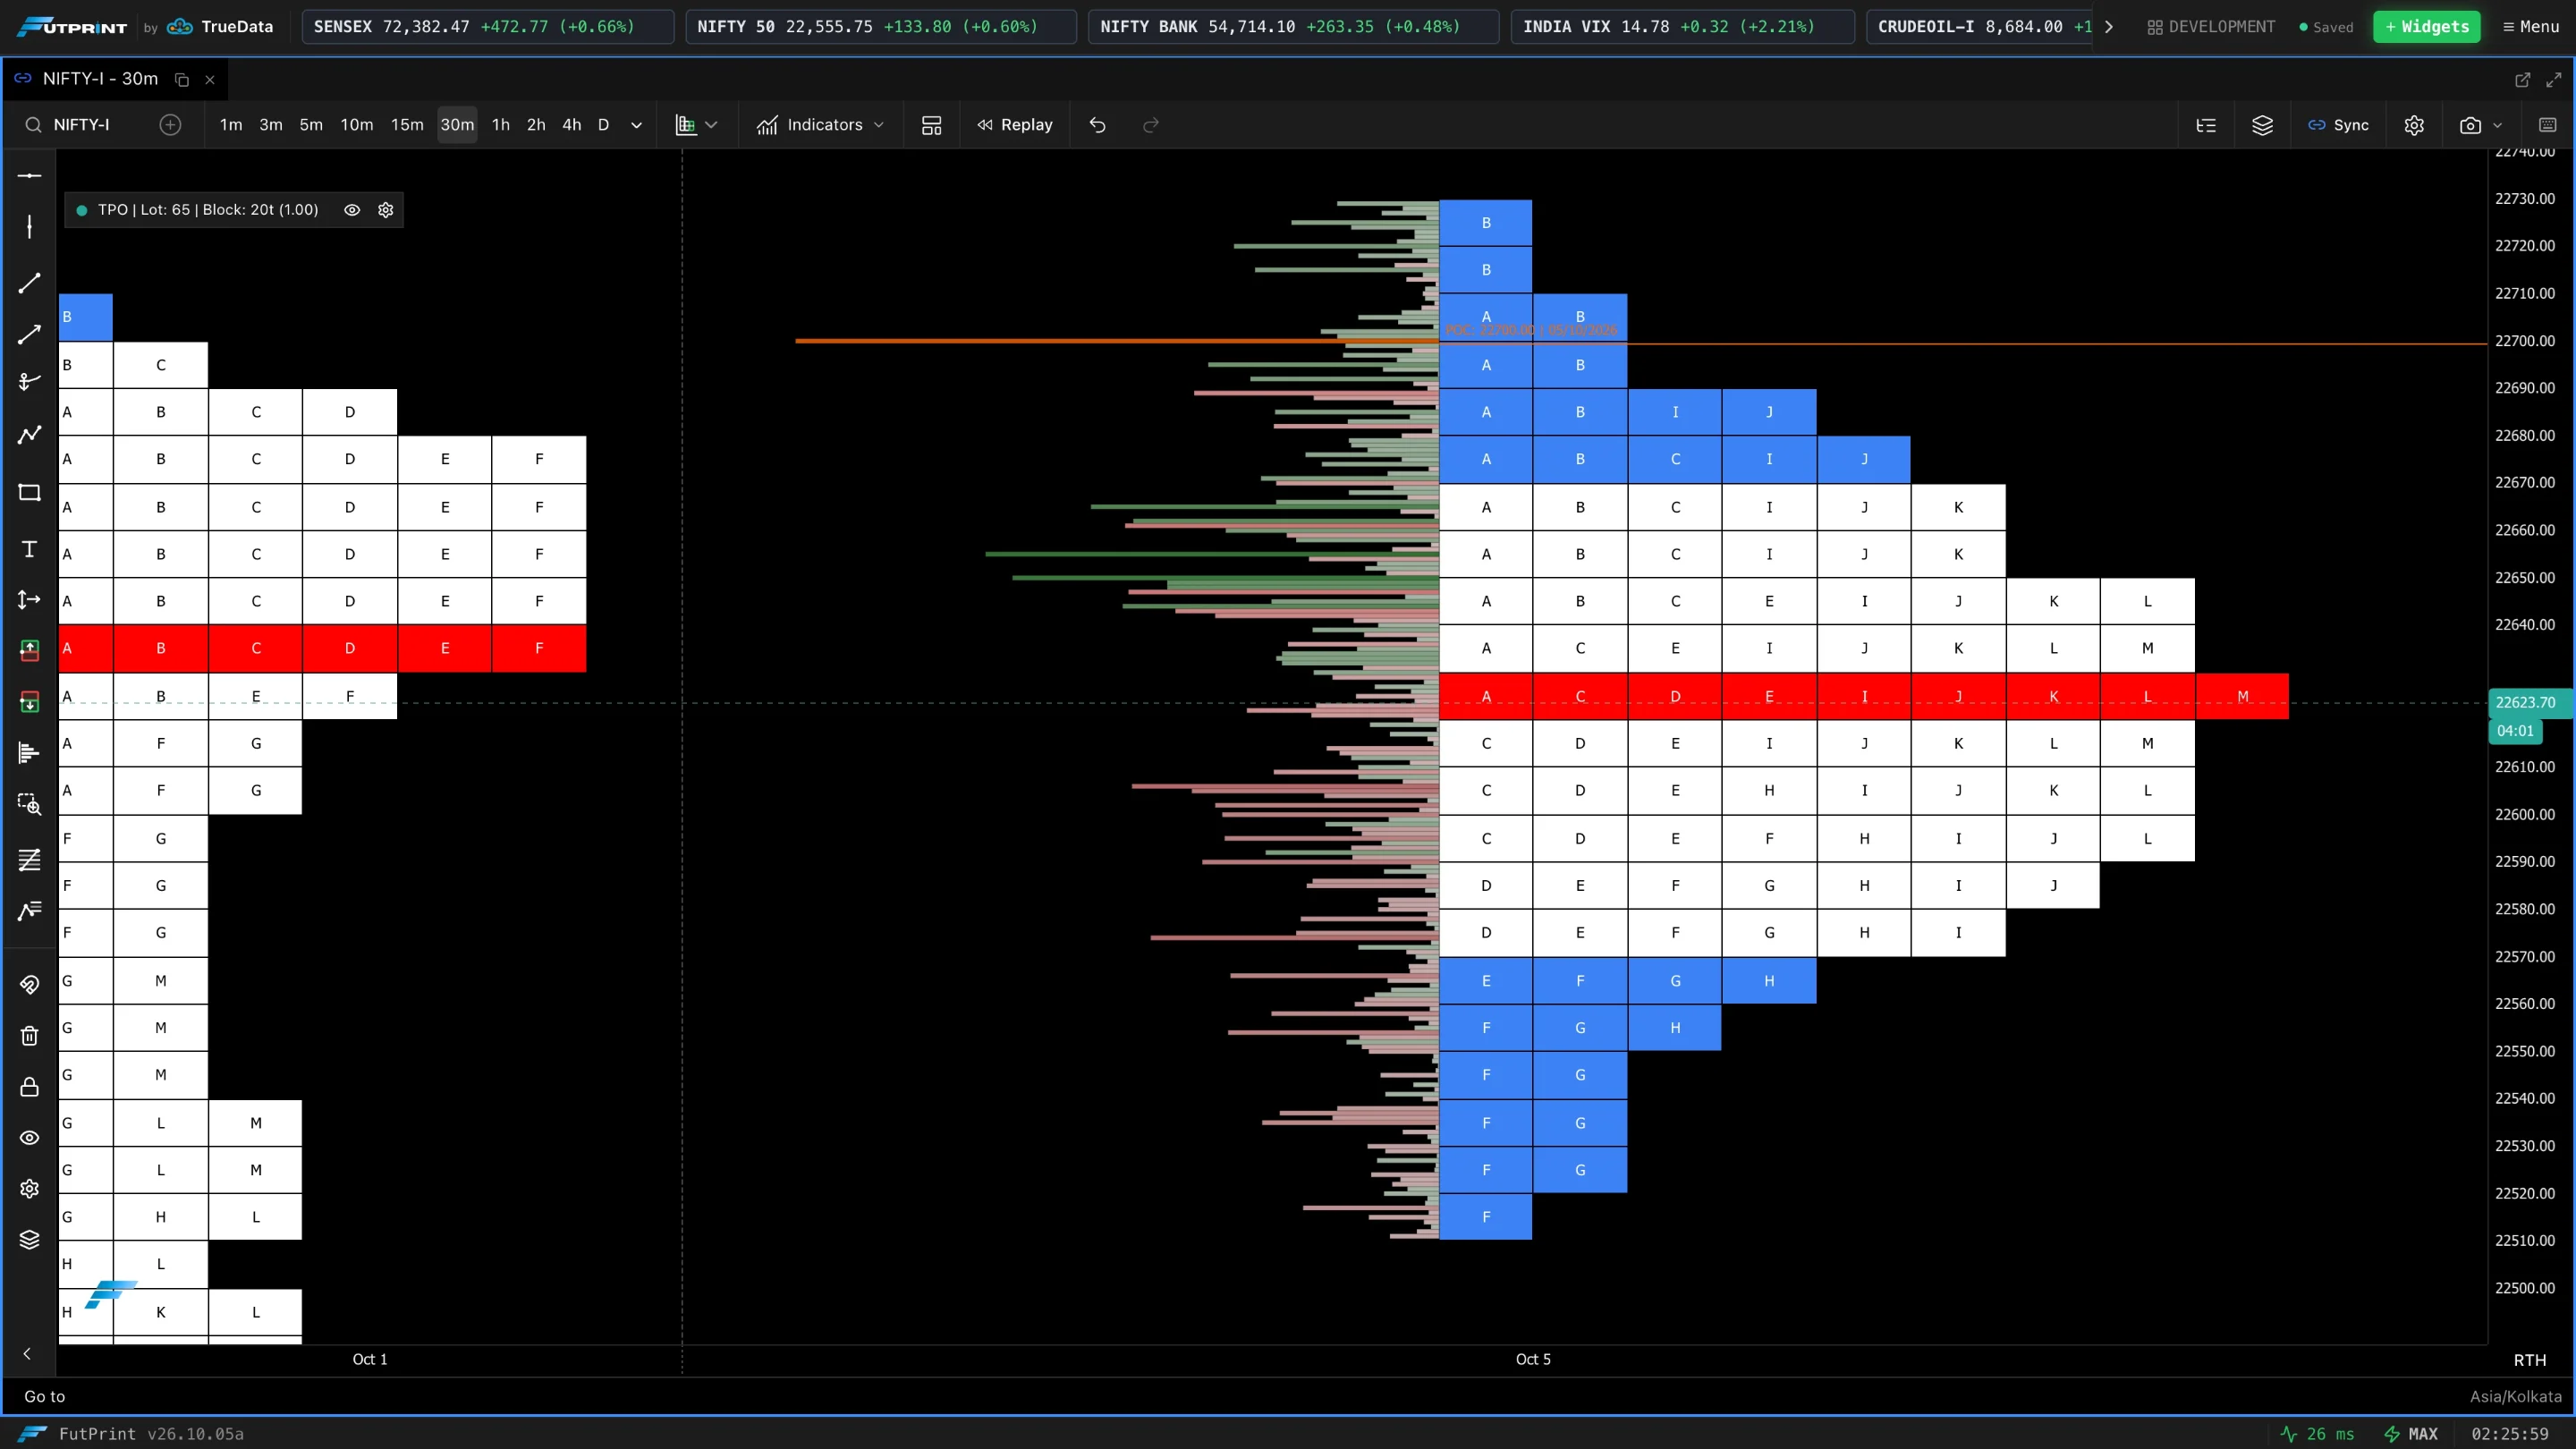
For day-trading, anchor by Day or Session, keep Value Area % at 70, and turn on POC, Value Area, Single Prints and Initial Balance — the classic market-profile read of where value is and where price moved too fast.