Chart — Replay Mode
Replay lets you step through historical price bar by bar, as if the market were unfolding live. It's ideal for studying how a setup developed and for practising your reading and timing without risk.
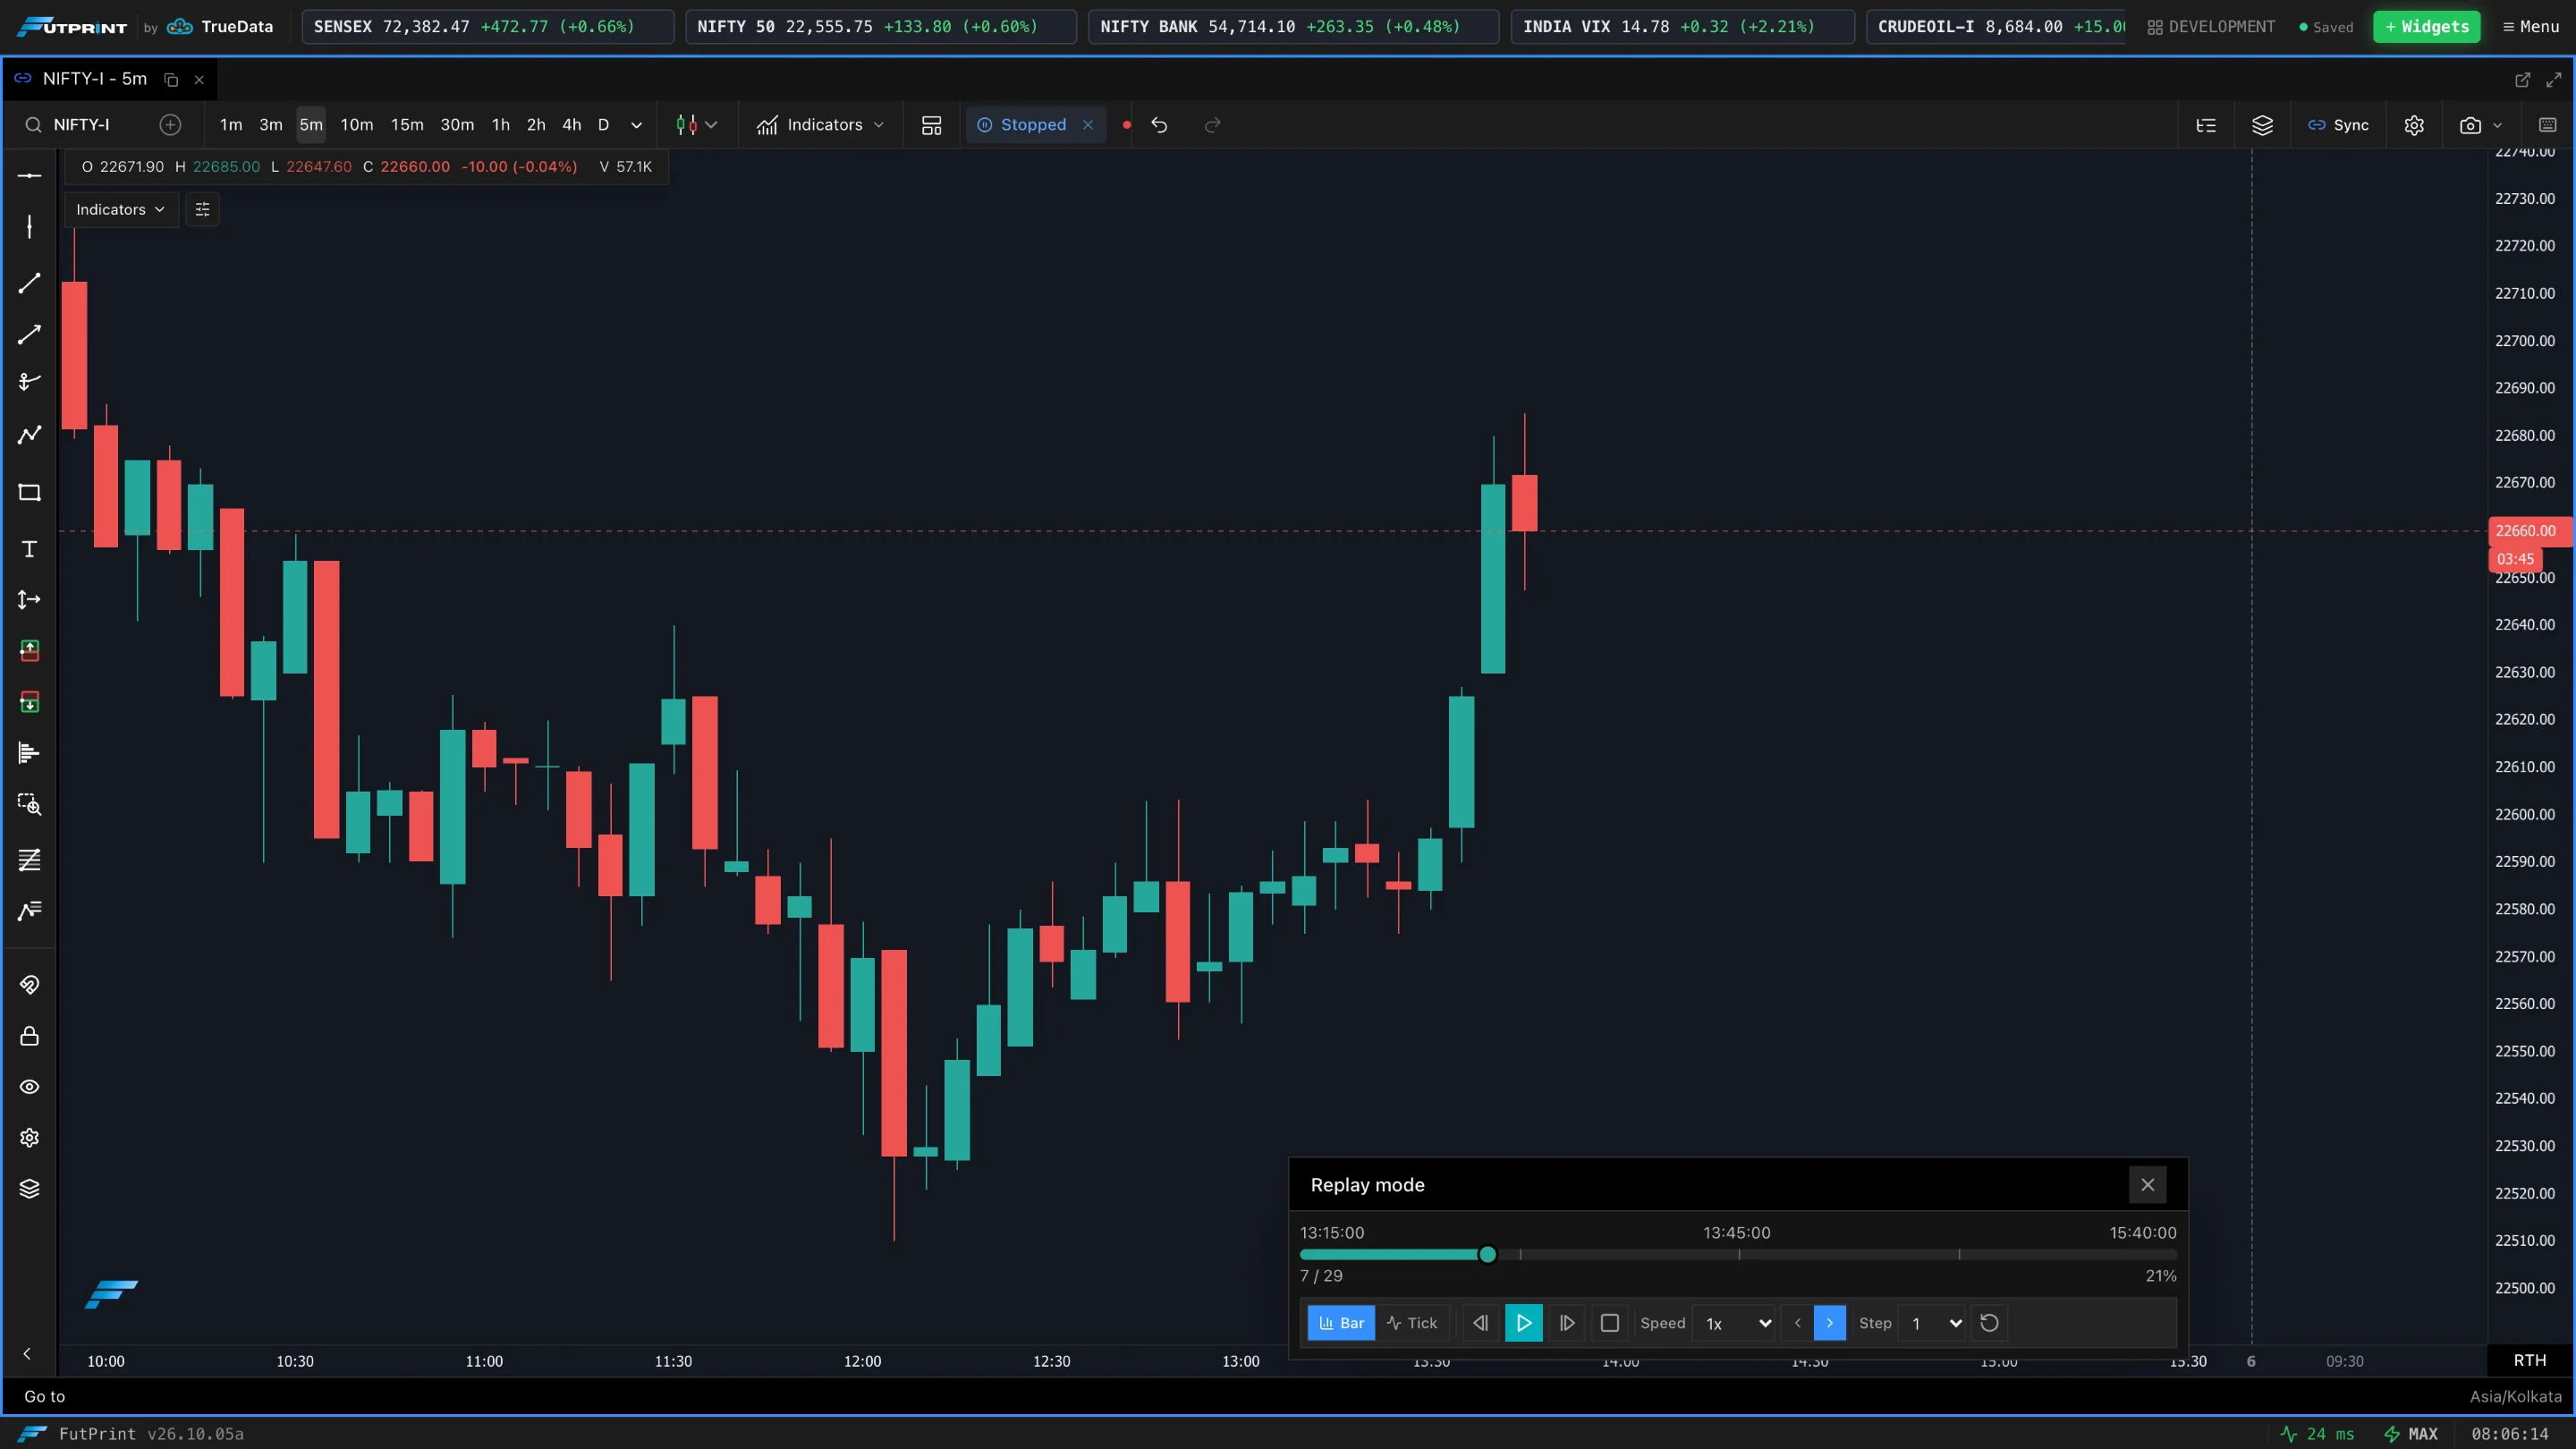
Starting a replay
- 1Enter replay mode
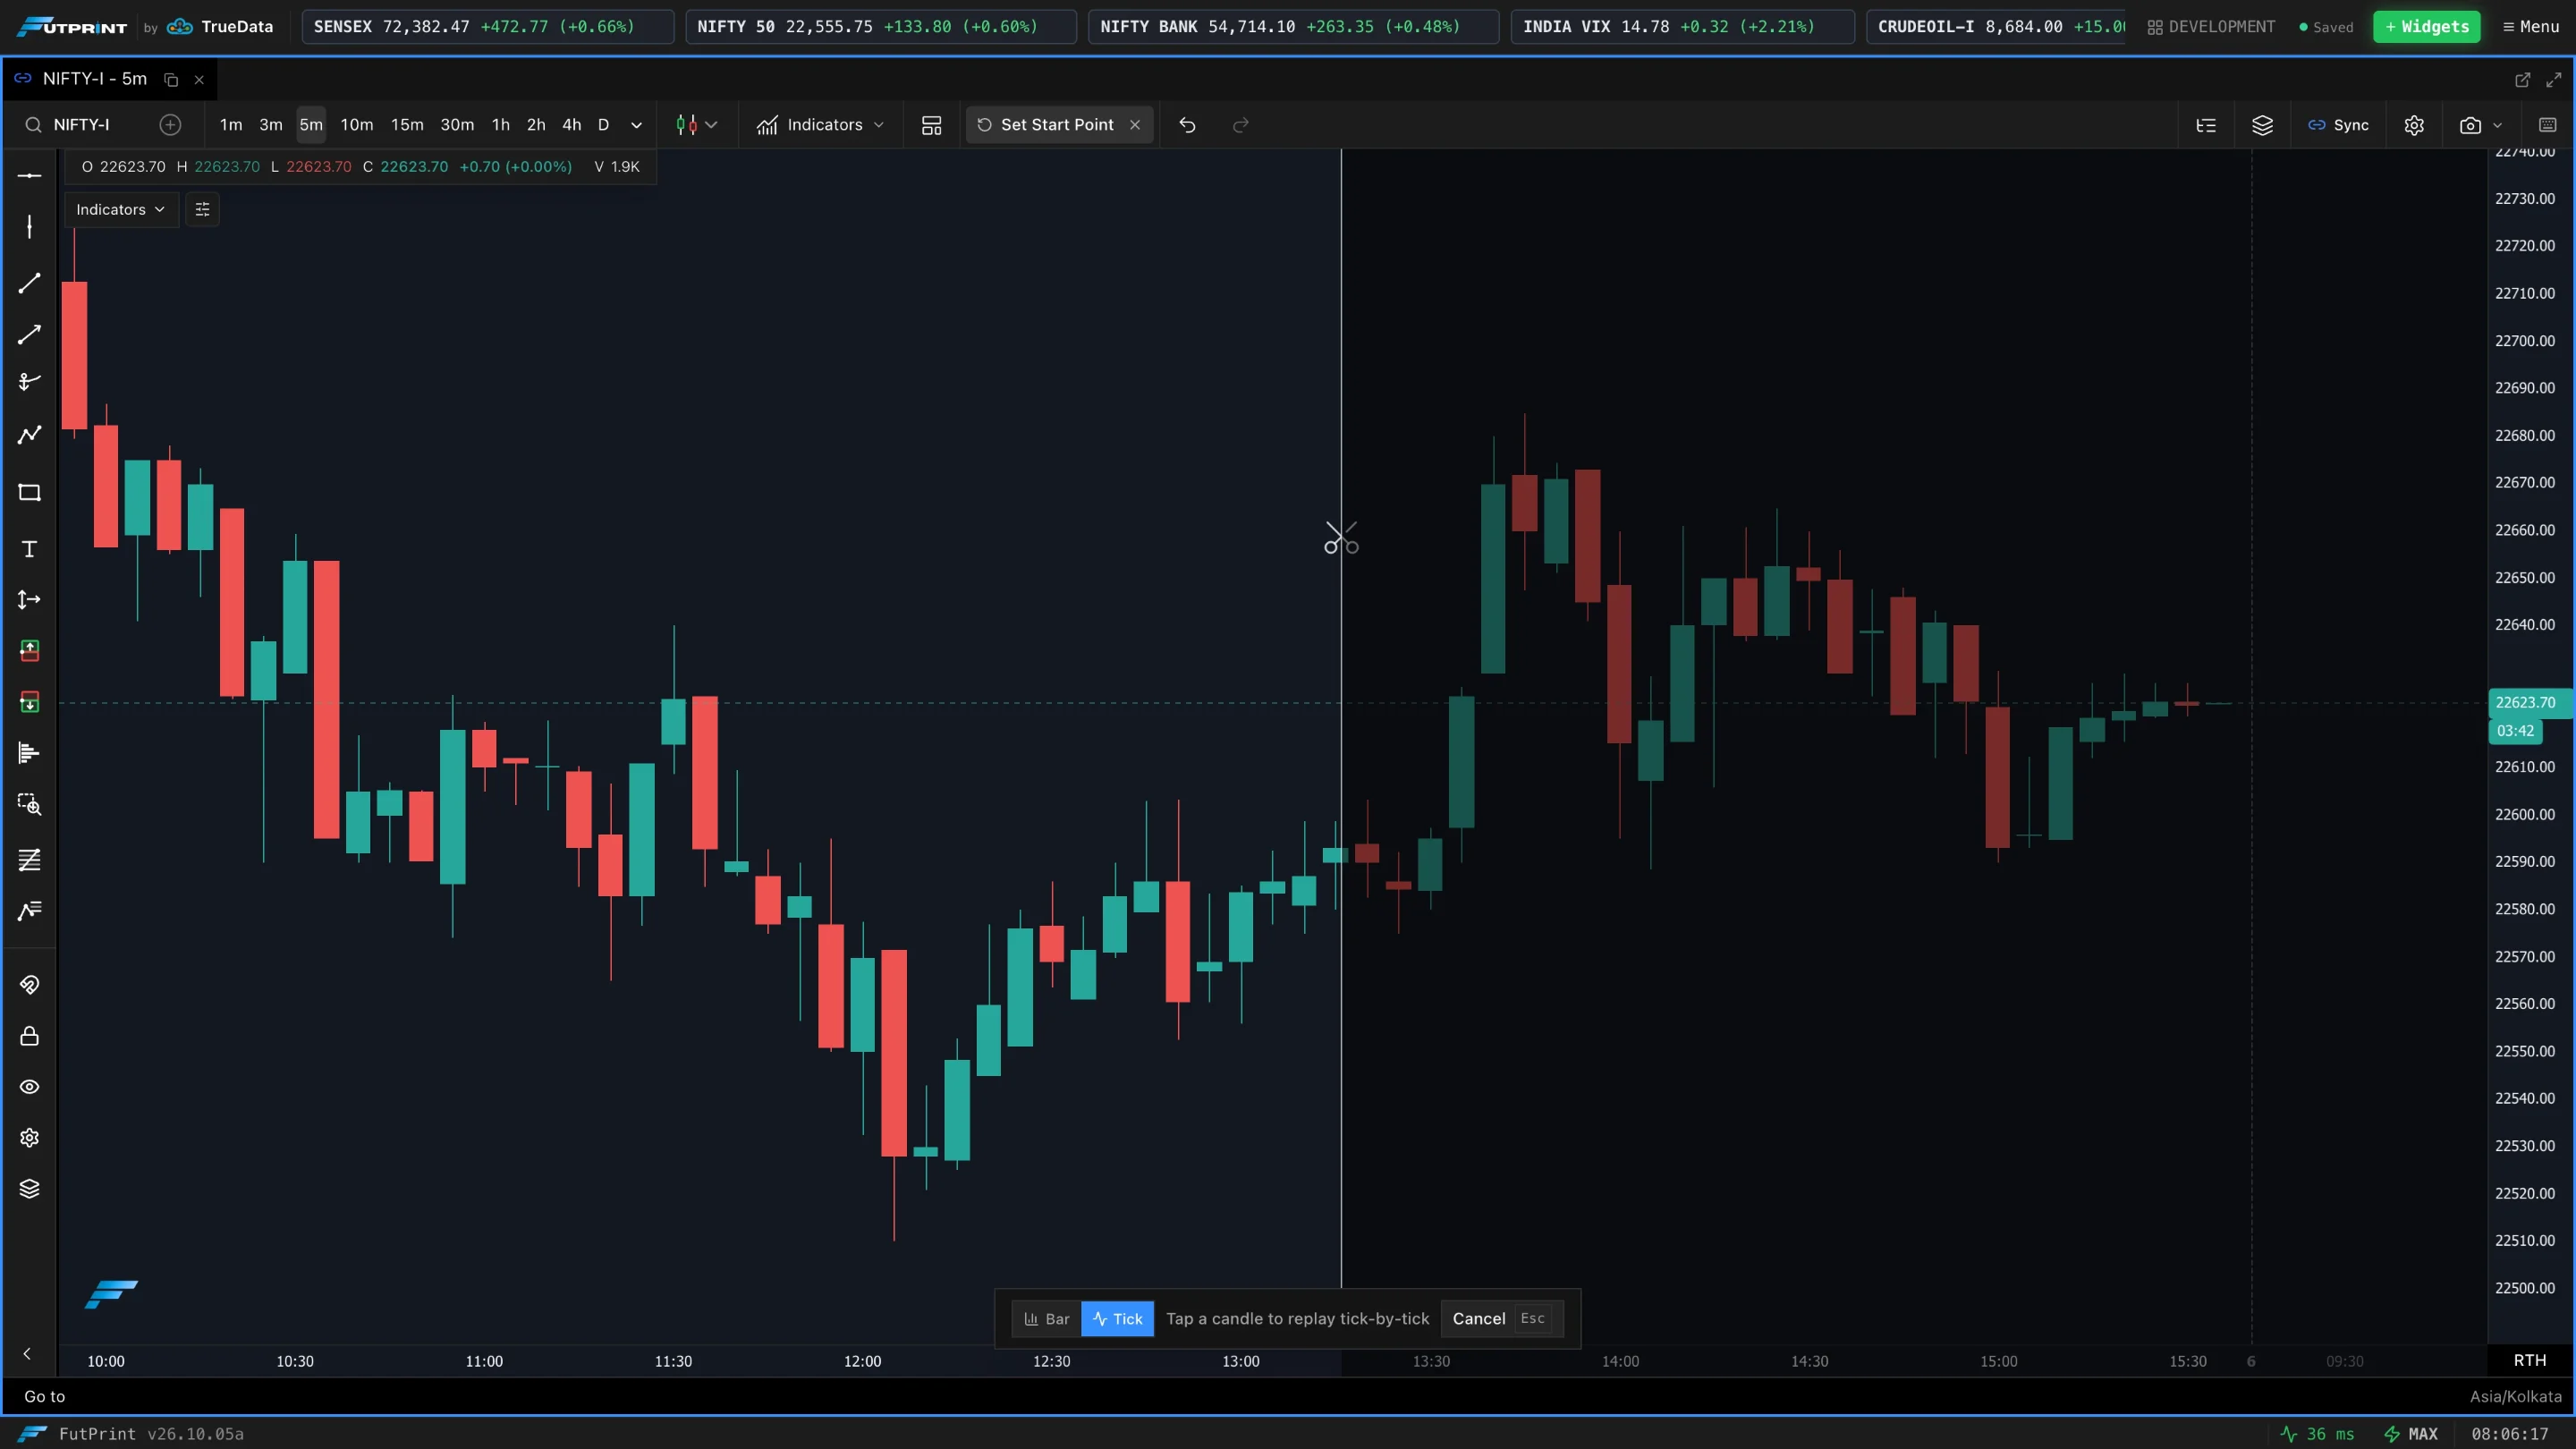
Click Replay in the chart toolbar. The chart dims and prompts you to choose where the replay should begin.
- 2Pick the starting candle
Move the pointer to the candle you want to start from — everything to its right is shaded — and click. Press Cancel (or Esc) to back out.
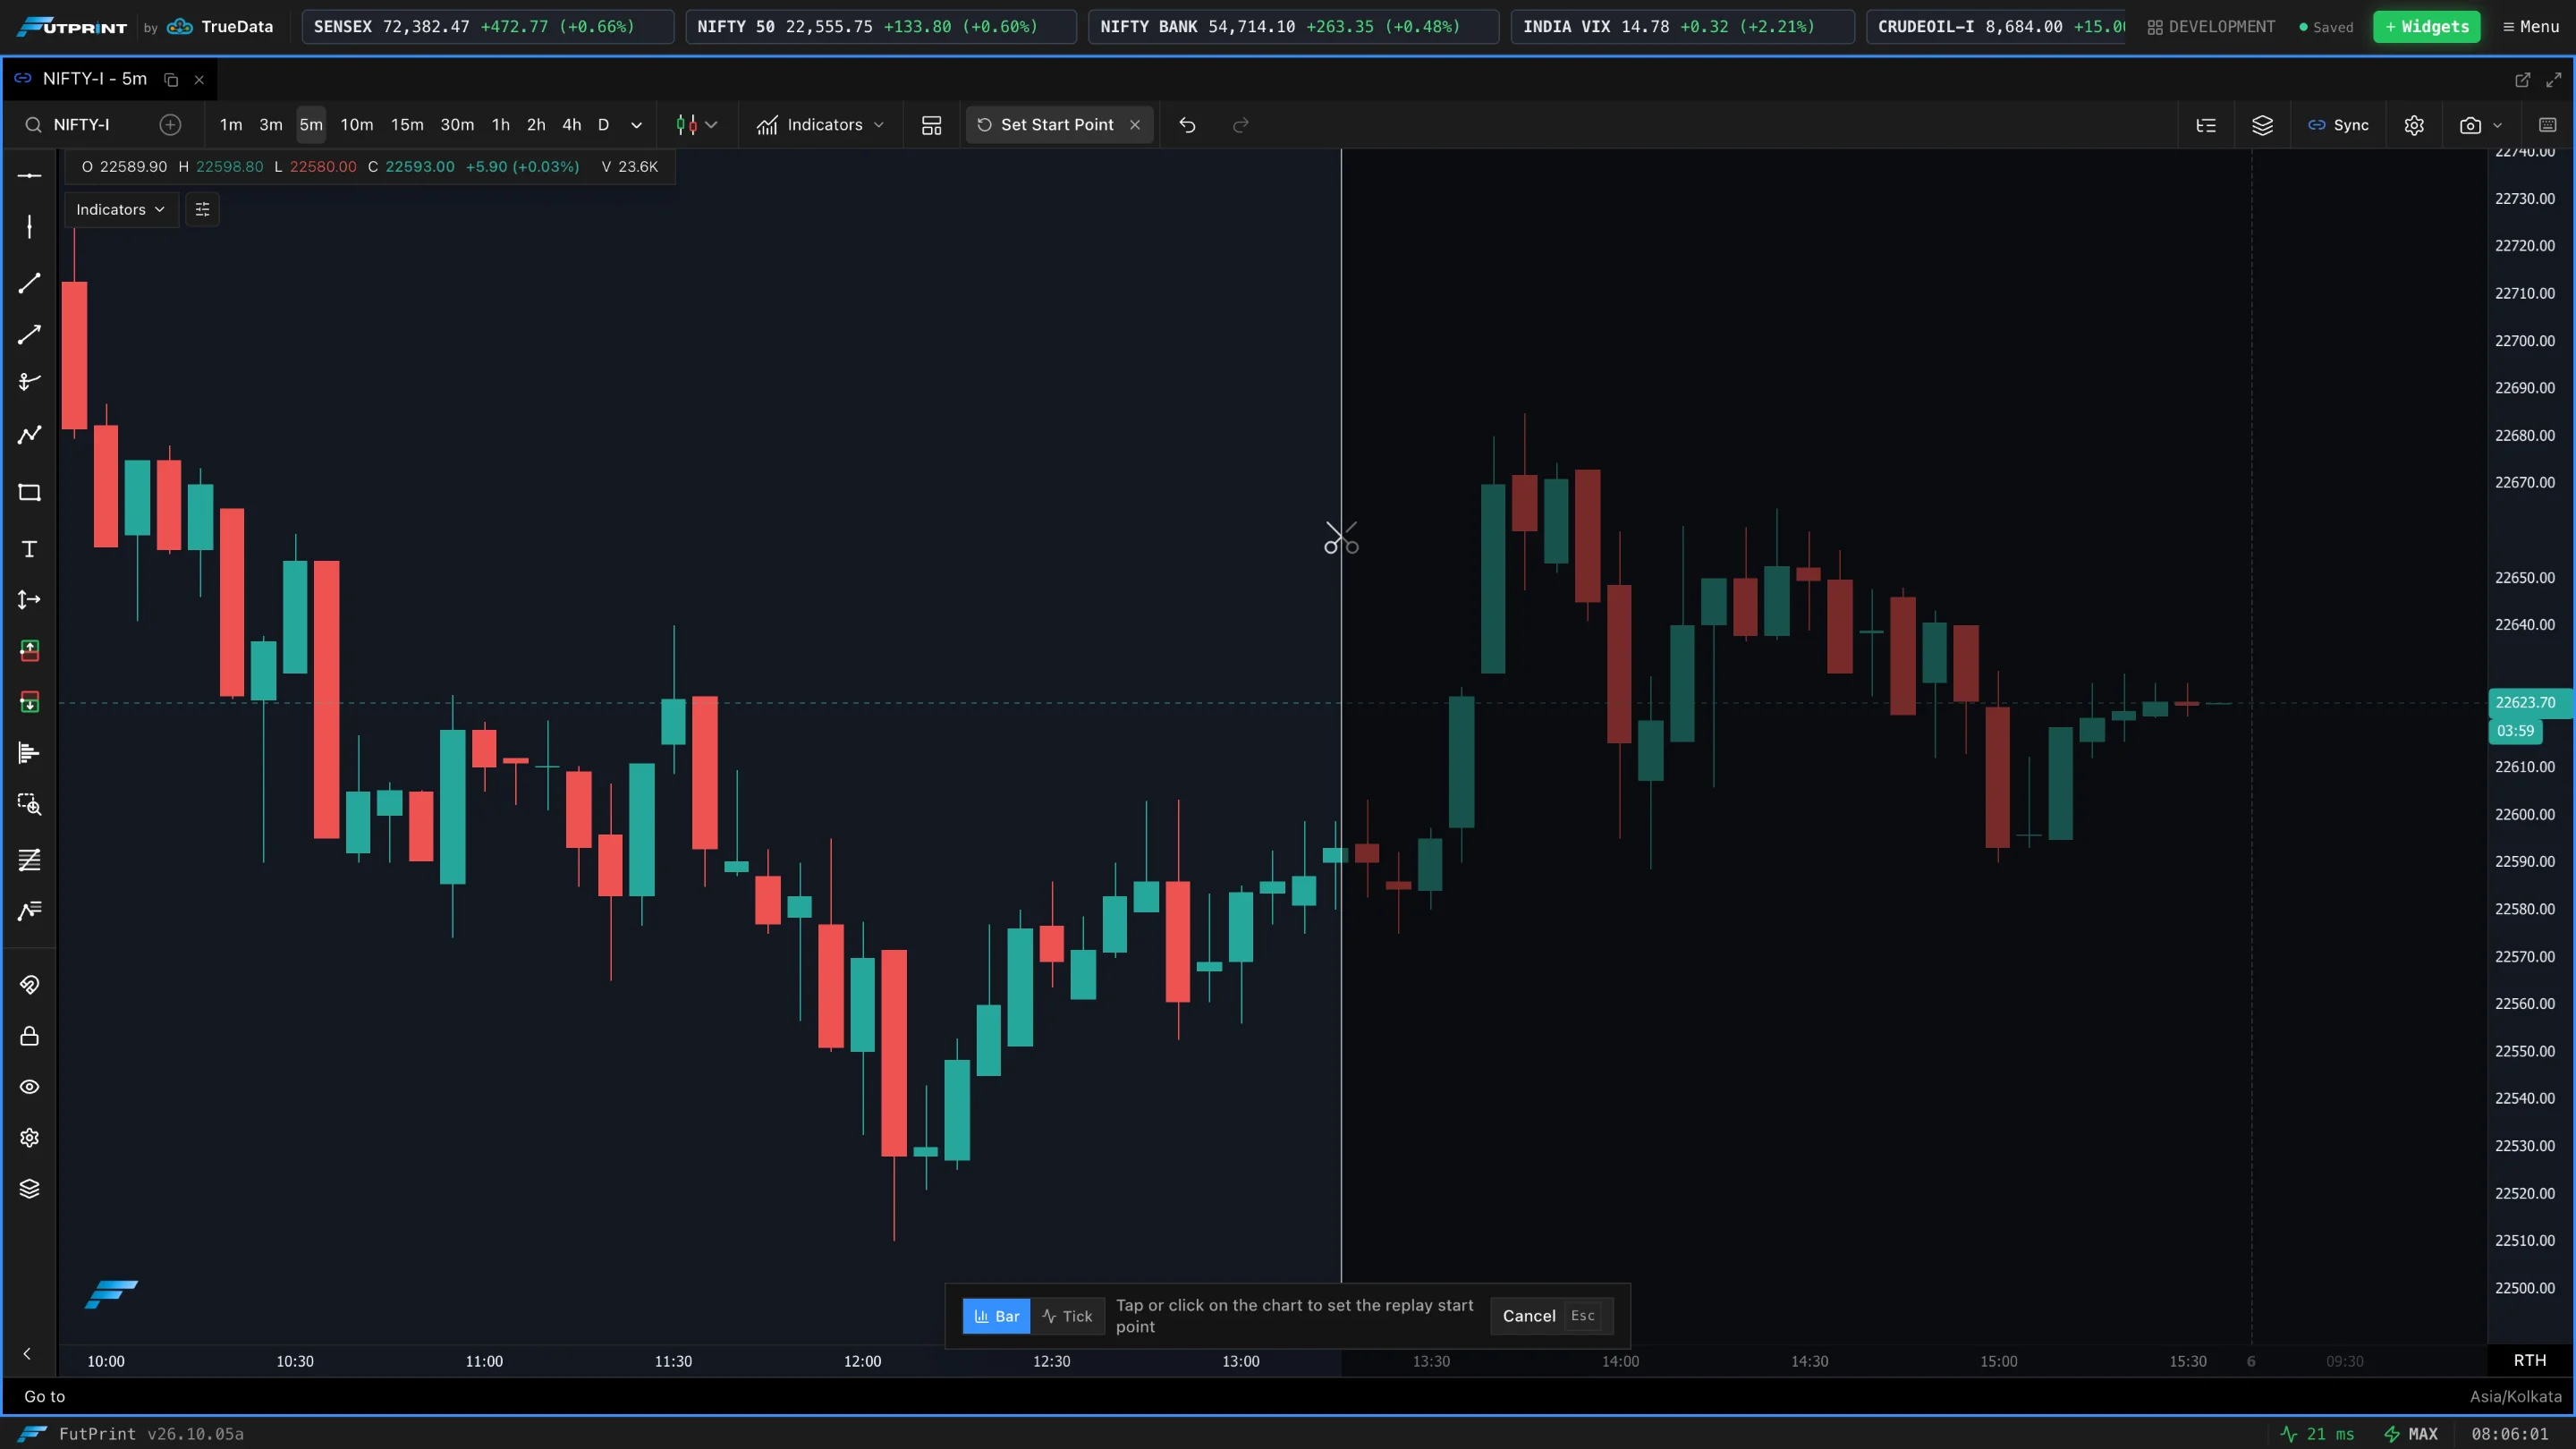
The chart then hides everything after that candle and the Replay mode panel appears.
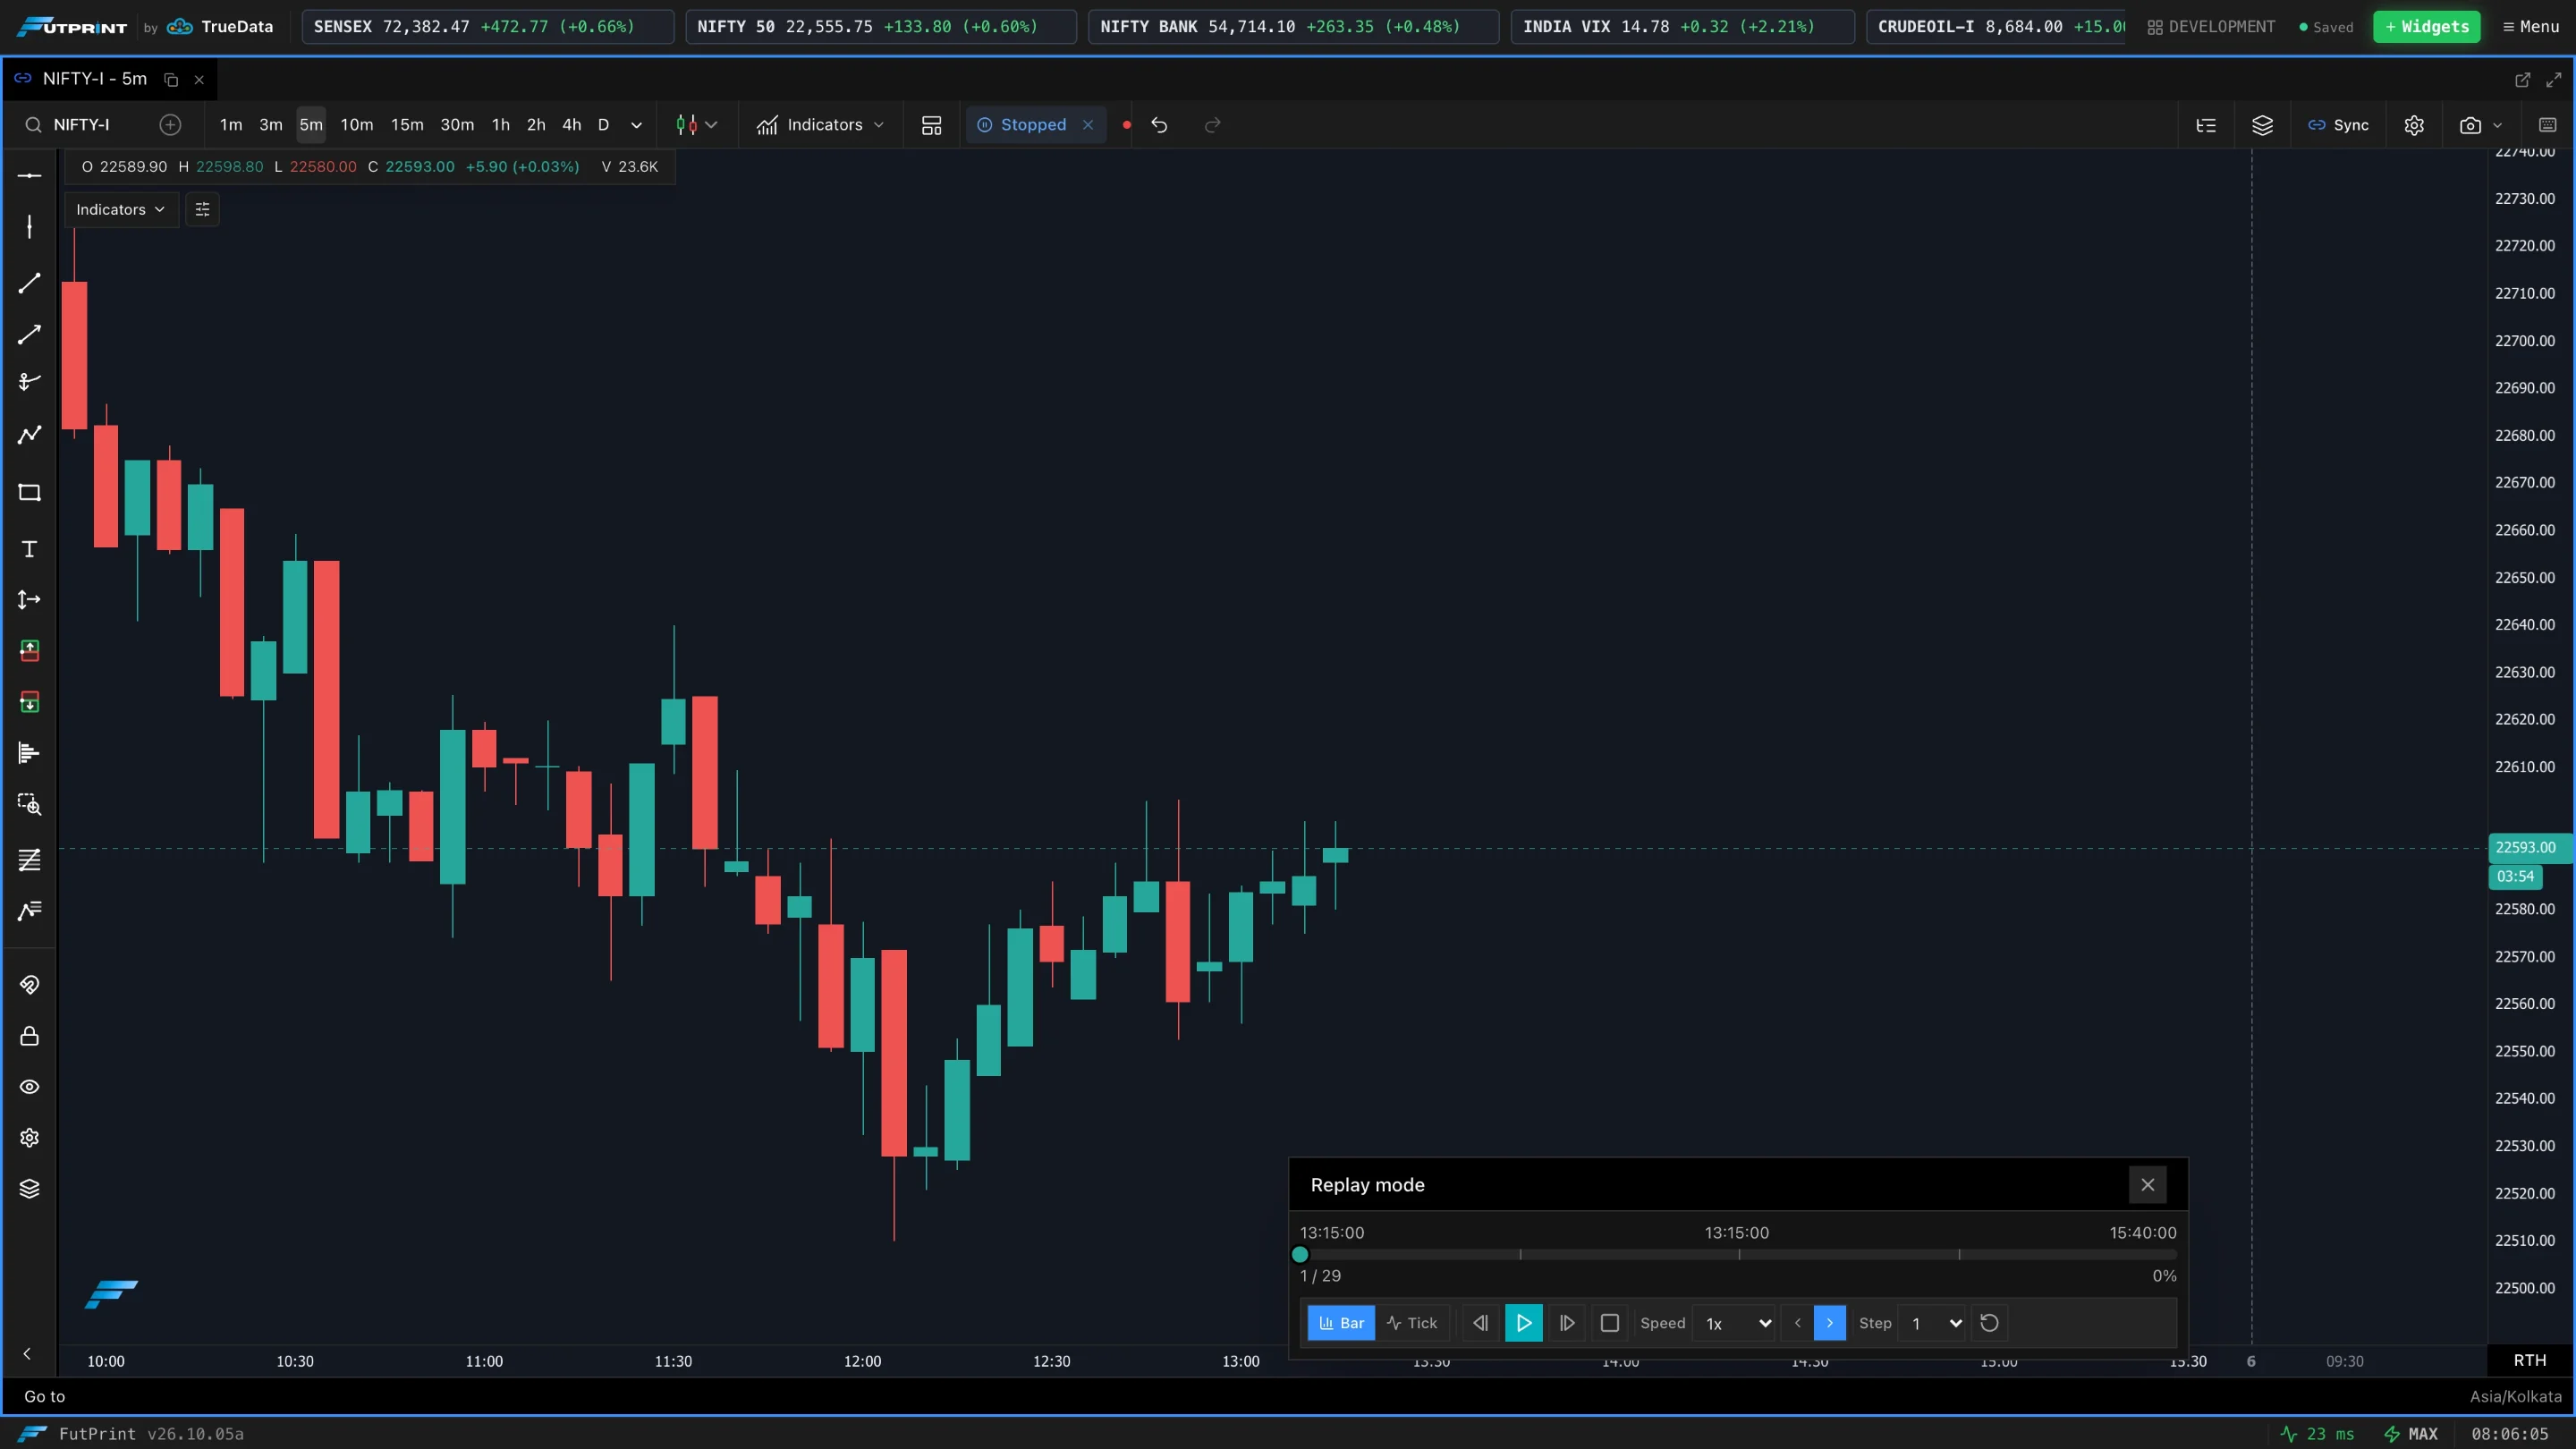
The Replay mode panel
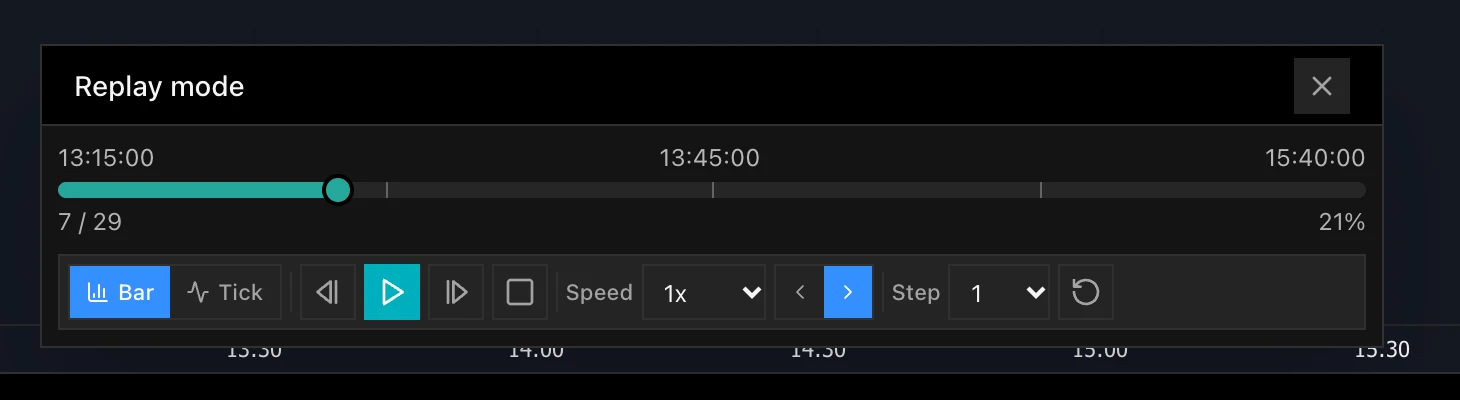
| Control | What it does |
|---|---|
| Progress bar | Shows the replay's start time, current position and end time, with the candle count and percentage beneath. Drag the handle to jump. |
| Bar / Tick | Replay bar-by-bar adds one completed candle at a time. Replay tick-by-tick builds each candle from its trades, so you watch it form. |
| Step backward (←) / Step forward (→) | Move one step at a time. |
| Play (Space) | Run the replay automatically; press again to pause. |
| Stop | Stop and reset to the beginning. |
| Speed | Playback speed for automatic play. |
| ‹ › | Play backward or forward. |
| Step | How many candles each manual step advances. |
| Reset to beginning (Home) | Return to the start candle. |
| × | Close the panel and leave replay. |
Leaving replay
Click Replay in the toolbar again (it reads Stopped or Playing while replay is on), or close the Replay mode panel. The chart returns to live data.
Working while replaying
Your indicators and drawings work in replay, so you can watch a moving average curl or a level get tested exactly as it happened. Indicators recalculate from the data visible at the replay position.
Replay pairs well with the Footprint and delta views — stepping through order flow bar by bar makes absorption and exhaustion much easier to see.