Derivatives Positioning
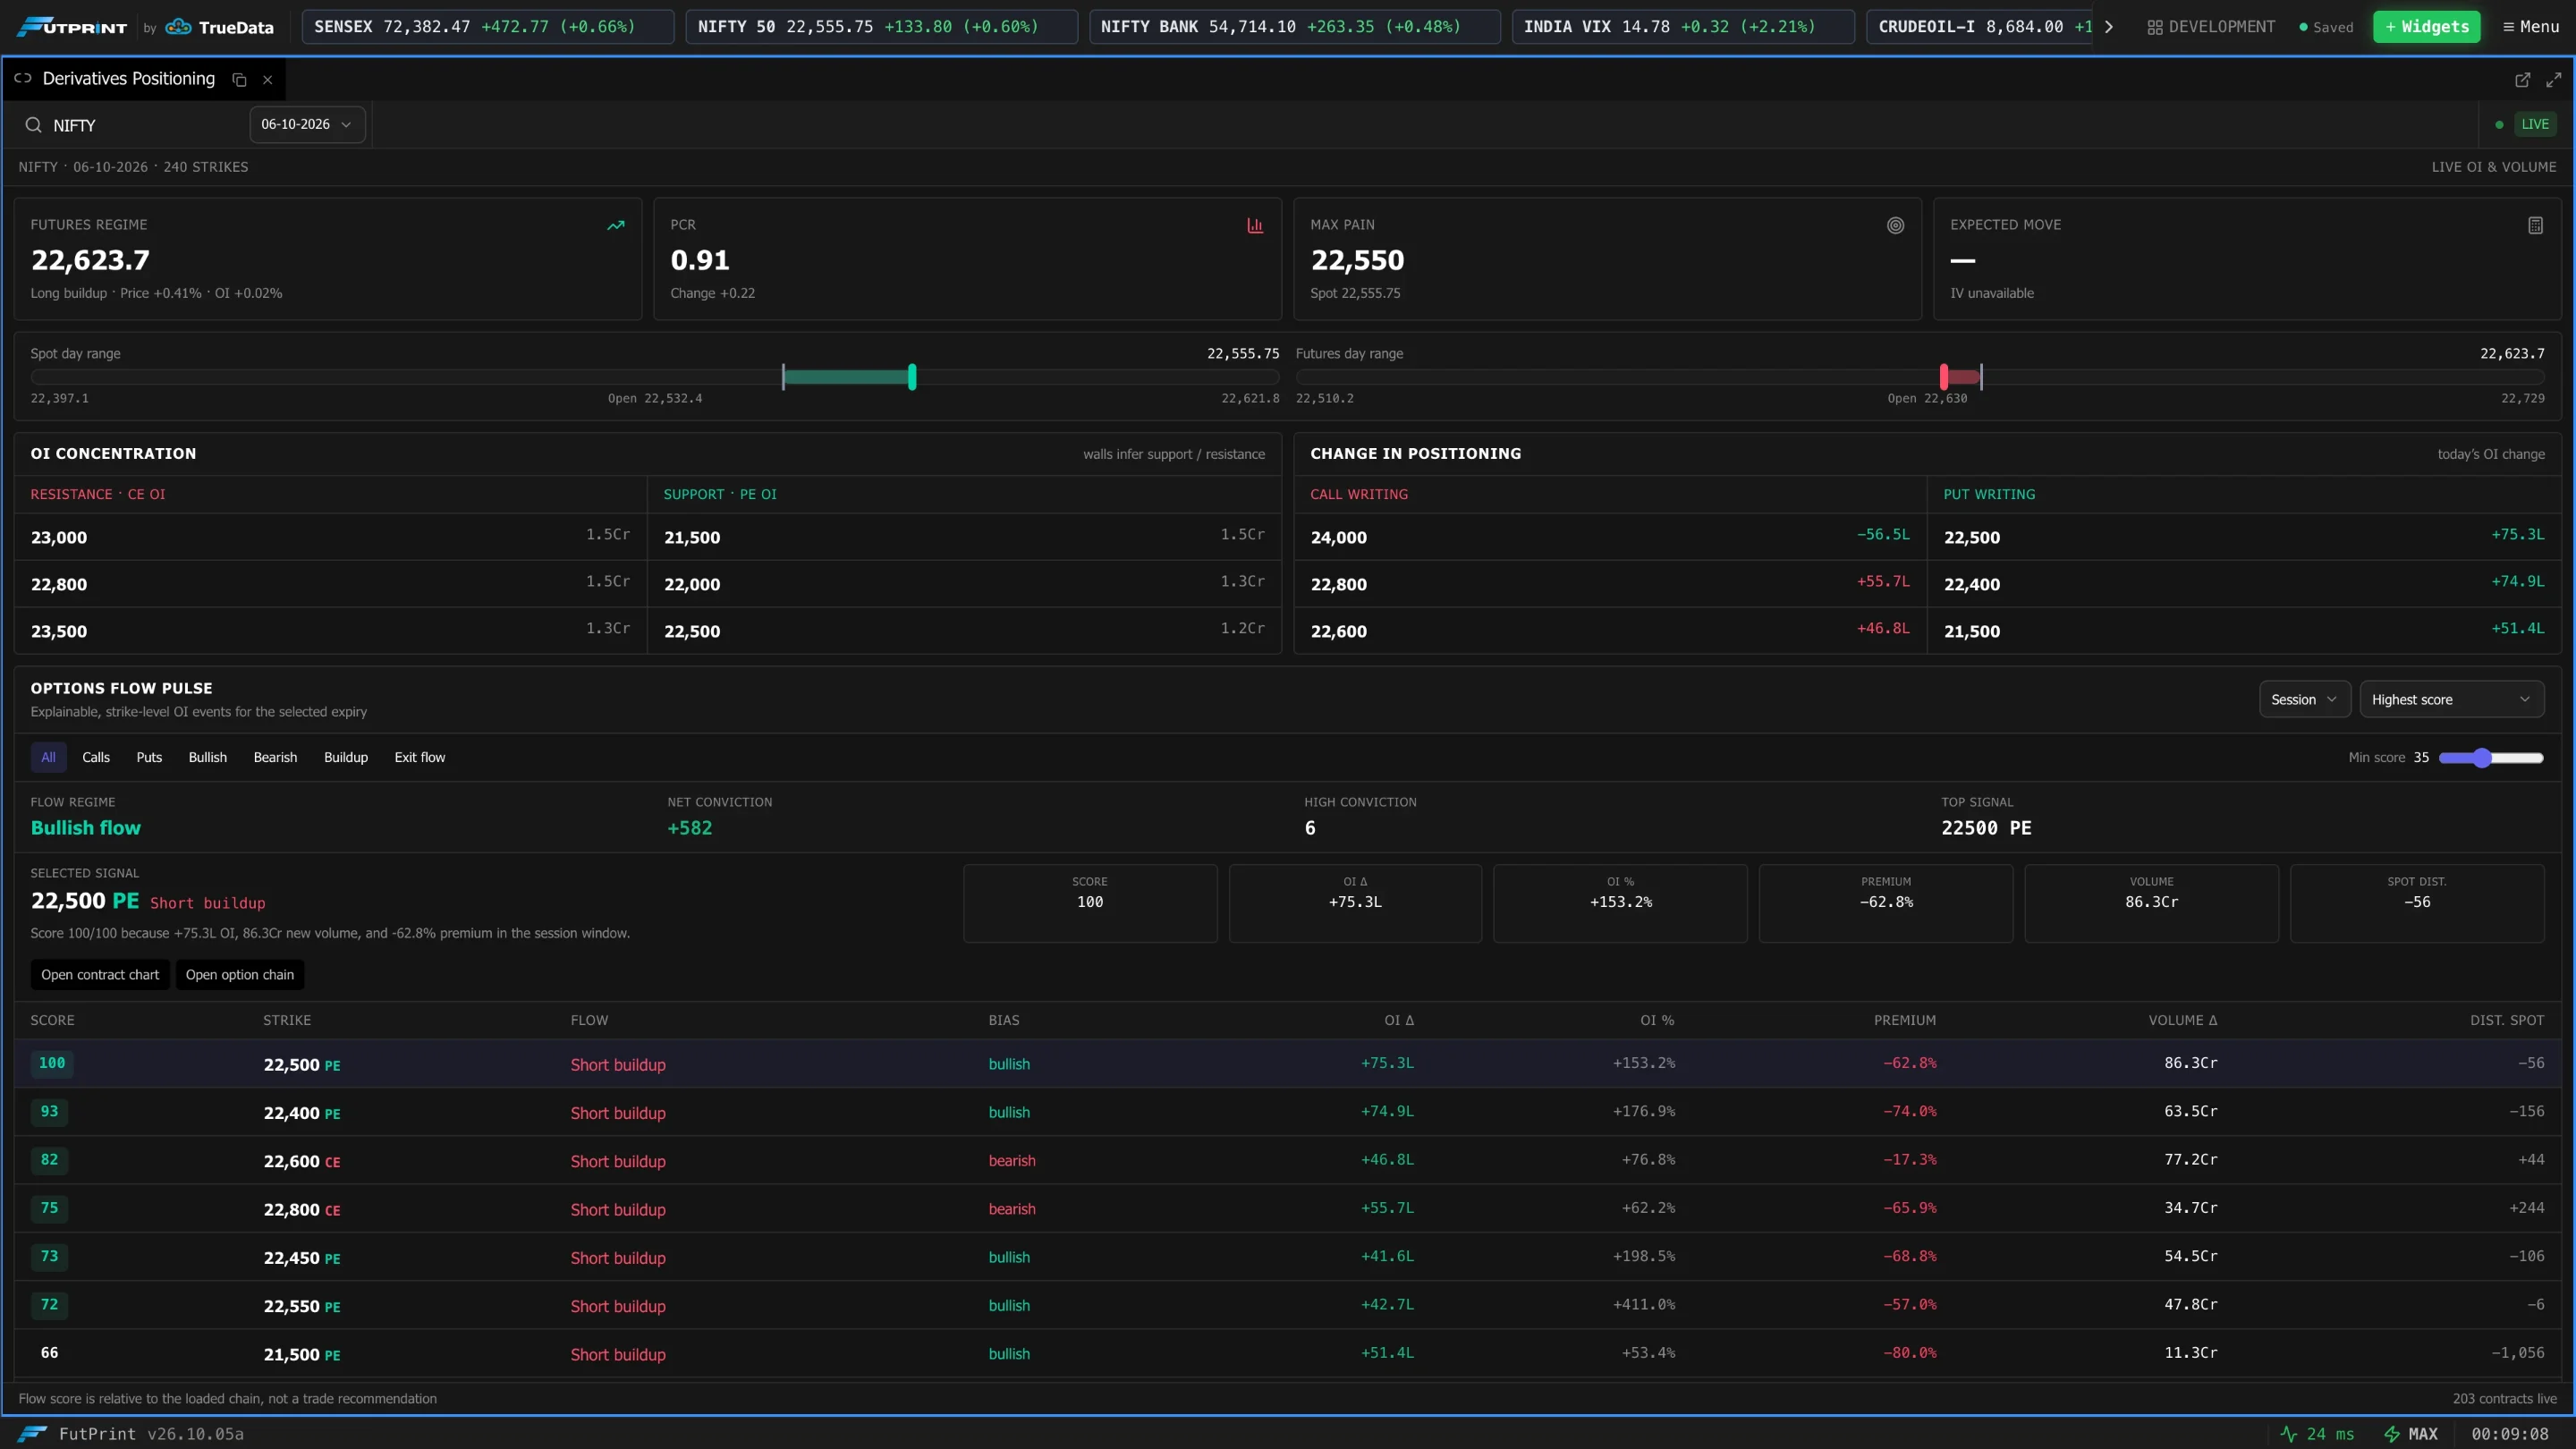
Derivatives Positioning is a one-screen read of how futures and options are positioned in an underlying: the futures regime, put–call ratio, max pain, where open interest is concentrated, how it changed today, and a ranked list of the option strikes with the most notable flow.
Choosing what to analyse
Use Search underlying and Option expiry in the toolbar. The line beneath shows the underlying, expiry and number of strikes loaded.
Summary cards
| Card | Meaning |
|---|---|
| Futures regime | The front future's price with a regime label built from the day's price and OI change — for example Long buildup when price and OI both rise. |
| PCR | Put–call ratio by open interest for the selected expiry, with its change. |
| Max pain | The strike at which option buyers as a group would lose the most at expiry, with the current spot for reference. |
| Expected move | The move implied by option prices. Shows IV unavailable when implied volatility cannot be computed. |
The two range bars underneath place the current price inside the Spot day range and the Futures day range. Hover for the open and current values.
OI Concentration
The three strikes holding the most open interest on each side:
- Resistance · CE OI — the largest call OI strikes.
- Support · PE OI — the largest put OI strikes.
These are static support and resistance references from positioning, not signals.
Change in Positioning
Today's largest OI changes: Call writing and Put writing, three strikes each, with the change in OI.
Options Flow Pulse
A ranked list of strike-level events for the selected expiry.
| Control | What it does |
|---|---|
| All / Calls / Puts / Bullish / Bearish / Buildup / Exit flow | Filter the list by option type, bias or flow type. |
| Flow comparison window | The window the change is measured over (for example Session). |
| Sort flow events | Sort order (for example Highest score). |
| Minimum flow score | Hide events scoring below the slider value. |
Above the table: the overall Flow regime, Net conviction, the number of High conviction events and the Top signal.
The table lists each event's Score, Strike, Flow (such as Short buildup), Bias, OI Δ, OI %, Premium change, Volume Δ and distance from spot.
Click a row to inspect it in the card above the table, which explains in words why it scored as it did. Double-click a row, or use Open contract chart, to chart that contract; Open option chain opens the chain at that strike.
The flow score ranks events relative to the loaded chain. It is context, not a trade recommendation.