Power Scanner
Power Scanner watches the Nifty 50 stock futures and lists order-flow and open-interest events as they happen: large prints, sweeps, delta surges, absorption, session high/low retests, OI build-ups and more. Each row is one finding on one symbol.
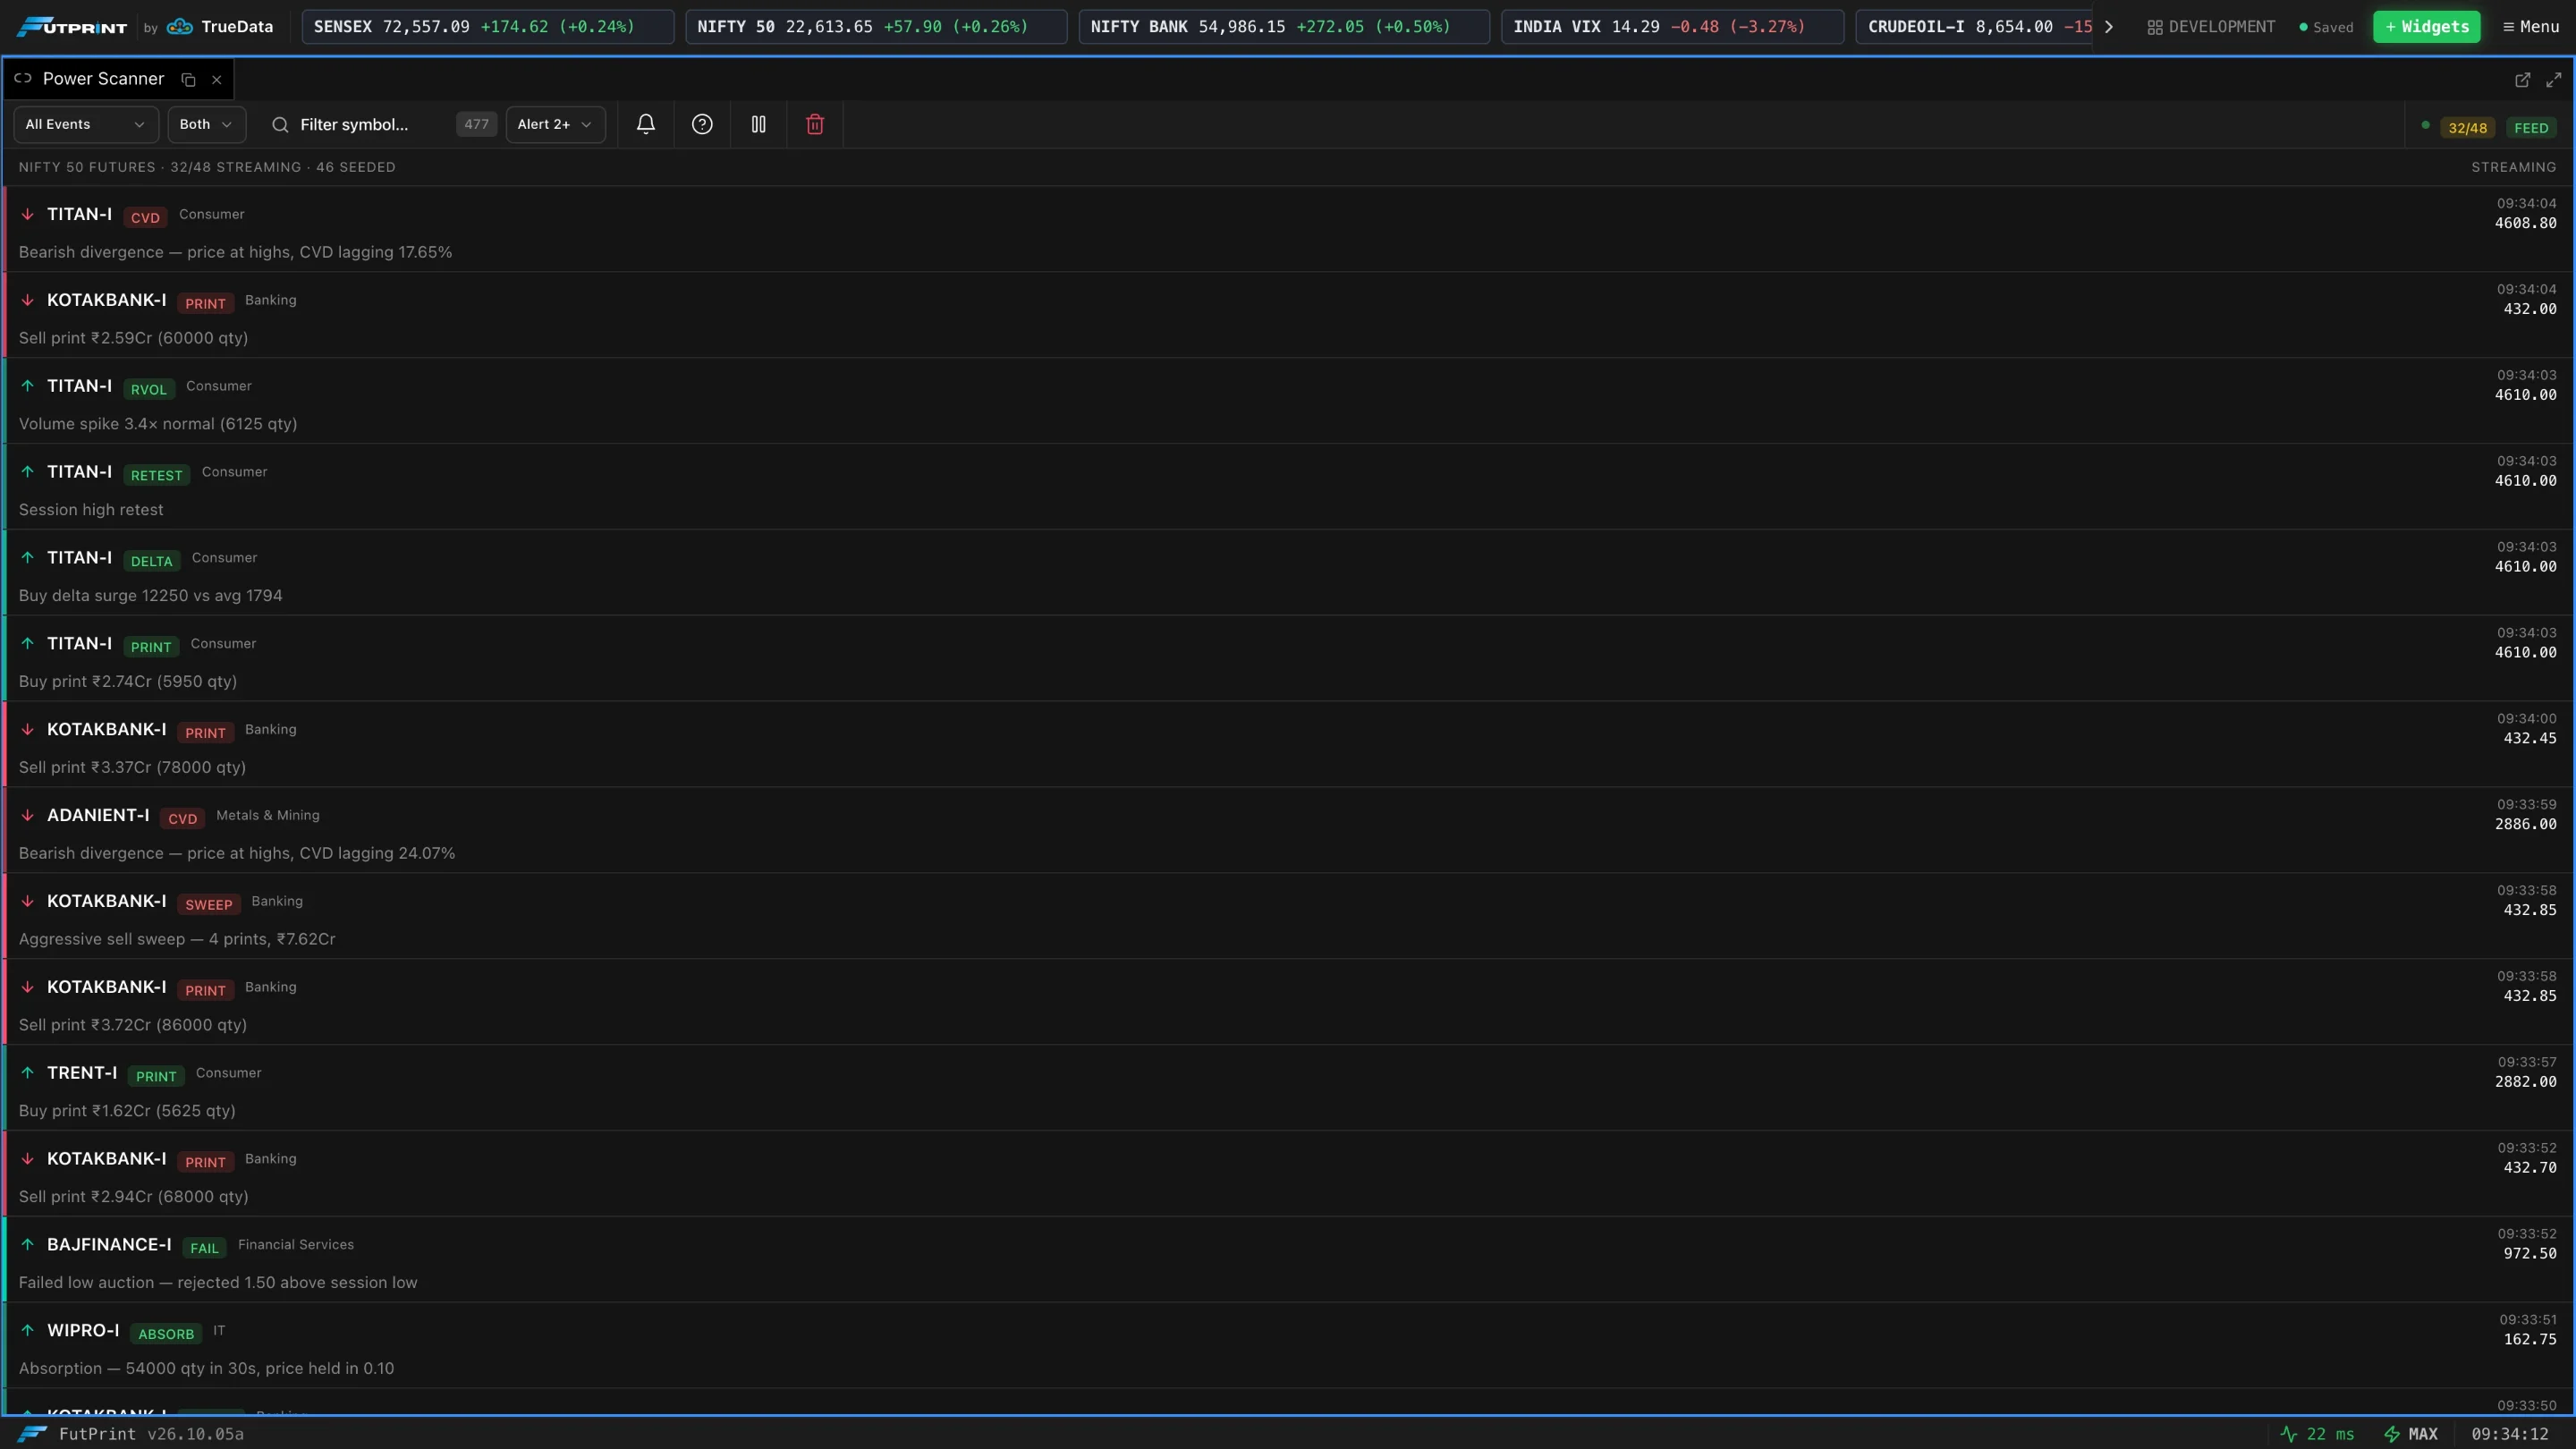
Power Scanner needs live market data. Outside NSE hours it shows No events yet.
Reading a row
| Part | Meaning |
|---|---|
| Arrow and left bar | Green and up for a buy-side or bullish finding, red and down for a sell-side or bearish one. A stronger left bar means the finding exceeded its threshold by more. |
| Symbol | The future the finding is on, for example RELIANCE-I. |
| Badge | The type of finding (see the table below). |
| Sector | The stock's sector. |
| Description | The numbers behind the finding, for example Buy print ₹2.12Cr (7425 qty). |
| Time and price | When the finding fired and the price at that moment. |
Click a row to load its symbol in the panels linked to the scanner. If nothing is linked, a new chart opens for that symbol.
The toolbar
| Control | What it does |
|---|---|
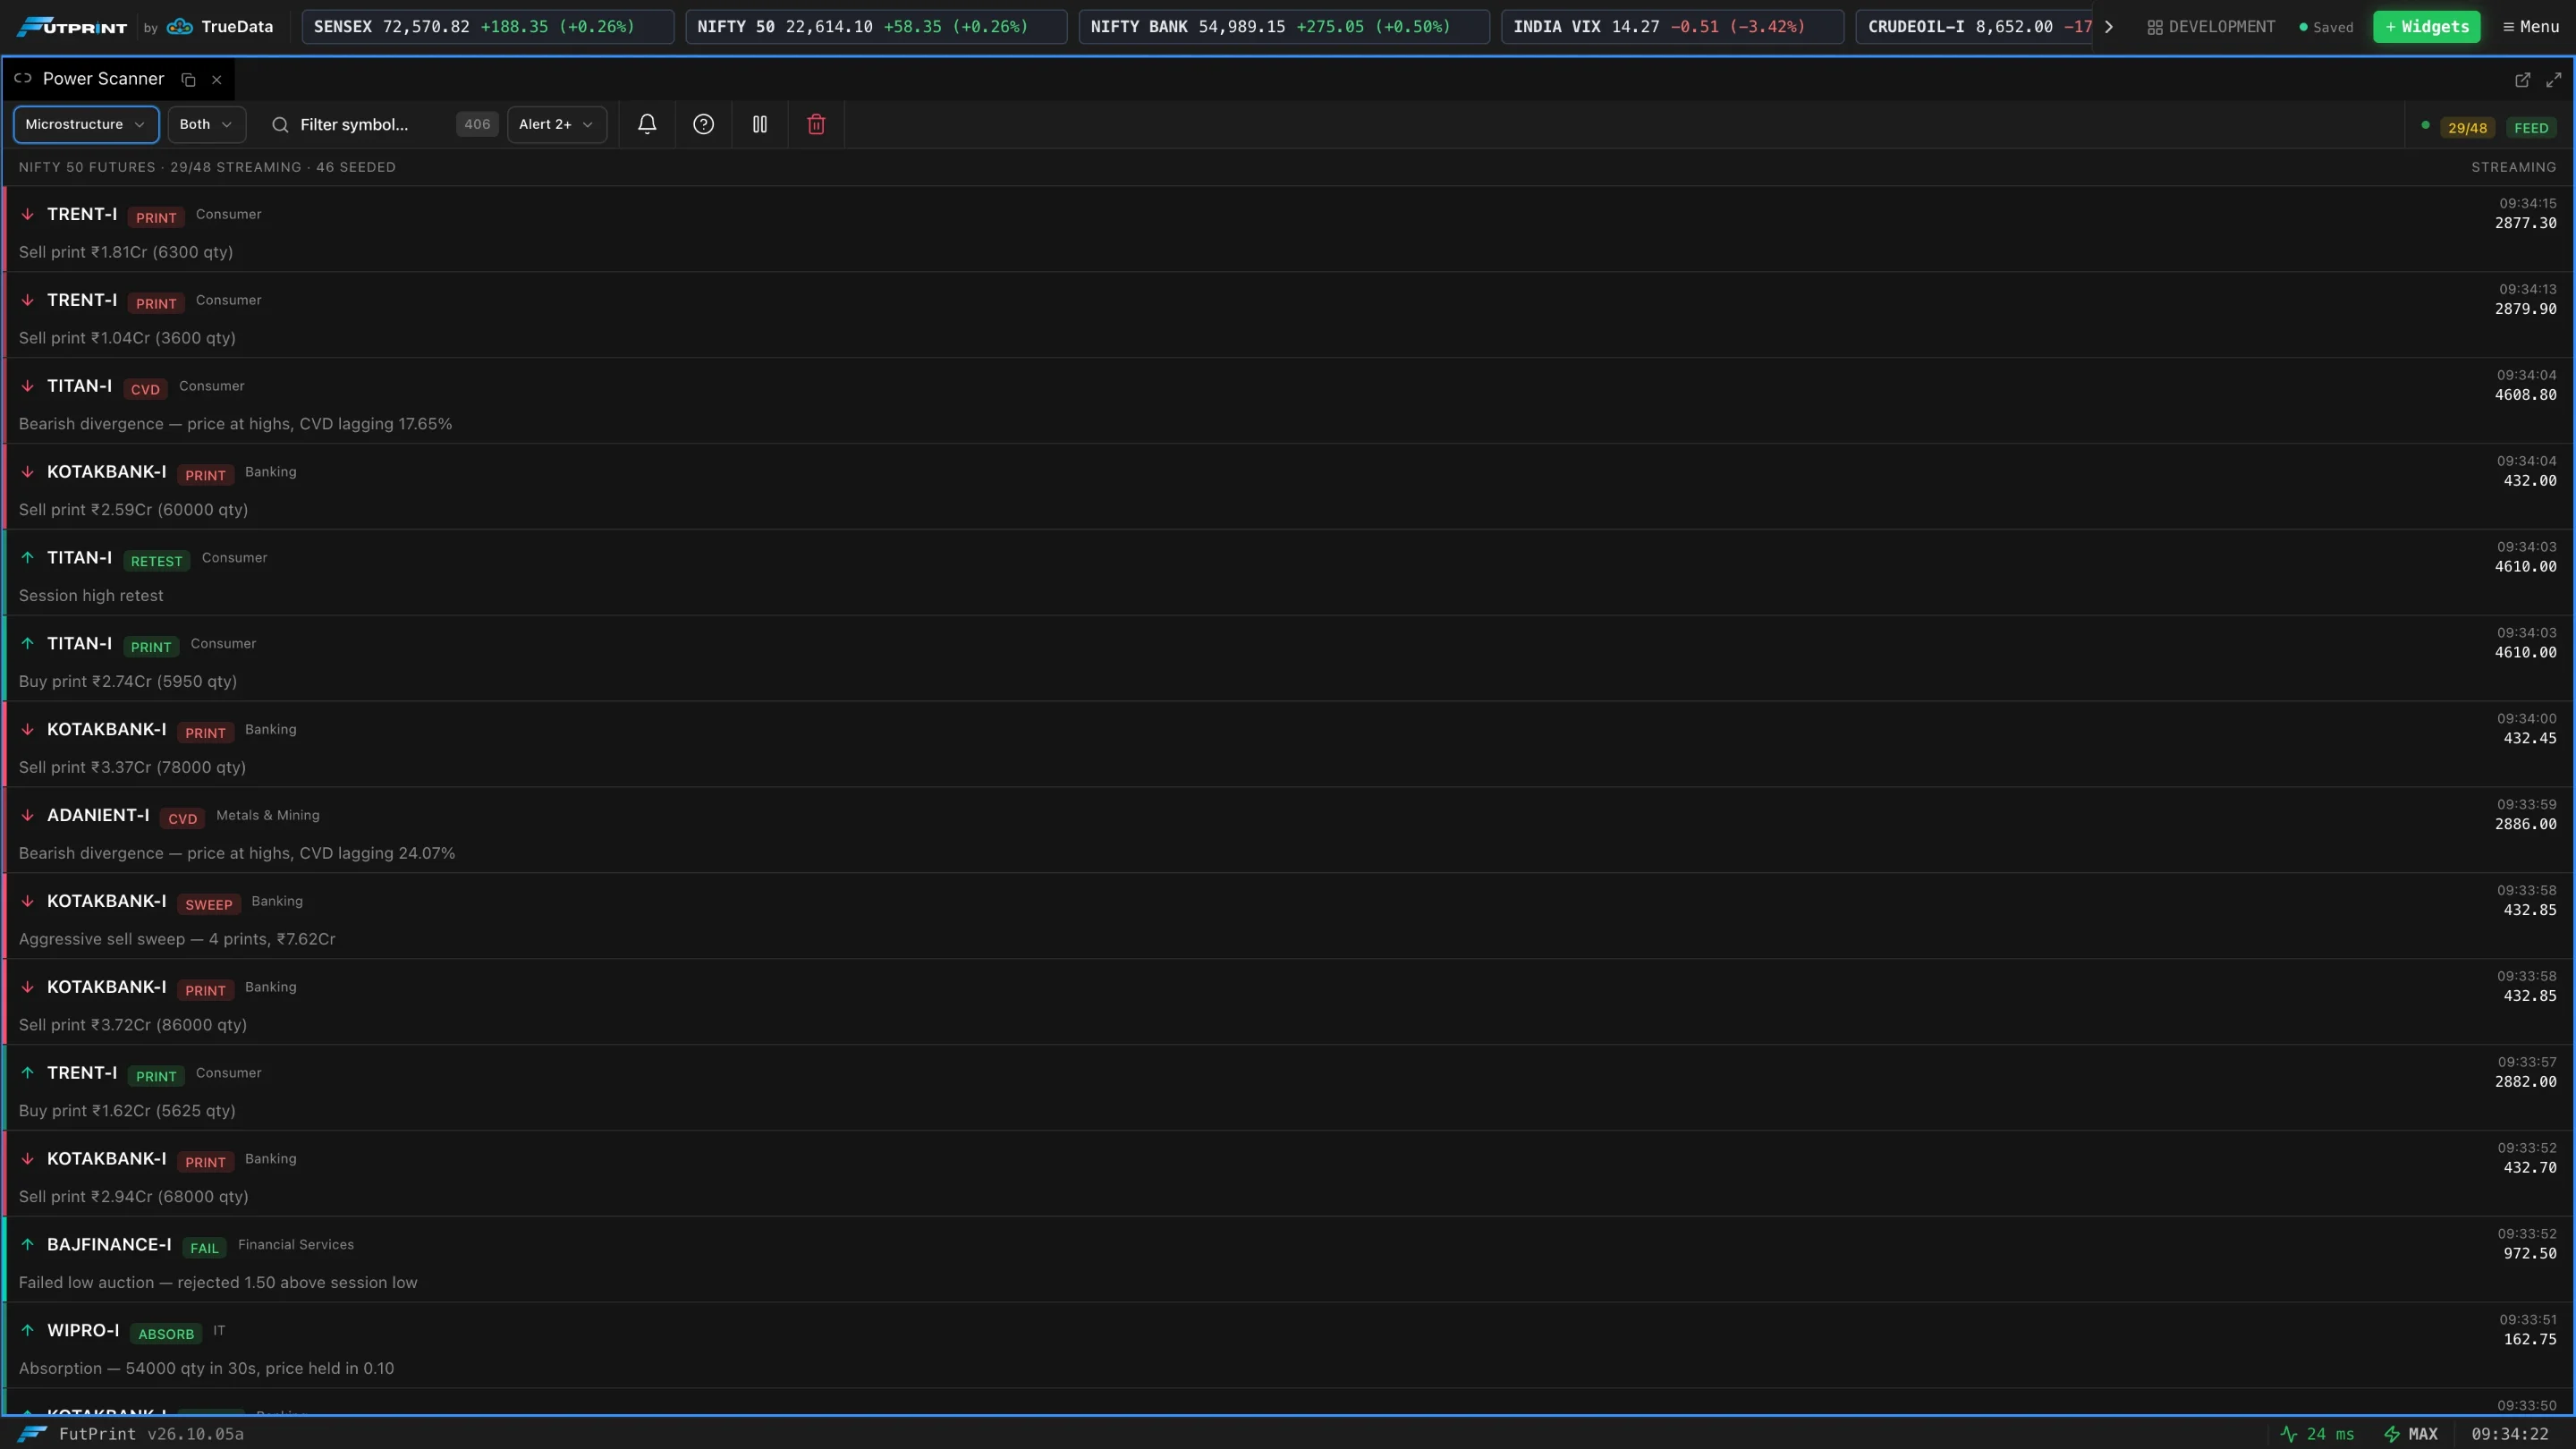
| Preset | Which findings are listed: All Events, Bullish Flow, Bearish Flow, OI Buildup or Microstructure. |
| Side | Both, Buy or Sell. |
| Filter symbol | Show one symbol only. The number beside it is the count of rows shown. |
| Alert 1+ / 2+ / 3 | The minimum strength a finding needs to raise an alert. |
| Bell | Turn in-app scanner alerts on or off. The first time, your browser asks for permission to notify. |
| ? | Opens the built-in guide to every finding. |
| Pause | Freeze the list so you can read it. Findings keep being collected and appear when you resume. |
| Clear | Empty the list. |
At the right, the first badge shows how many of the tracked futures are streaming (for example 47/48) and the FEED badge shows whether market data is arriving.
Presets
| Preset | Findings included |
|---|---|
| All Events | Everything. |
| Bullish Flow | Sweeps, delta surges, long build-up, short covering. |
| Bearish Flow | Sweeps, delta surges, short build-up, long unwinding. |
| OI Buildup | The four open-interest findings. |
| Microstructure | Large prints, sweeps, absorption, CVD divergence, failed auctions, H/L retests. |
Combine Bullish Flow with Side = Buy (or Bearish Flow with Sell) to see one direction only.
The findings
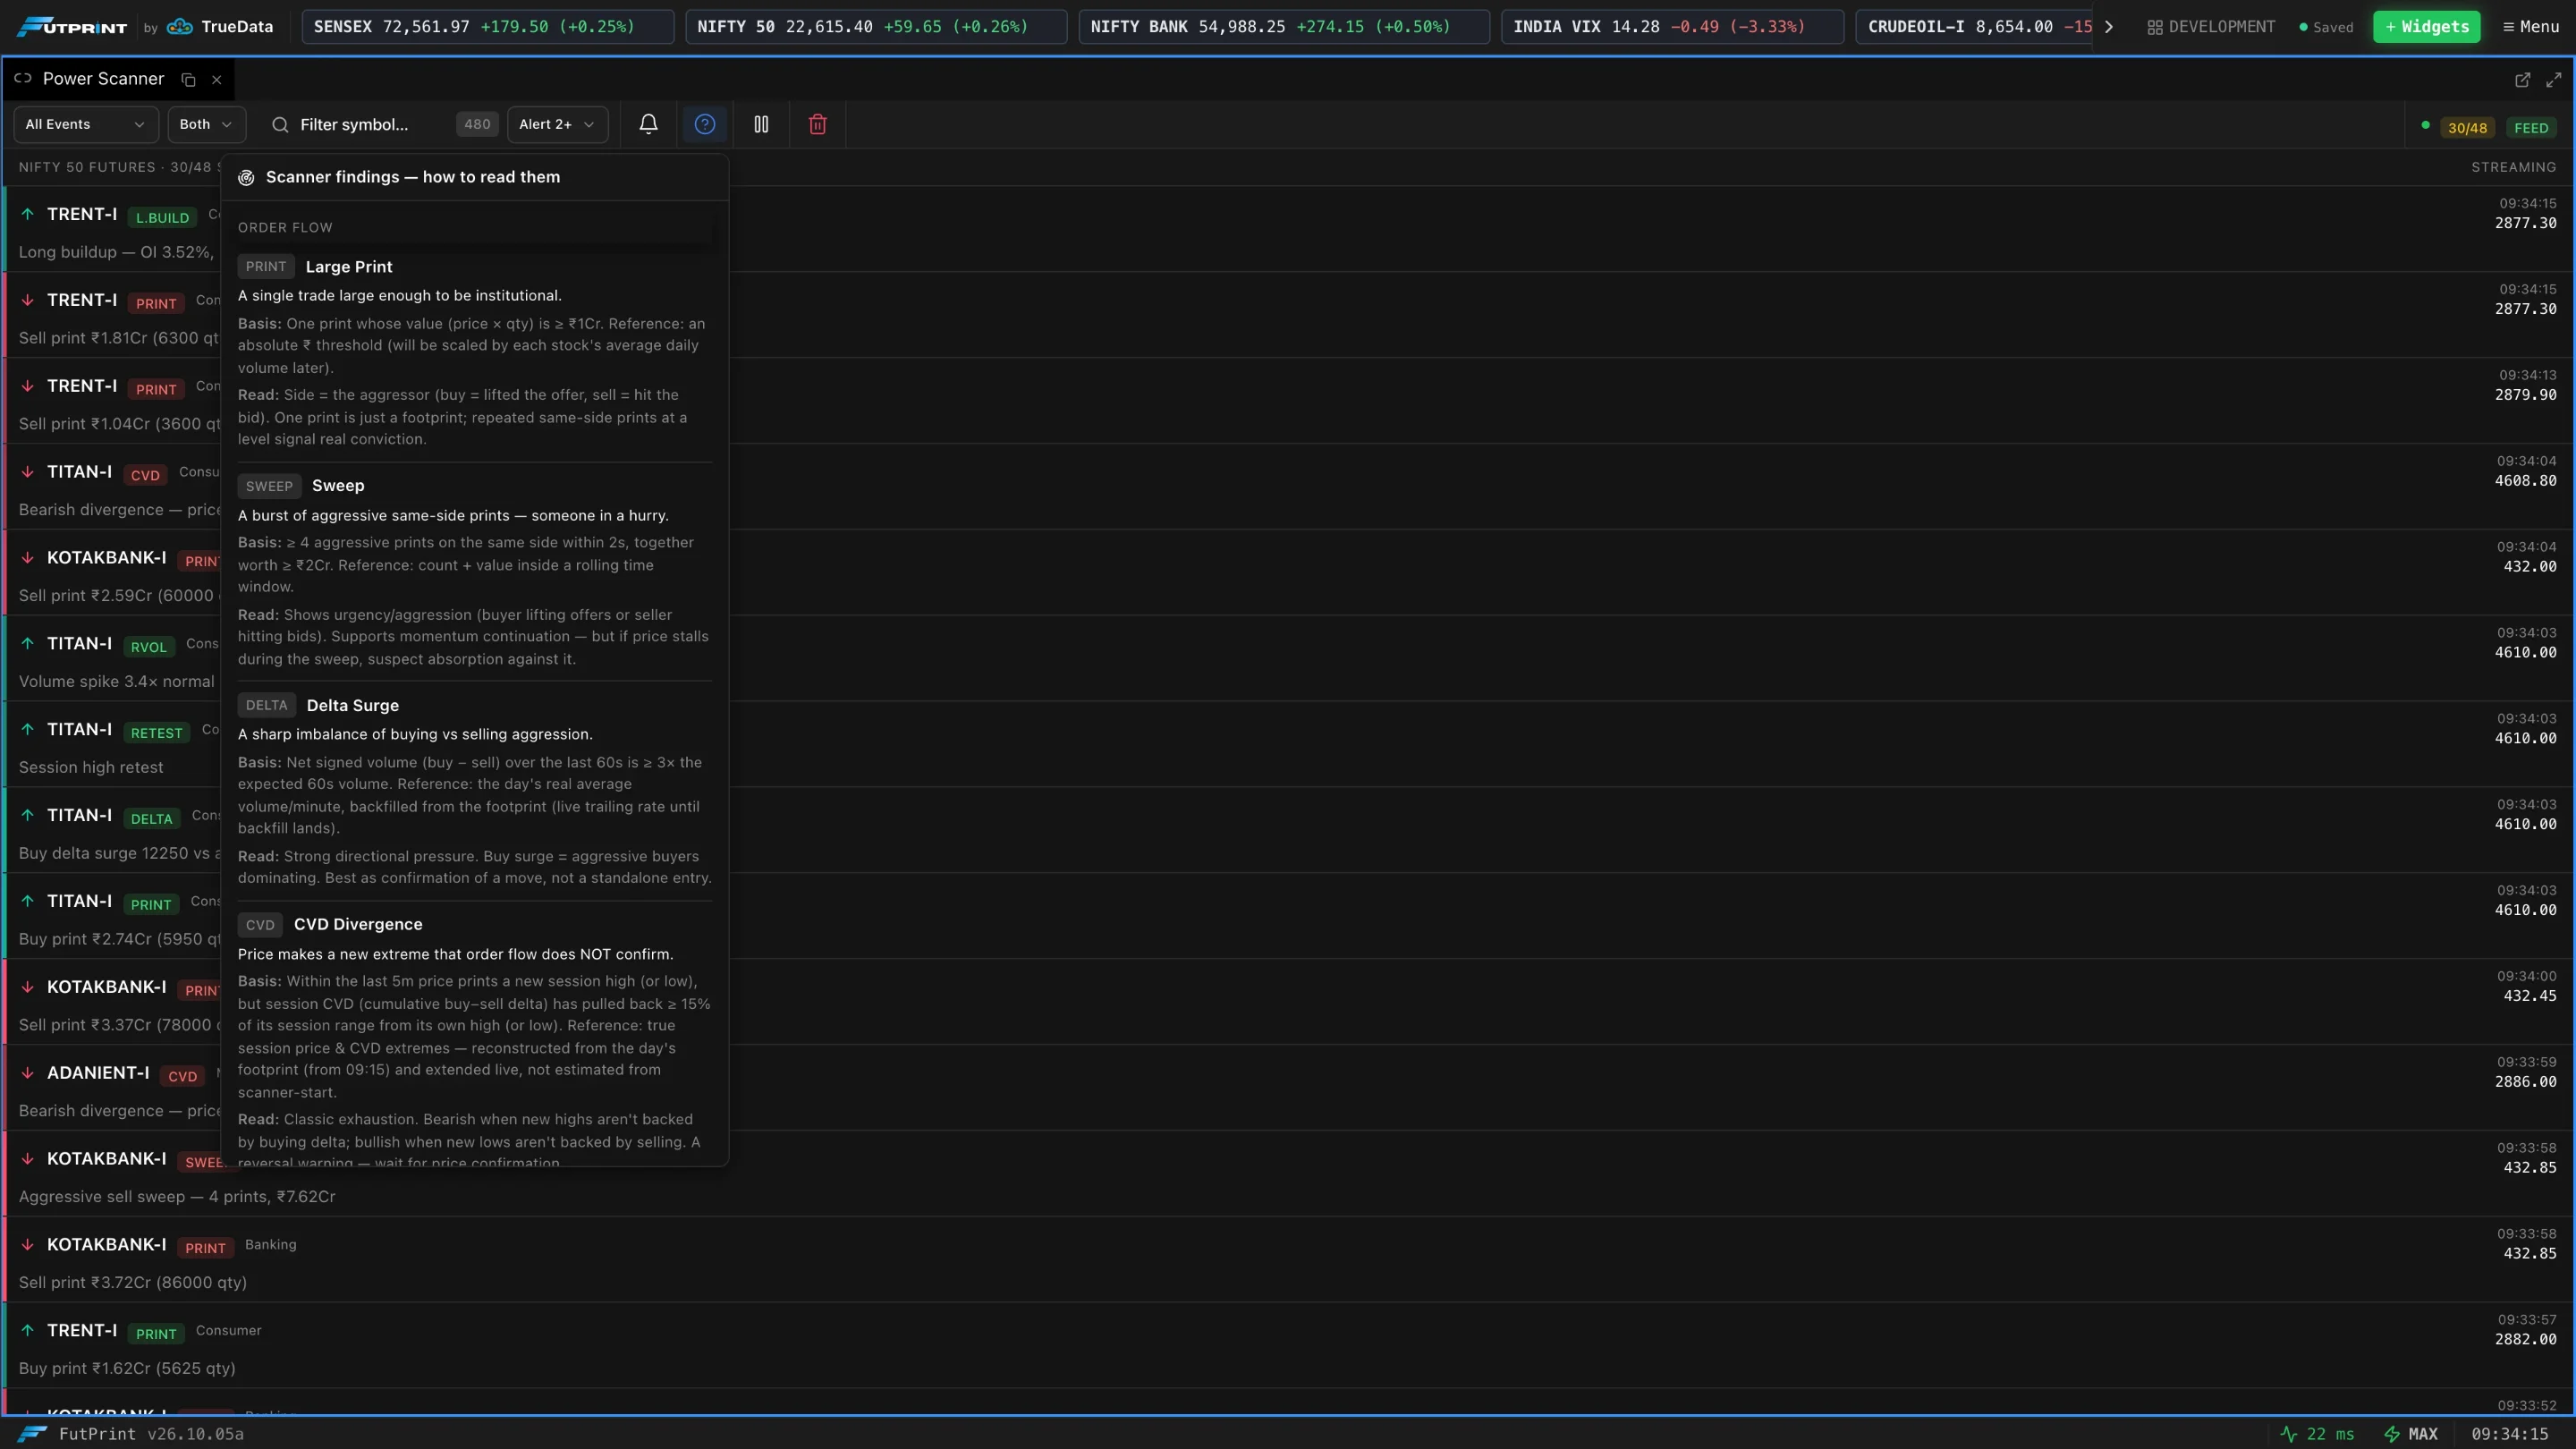
Order flow
| Badge | Finding | What triggers it | How to read it |
|---|---|---|---|
| Large Print | A single trade worth ₹1 Cr or more. | The side is the aggressor. One print is only a footprint; repeated same-side prints at a level show conviction. | |
| SWEEP | Sweep | Four or more aggressive prints on the same side within about 1.5 seconds, together worth ₹2 Cr or more. | Urgency. Supports continuation, but if price stalls during the sweep suspect absorption against it. |
| DELTA | Delta Surge | Net buy-minus-sell volume over the last minute is at least 3× the expected one-minute volume. | Strong directional pressure. Best as confirmation of a move. |
| CVD | CVD Divergence | Price prints a new session high or low while session CVD has pulled back at least 15% of its range from its own extreme. | Exhaustion. A reversal warning; wait for price to confirm. |
| FAIL | Failed Auction | Price trades at the session high or low and then retreats at least 3 ticks with opposing aggression. | A failed high is bearish, a failed low bullish, once price accepts back inside the prior range. |
| RETEST | H/L Retest | Price returns to within one tick of the session high or low after trading away from it. | Marks a decision level. Combine with absorption or delta before calling a breakout or a reversal. |
| ABSORB | Absorption | 50,000 or more quantity trades in 30 seconds while price stays within 4 ticks. | A passive participant is absorbing aggression. Often marks support or resistance. |
| RVOL | RVOL Spike | Volume in the last minute is at least 3× the expected one-minute volume. | Unusual participation. It has no direction; pair it with delta or price. |
Open interest
Each compares price and open interest with their values five minutes earlier, and needs open interest to have changed by at least 2%.
| Badge | Finding | Price | OI | How to read it |
|---|---|---|---|---|
| L.BUILD | Long Buildup | Up | Up | Bullish: new longs are entering. |
| S.BUILD | Short Buildup | Down | Up | Bearish: new shorts are entering. |
| S.COVER | Short Covering | Up | Down | Bullish, but partly shorts exiting; momentum can fade once covering is done. |
| L.UNWIND | Long Unwinding | Down | Down | Bearish, but partly longs exiting; selling can ease once unwinding completes. |
Session price, CVD and volume baselines are rebuilt from the day's data when the panel opens, so they are accurate from 09:15. Open-interest findings need about five minutes of live data before they start. The same finding on the same symbol is not repeated for 60 seconds. The thresholds above are starting defaults and may be tuned.
Working with it
- Keep Power Scanner linked to a footprint chart: click a finding and read the candle that produced it.
- Market Pulse summarises the same findings into a market stance, a focus list and sector leadership.
- Tick Analyser explains every print on a single symbol in plain English.
A finding describes what just happened. It is not a trade signal on its own; confirm the setup on the chart before acting.