A charting engine built for speed and depth
Thirteen chart types, a full drawing and indicator library, tick-accurate replay and cloud-saved charts — on a WebGL canvas that stays smooth on the busiest expiry days.
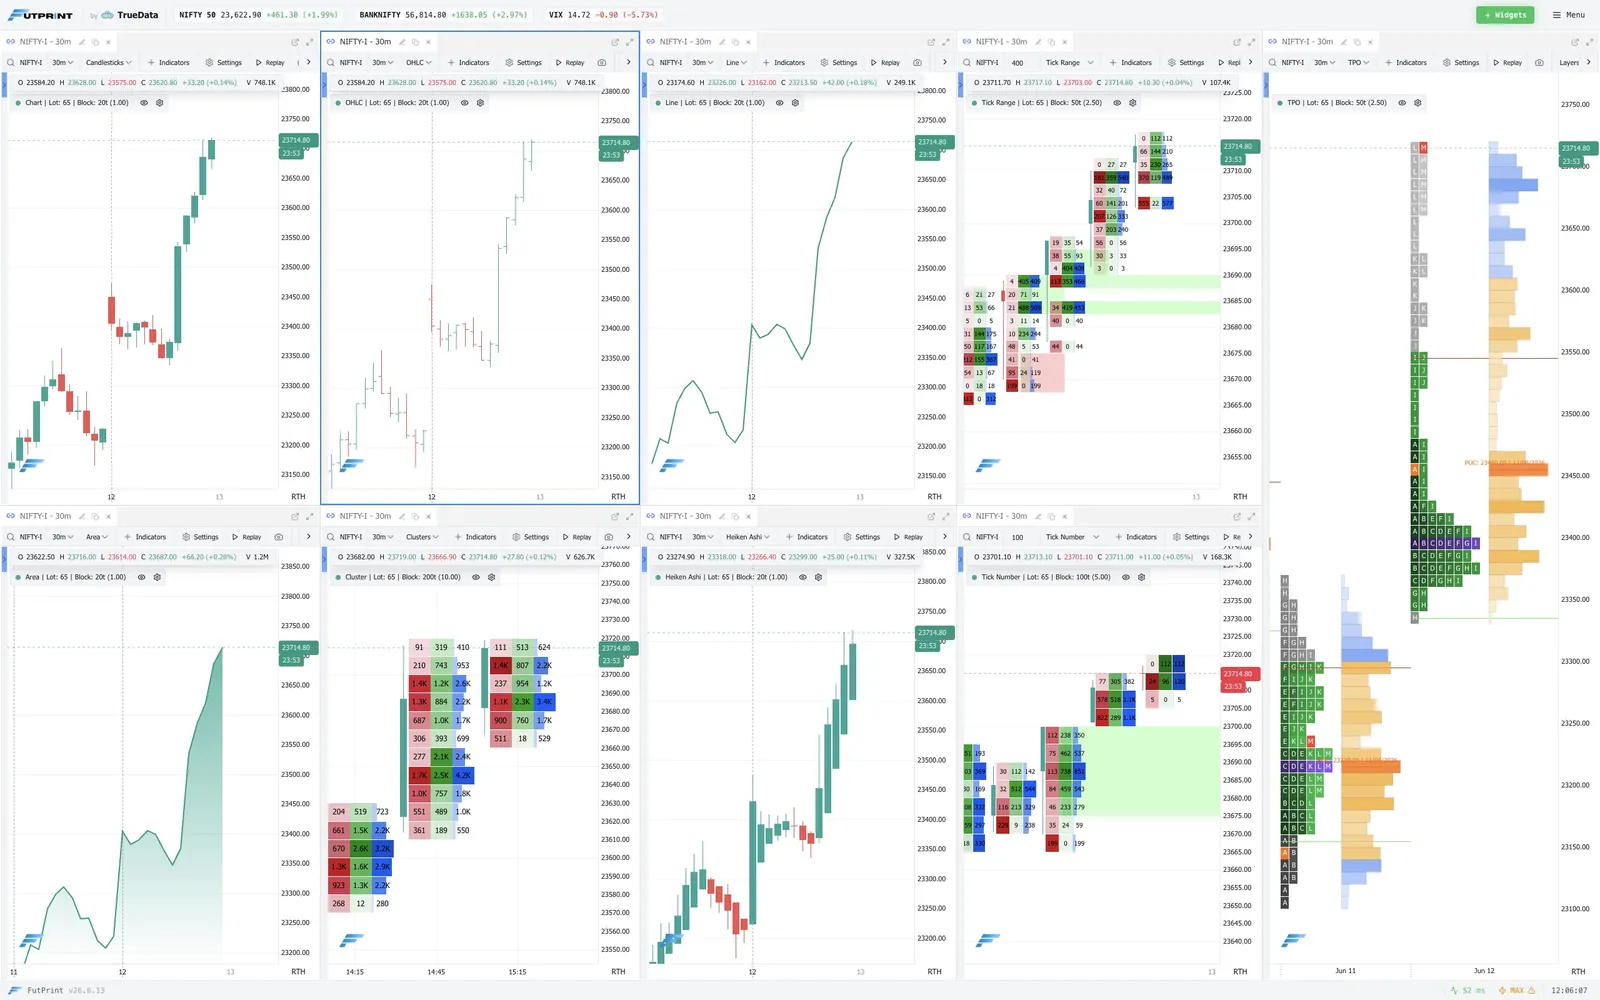
Thirteen ways to read price
Standard price visualisation, alternative time and movement scaling, and dedicated order flow renderings — switch type in a single click.
Candlestick
Open, high, low and close as bodies and wicks.
OHLC
Open, high, low and close shown as bar ticks.
Line
Close-to-close line for a clean trend read.
Area
Filled line chart emphasising price direction.
Footprint
Per-price-level order flow inside each candle.
Volume Profile
Volume distribution plotted across price.
Renko
Fixed-size bricks that filter time and noise.
Kagi
Reversal-driven line that ignores time.
Heikin Ashi
Averaged candles that smooth trend direction.
Range Bar
A new bar prints once a set range is covered.
Tick Range
Bars built from a fixed range measured in ticks.
Tick Number
Bars built from a fixed number of trades.
TPO
Time Price Opportunity (Market Profile) distribution.
A full toolkit, weighted to order flow
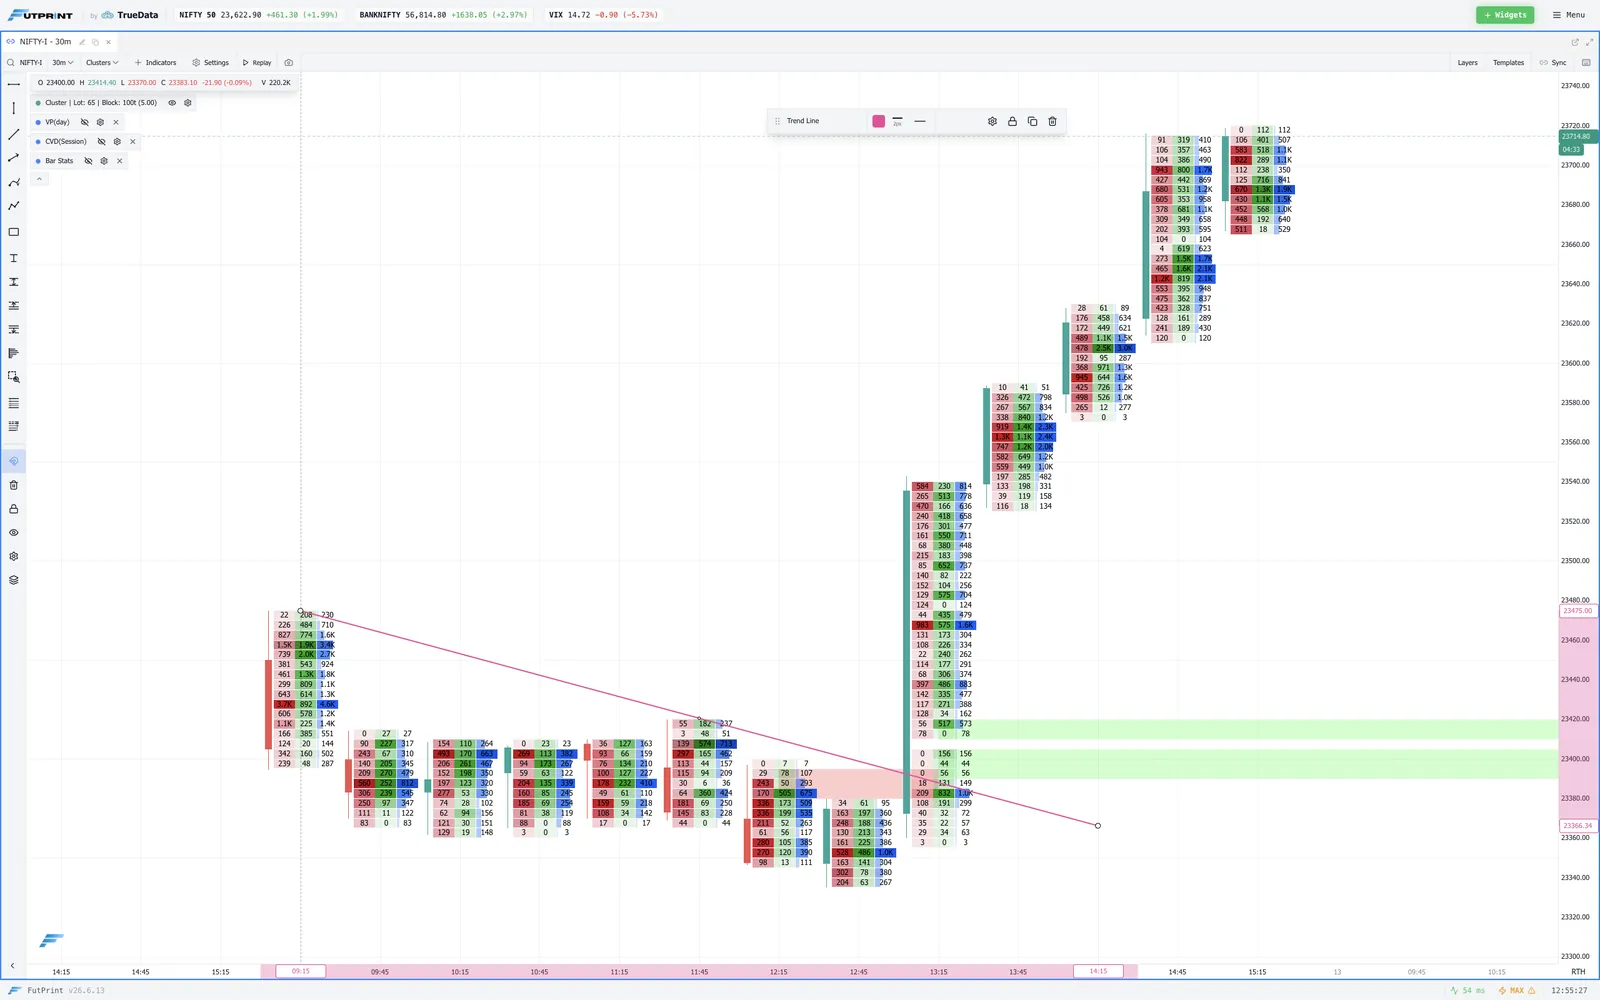
Trend lines, channels, Fibonacci tools, shapes and text sit alongside standard technical studies — with a library that leans into order flow analysis.
- Trend lines, channels & Fibonacci
- Shapes, text & annotations
- Footprint clusters & profiles
- VWAP, bands & bar statistics
- Delta & cumulative delta
- Power trades on the chart
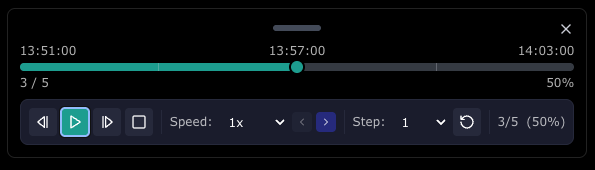
Reconstruct any session, bar by bar
Step through a session exactly as it unfolded — rehearse setups and study how order flow printed in real time.
- Tick-by-tick replay
- Advance one trade at a time
- Bar-by-bar replay
- Rehearse setups at your pace
Precise control over price and time
Granular control over how price and time render, with multi-axis support for plotting instruments and studies on separate scales.
- Independent price & time settings
- Multi-axis for separate scales
- Right-click drag to zoom one axis
- Hold Cmd to zoom both at once
Every chart travels with your account
Charts live in the cloud and restore on any device, fully styled the way you like them, with one-click sharing.
- Customisable colour schemes
- One-click screenshots & sharing
- Workspaces saved to the cloud
- Layered charting objects
Alerts that run without your browser
Set server-side price alerts that trigger independently of your screen and push notifications into your own automations.
- Server-side price alerts
- Runs with the browser closed
- Telegram notifications
- Custom webhooks for automation
See it live in the terminal
Open FutPrint free and put every tool to work on today's session.