Chart — Symbol & Timeframes
Changing the symbol
The symbol control in the toolbar sets which instrument the chart draws. Use it to load any stock, index, future or option across NSE, BSE or MCX (see Finding Symbols for how search works).
You can also load a chart from another module — clicking a watchlist row, a heatmap tile or an option-chain cell opens or updates a chart for that symbol. If the chart is linked, selecting a symbol in any linked panel changes it here automatically.
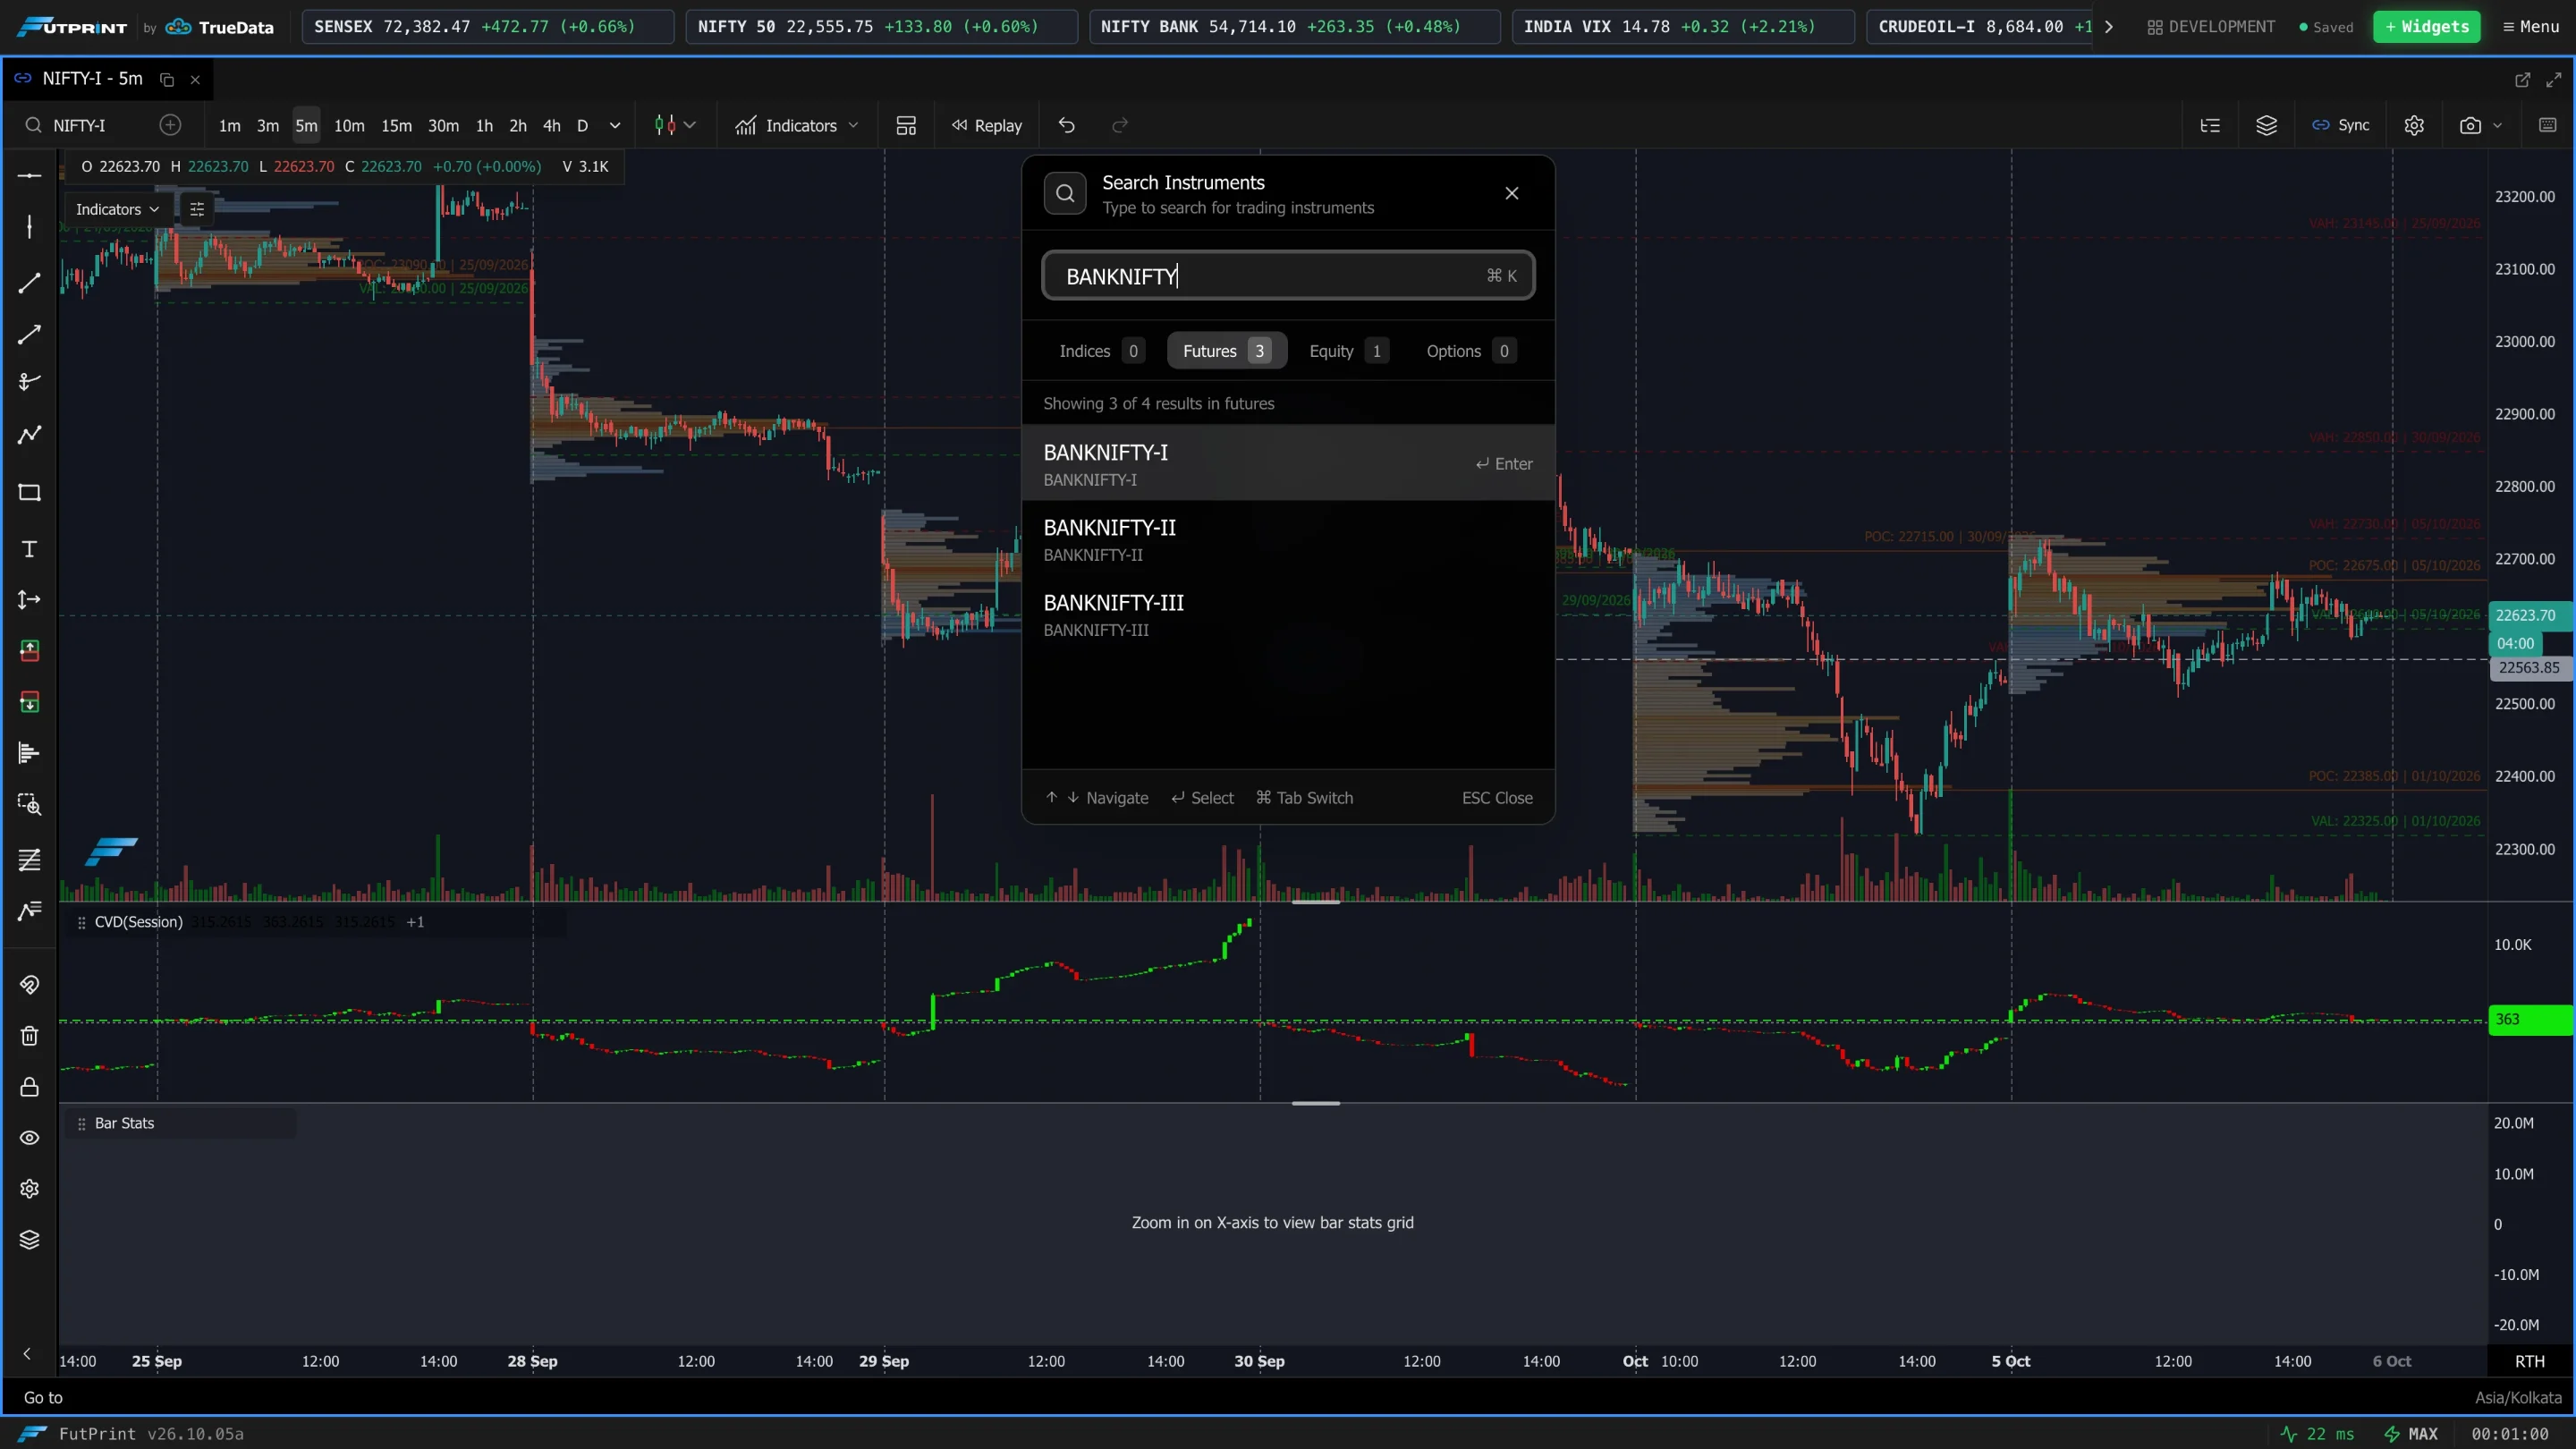
When the symbol changes, the chart keeps your timeframe, chart type, indicators and drawings, and re-fits the view to the new data.
Timeframes
The Timeframe selector sets the duration of each bar. The built-in presets are:
| Minutes | Hours | Days+ |
|---|---|---|
| 1m · 3m · 5m · 15m · 30m | 1h · 4h | 1D · 1W · 1M |
Choose Custom… to enter any minute value (e.g. a 2m or 45m bar) when a preset doesn't fit your style.

The buttons in the toolbar are your quick intervals. Open the arrow beside them for the full list, where you choose which intervals are pinned to the toolbar and enter a custom interval.
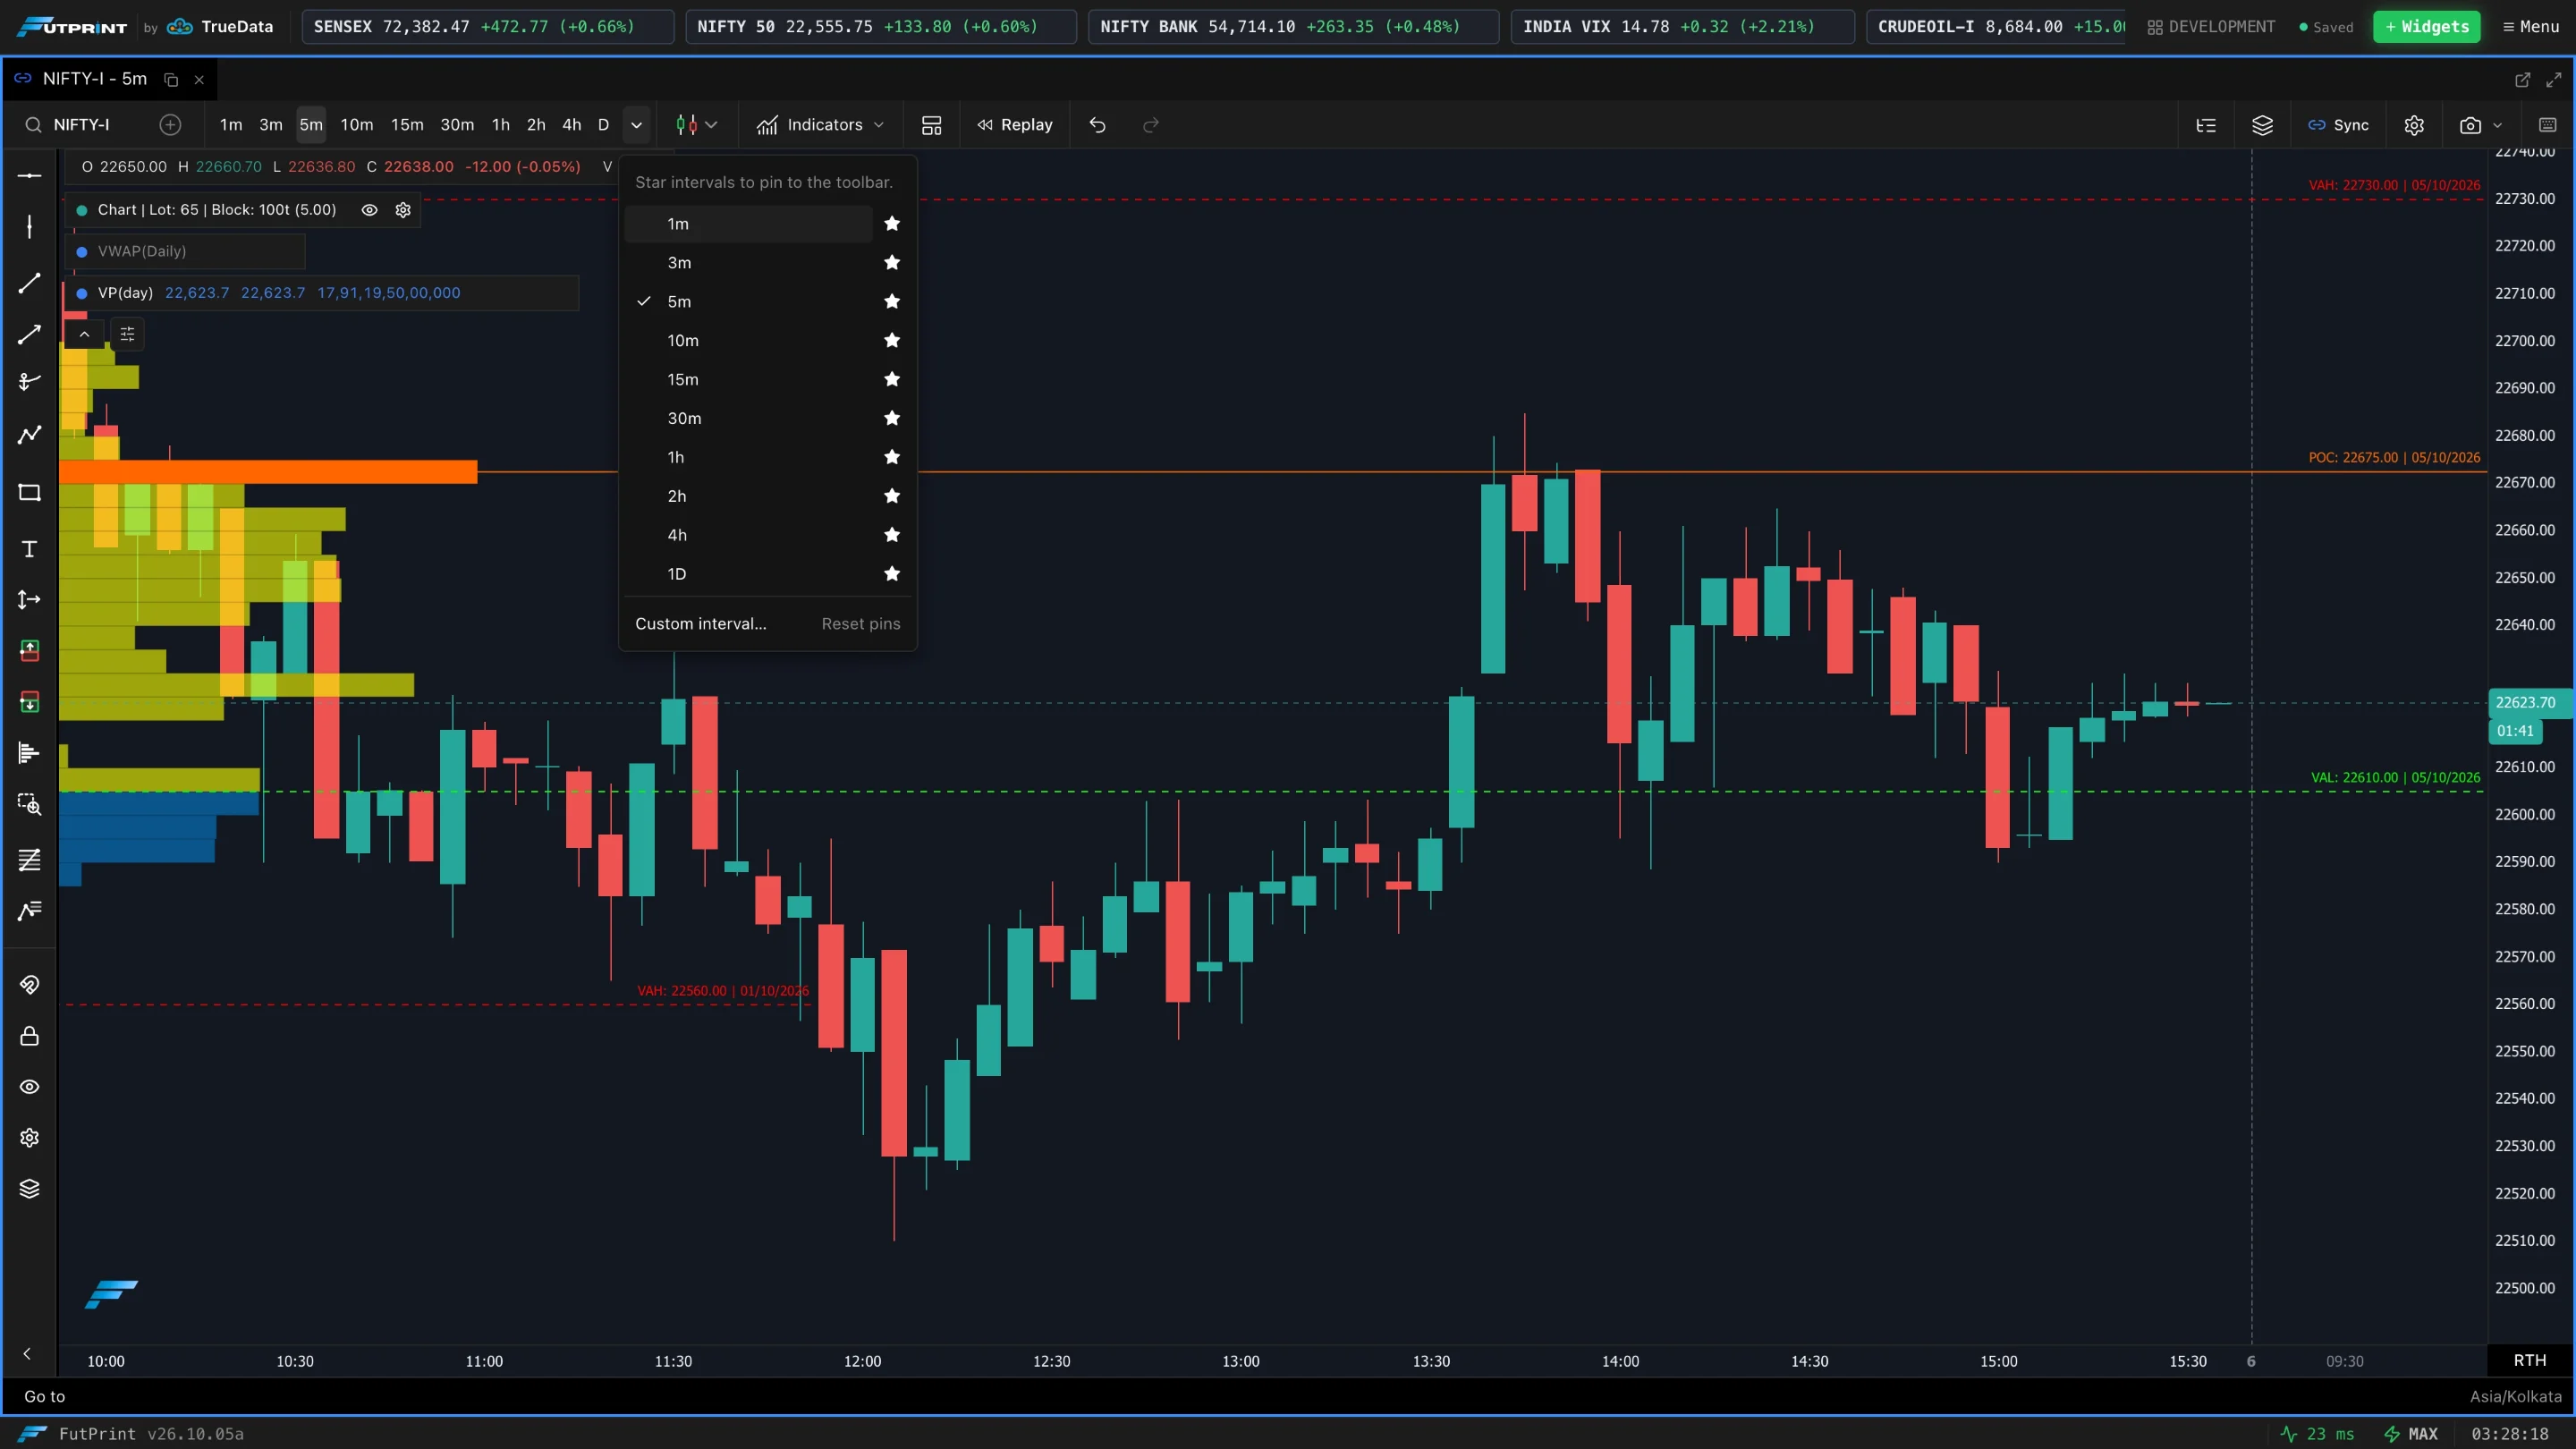
Shorter timeframes show finer detail but cover less calendar time on screen; higher timeframes compress more history into the same width. The chart fetches the history it needs for the timeframe you pick.
Tick-based bars
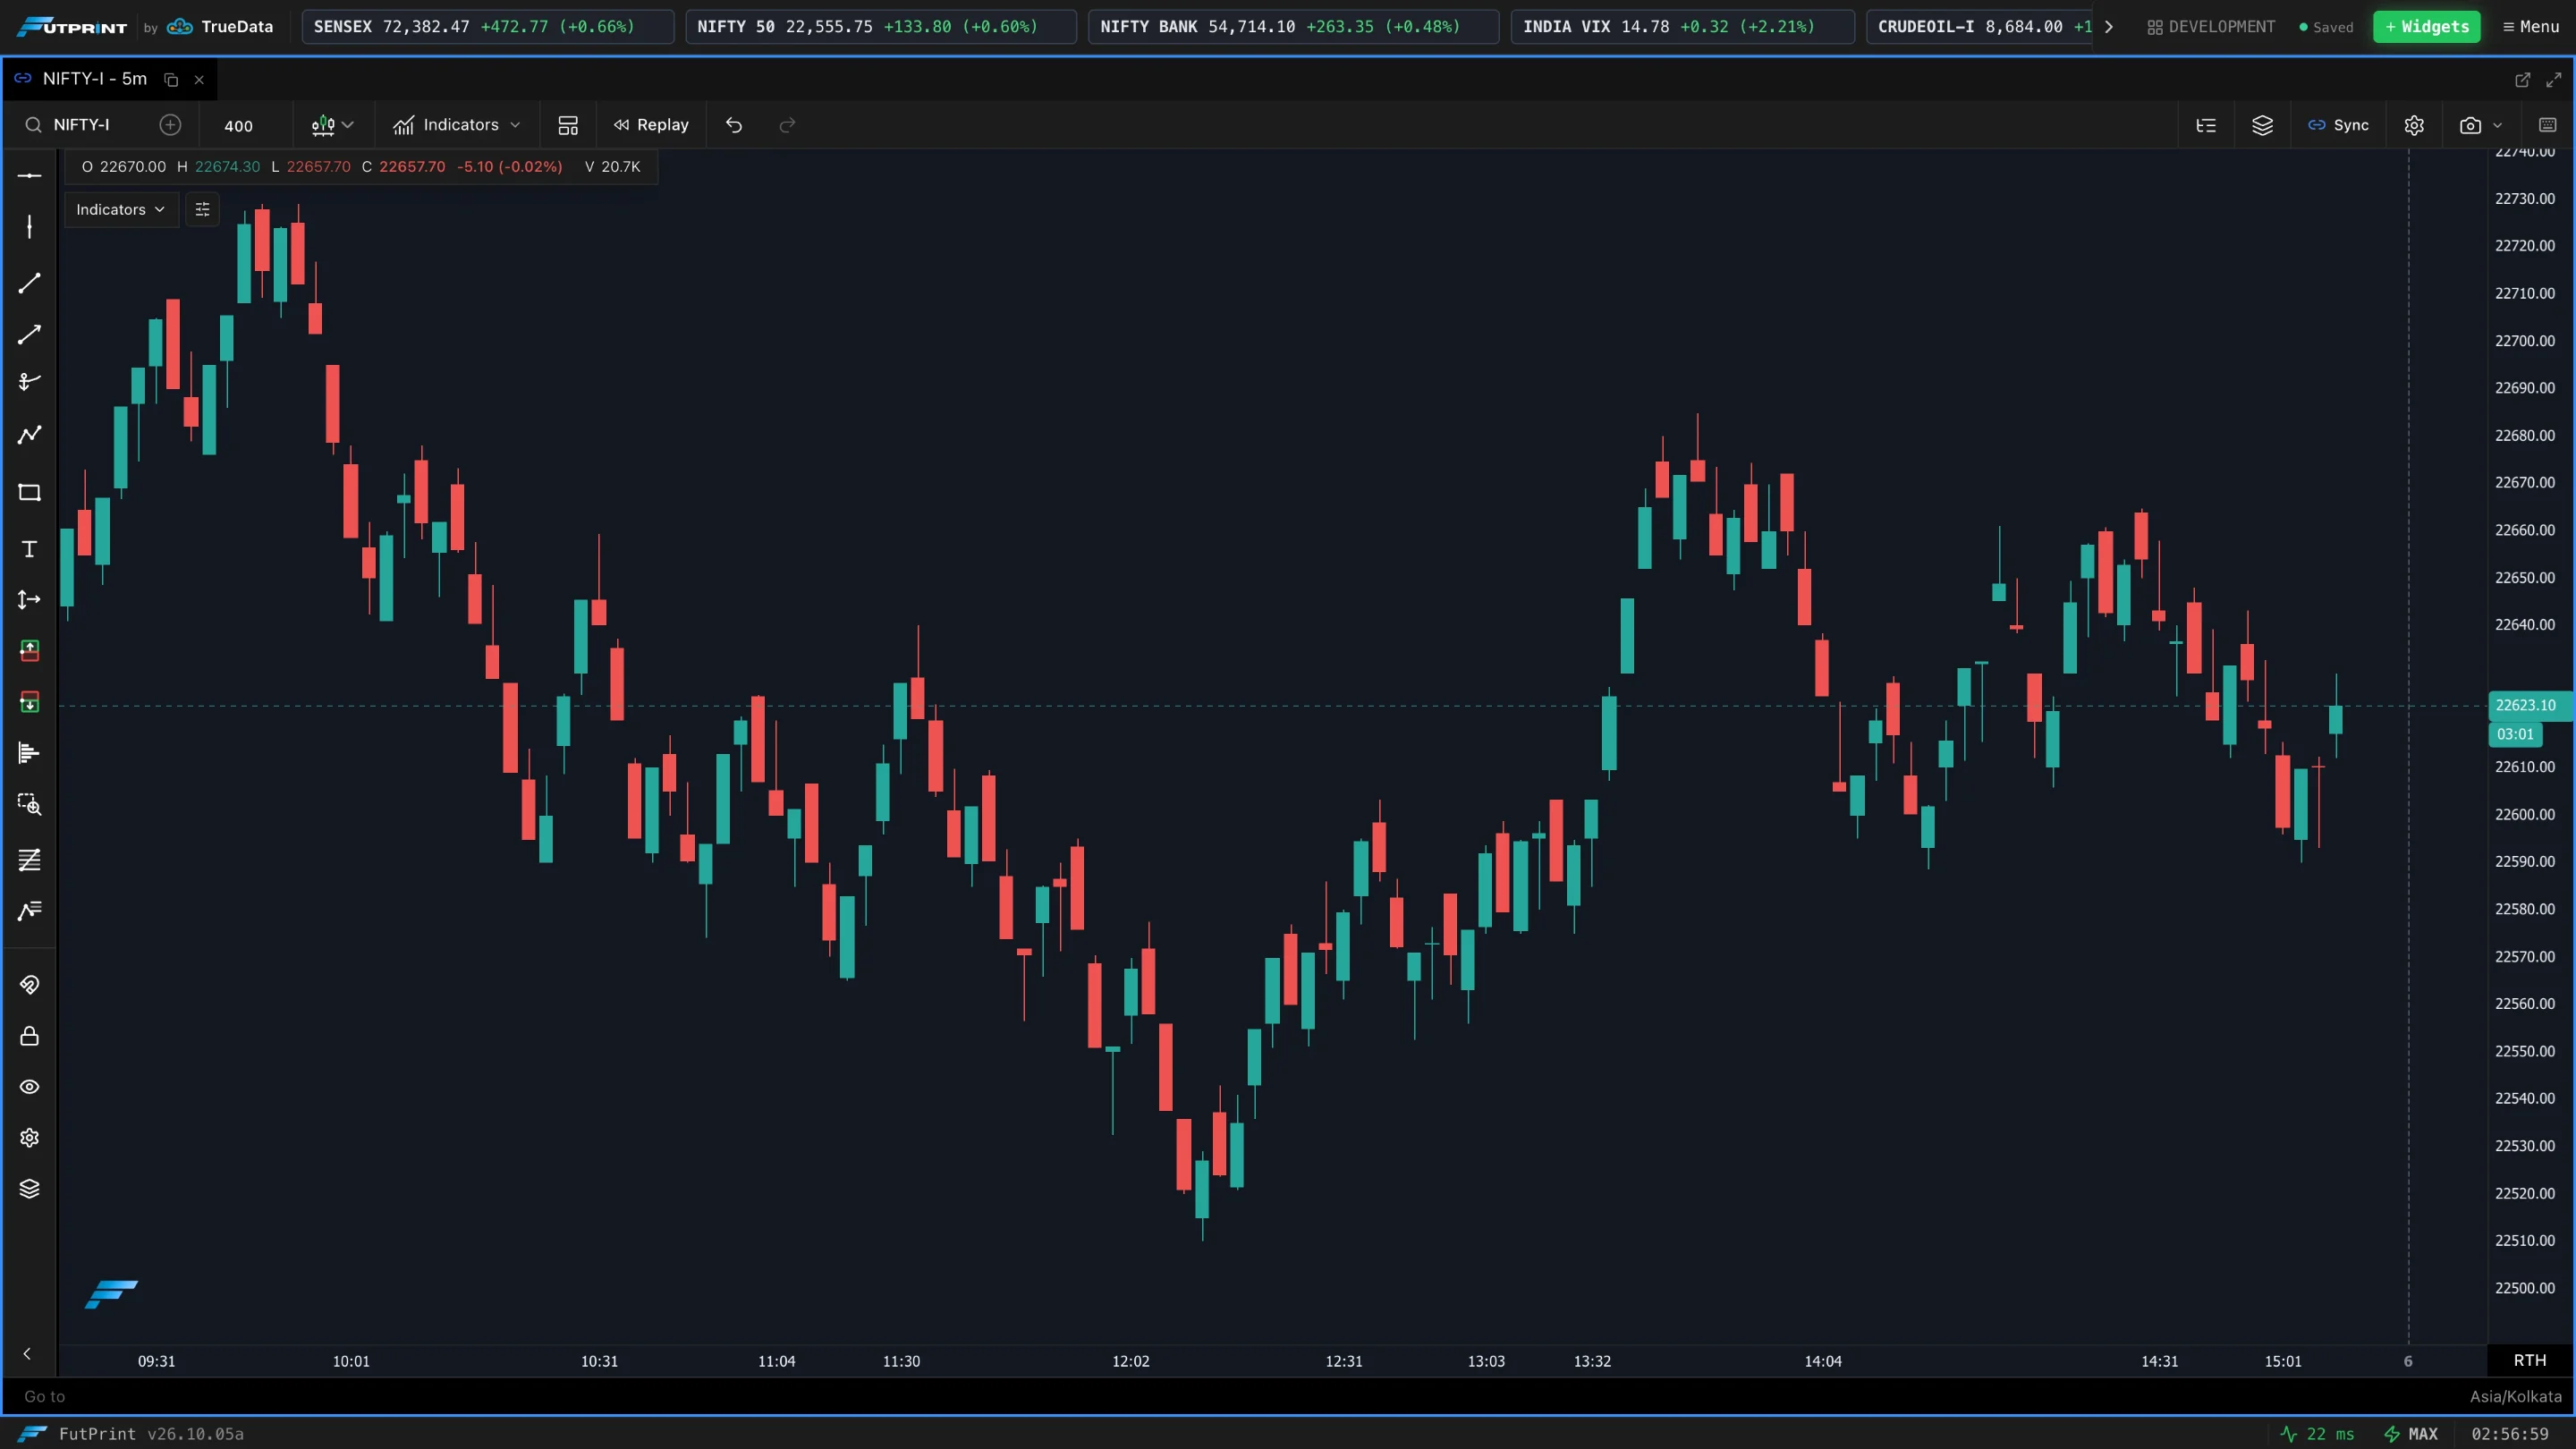
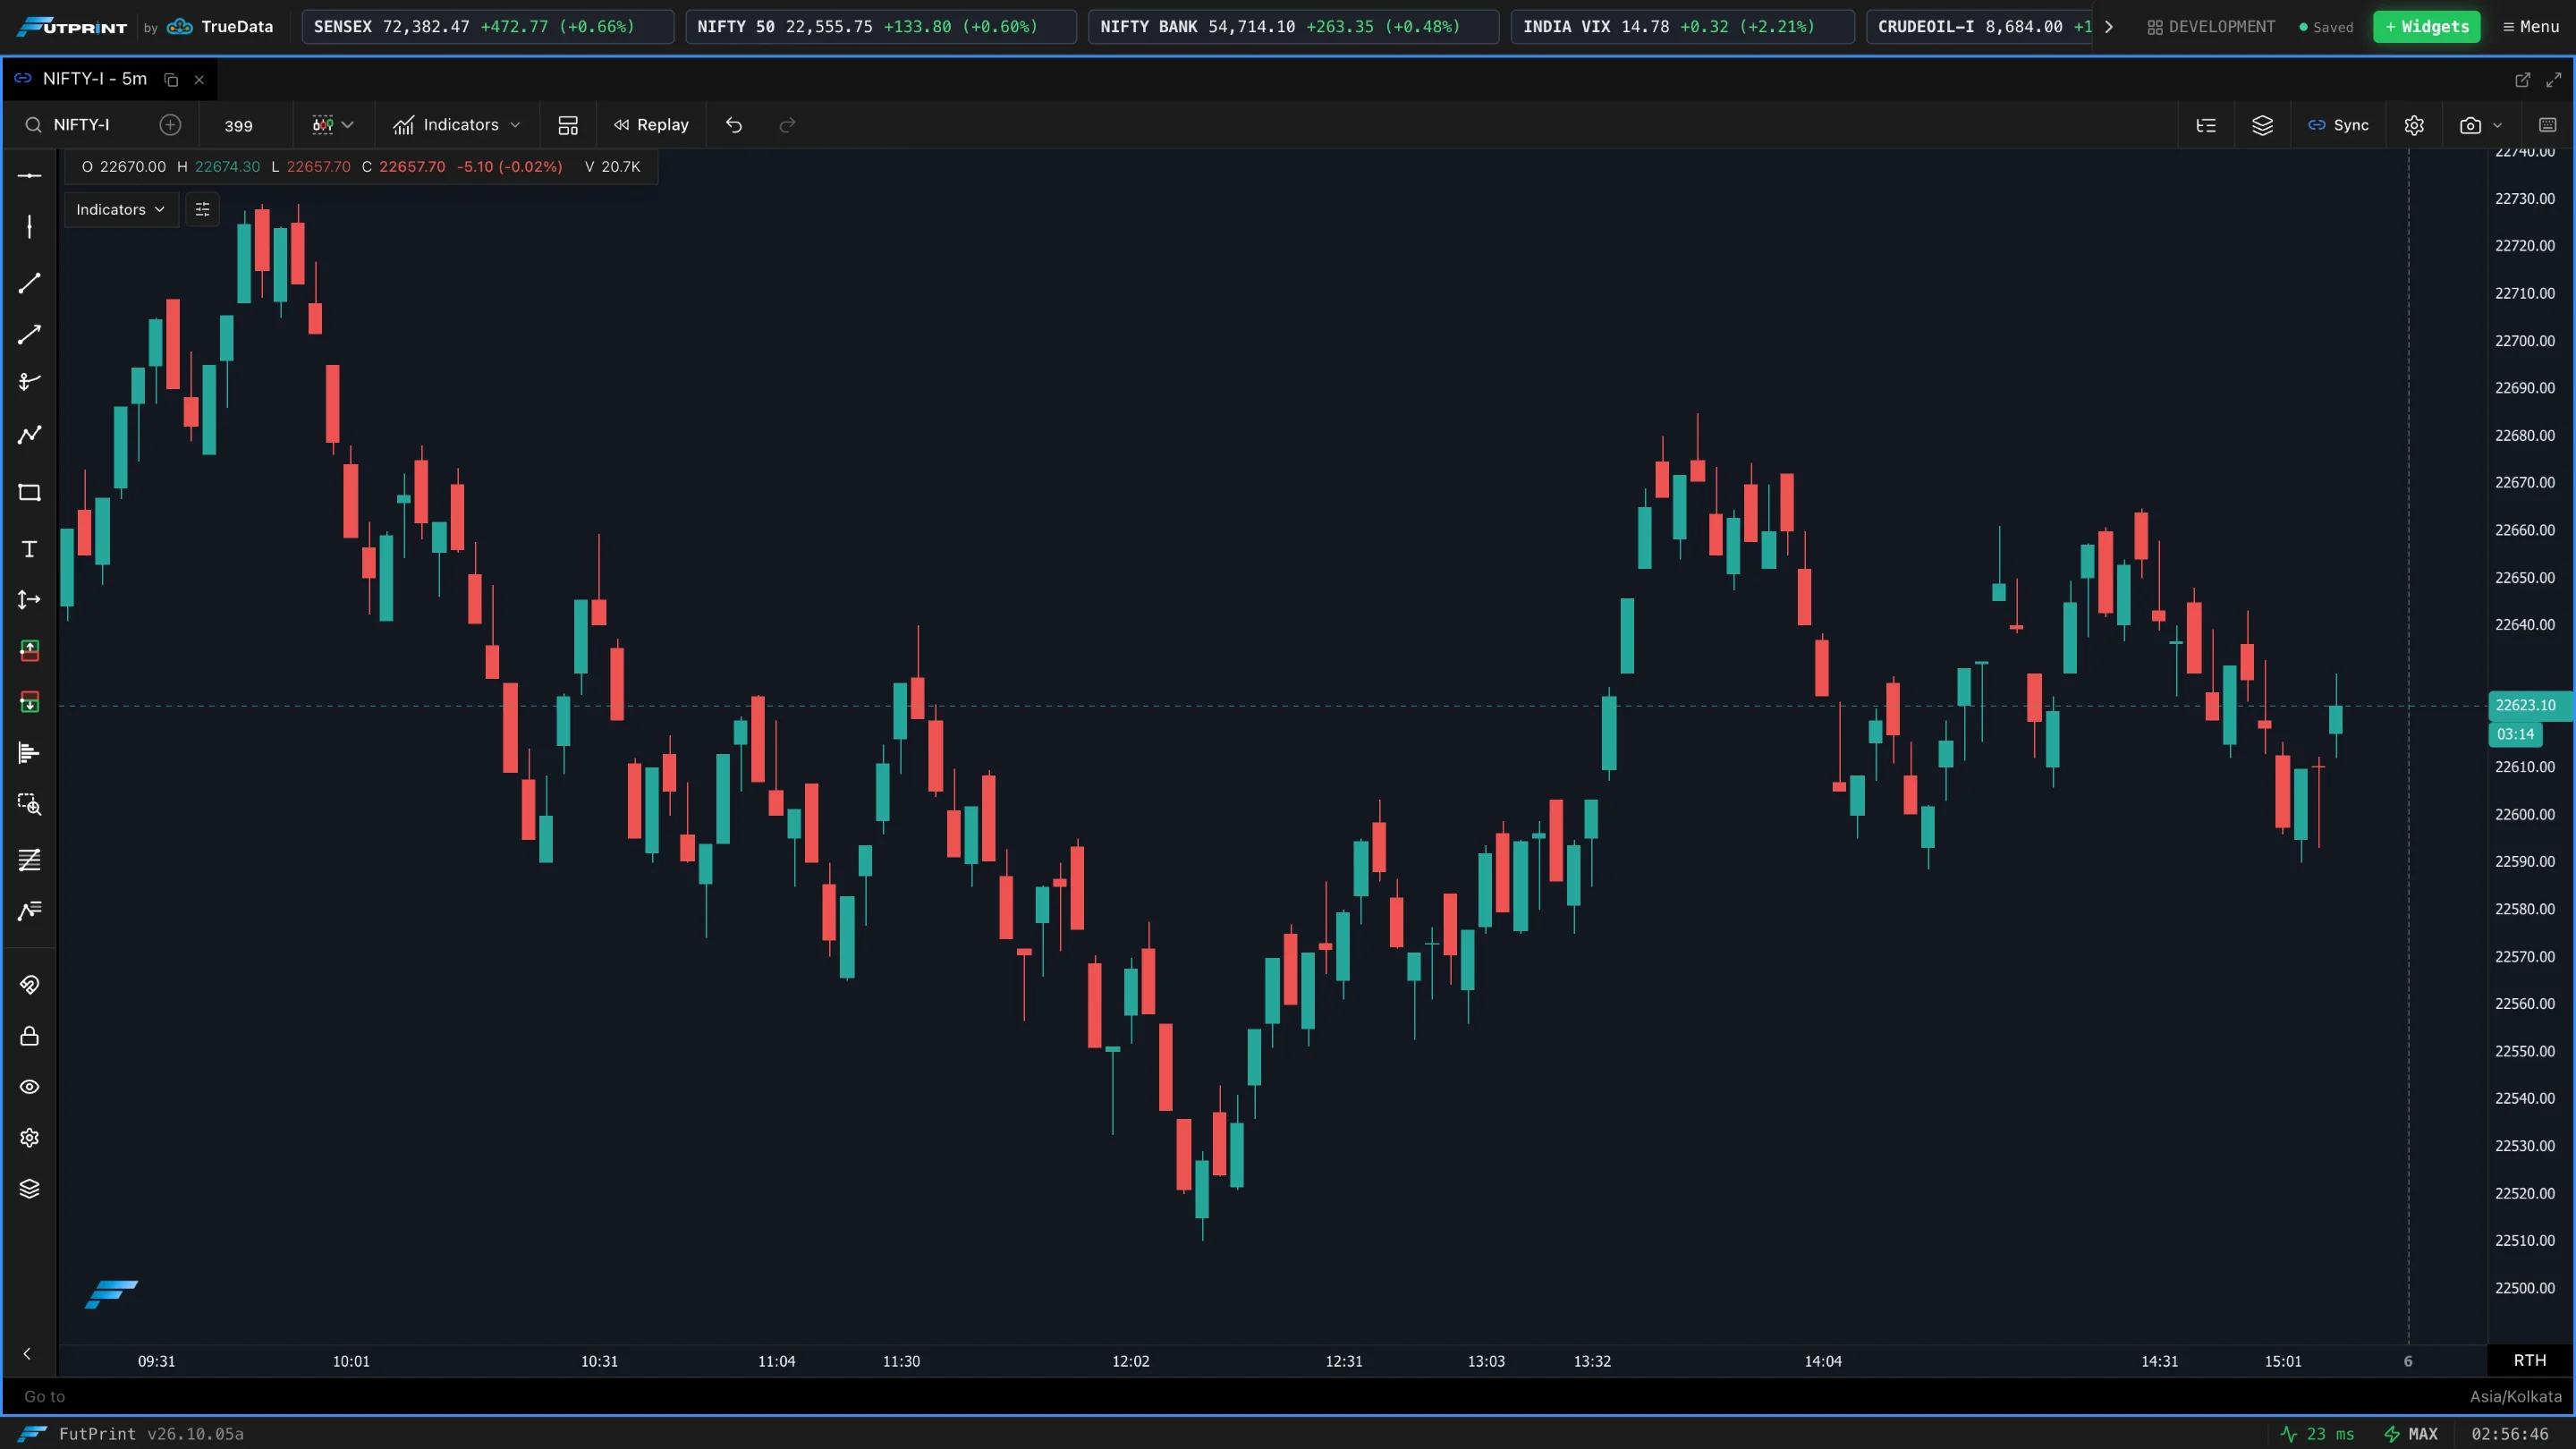
Two chart modes build bars from trades rather than the clock, so they ignore the timeframe selector and use their own input instead:
- Tick Number — a new bar every N trades. Set N in the Tick Count input that appears in the toolbar.
- Tick Range — a new bar each time price moves by a set amount. Set the amount in the Tick Range input.
These reveal activity that time-based bars smear together — bursts of trades print more bars; quiet periods print fewer. See Chart Types for how they compare to candlesticks and the other modes.

Jumping to a date
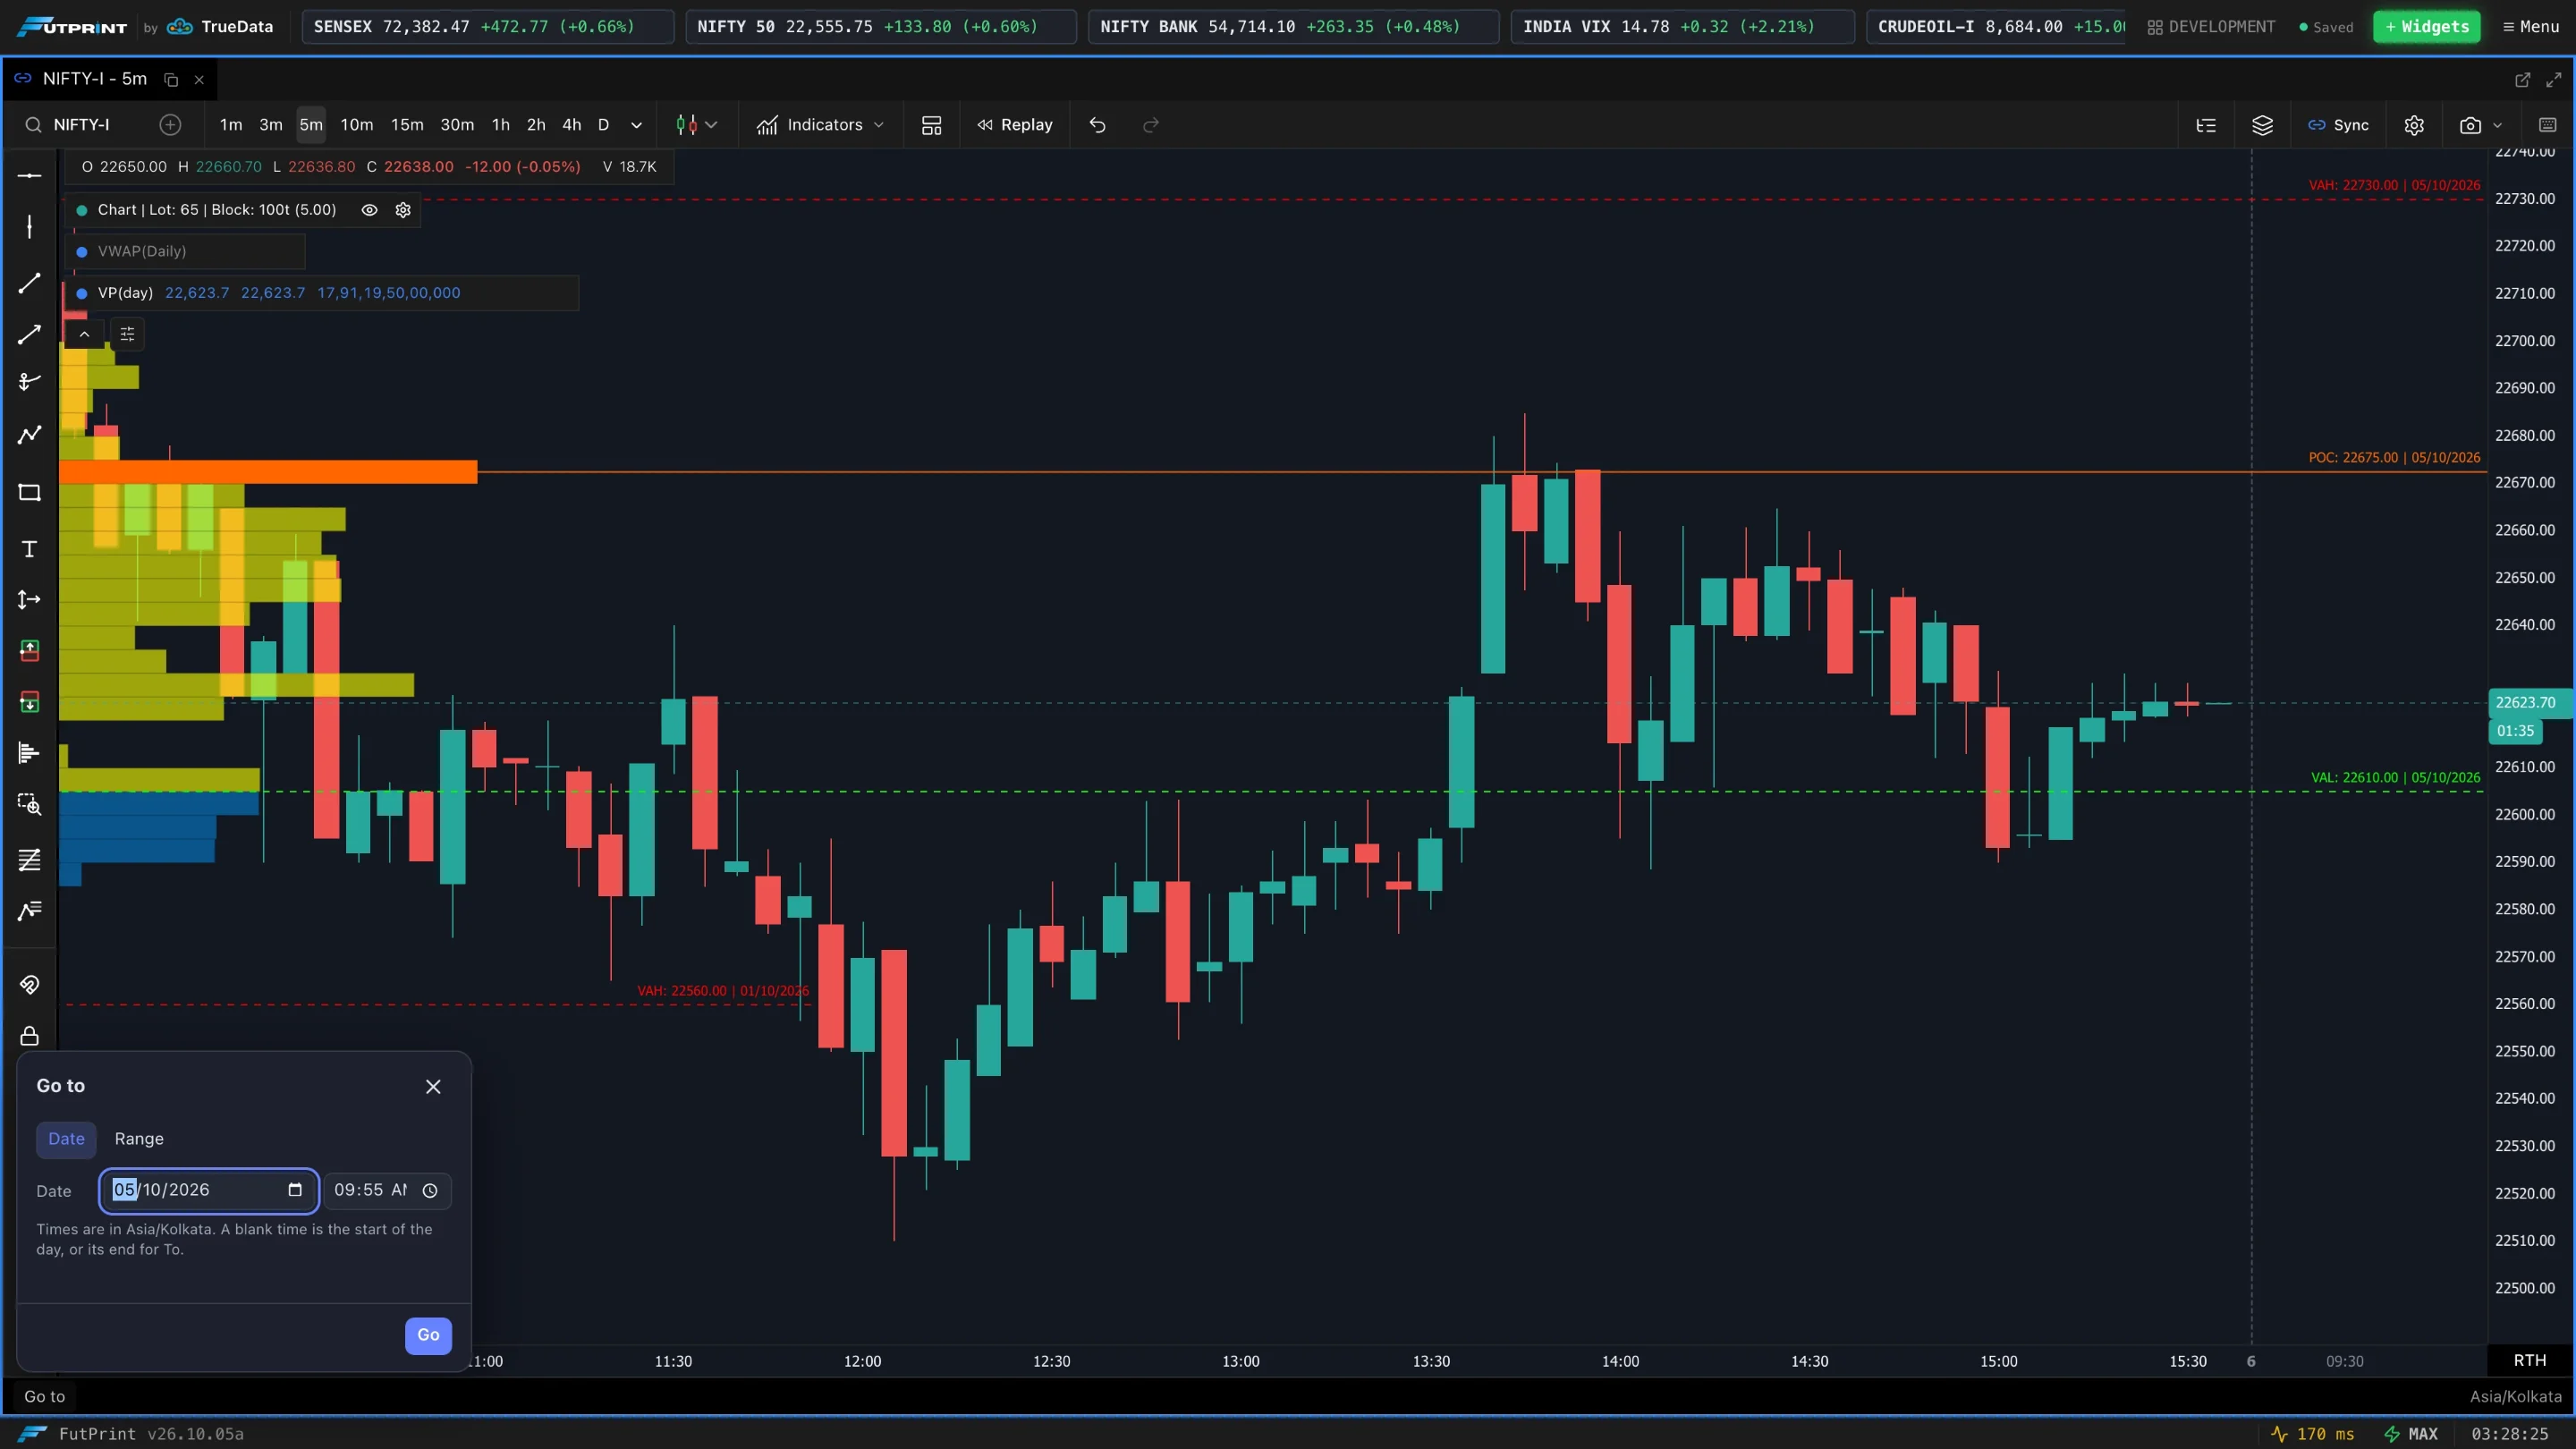
Go to at the bottom-left of the chart moves the view to a date and time, or to a range between two dates. Times are in the exchange's timezone.
The on-chart controls that appear when you hover the bottom of the chart — Pan left / right, Zoom out / in, Reset view and Go to latest — move the view without changing the symbol or timeframe.