
 by TrueData
See the market
beneath the price.
Order flow, options intelligence and market context.
Connected in a workspace built around the way you trade.

1 year of empowering Indian traders.
And we’re only getting started.
From 3 modules to 21. From launch to a community of over 5,000 users.
Thank you for being part of the journey.
Everything you see.
Working together.
Follow a symbol from market overview to the activity inside a candle. Keep the chain, the chart and your context within reach.
Look closer.
There’s more
to the move.
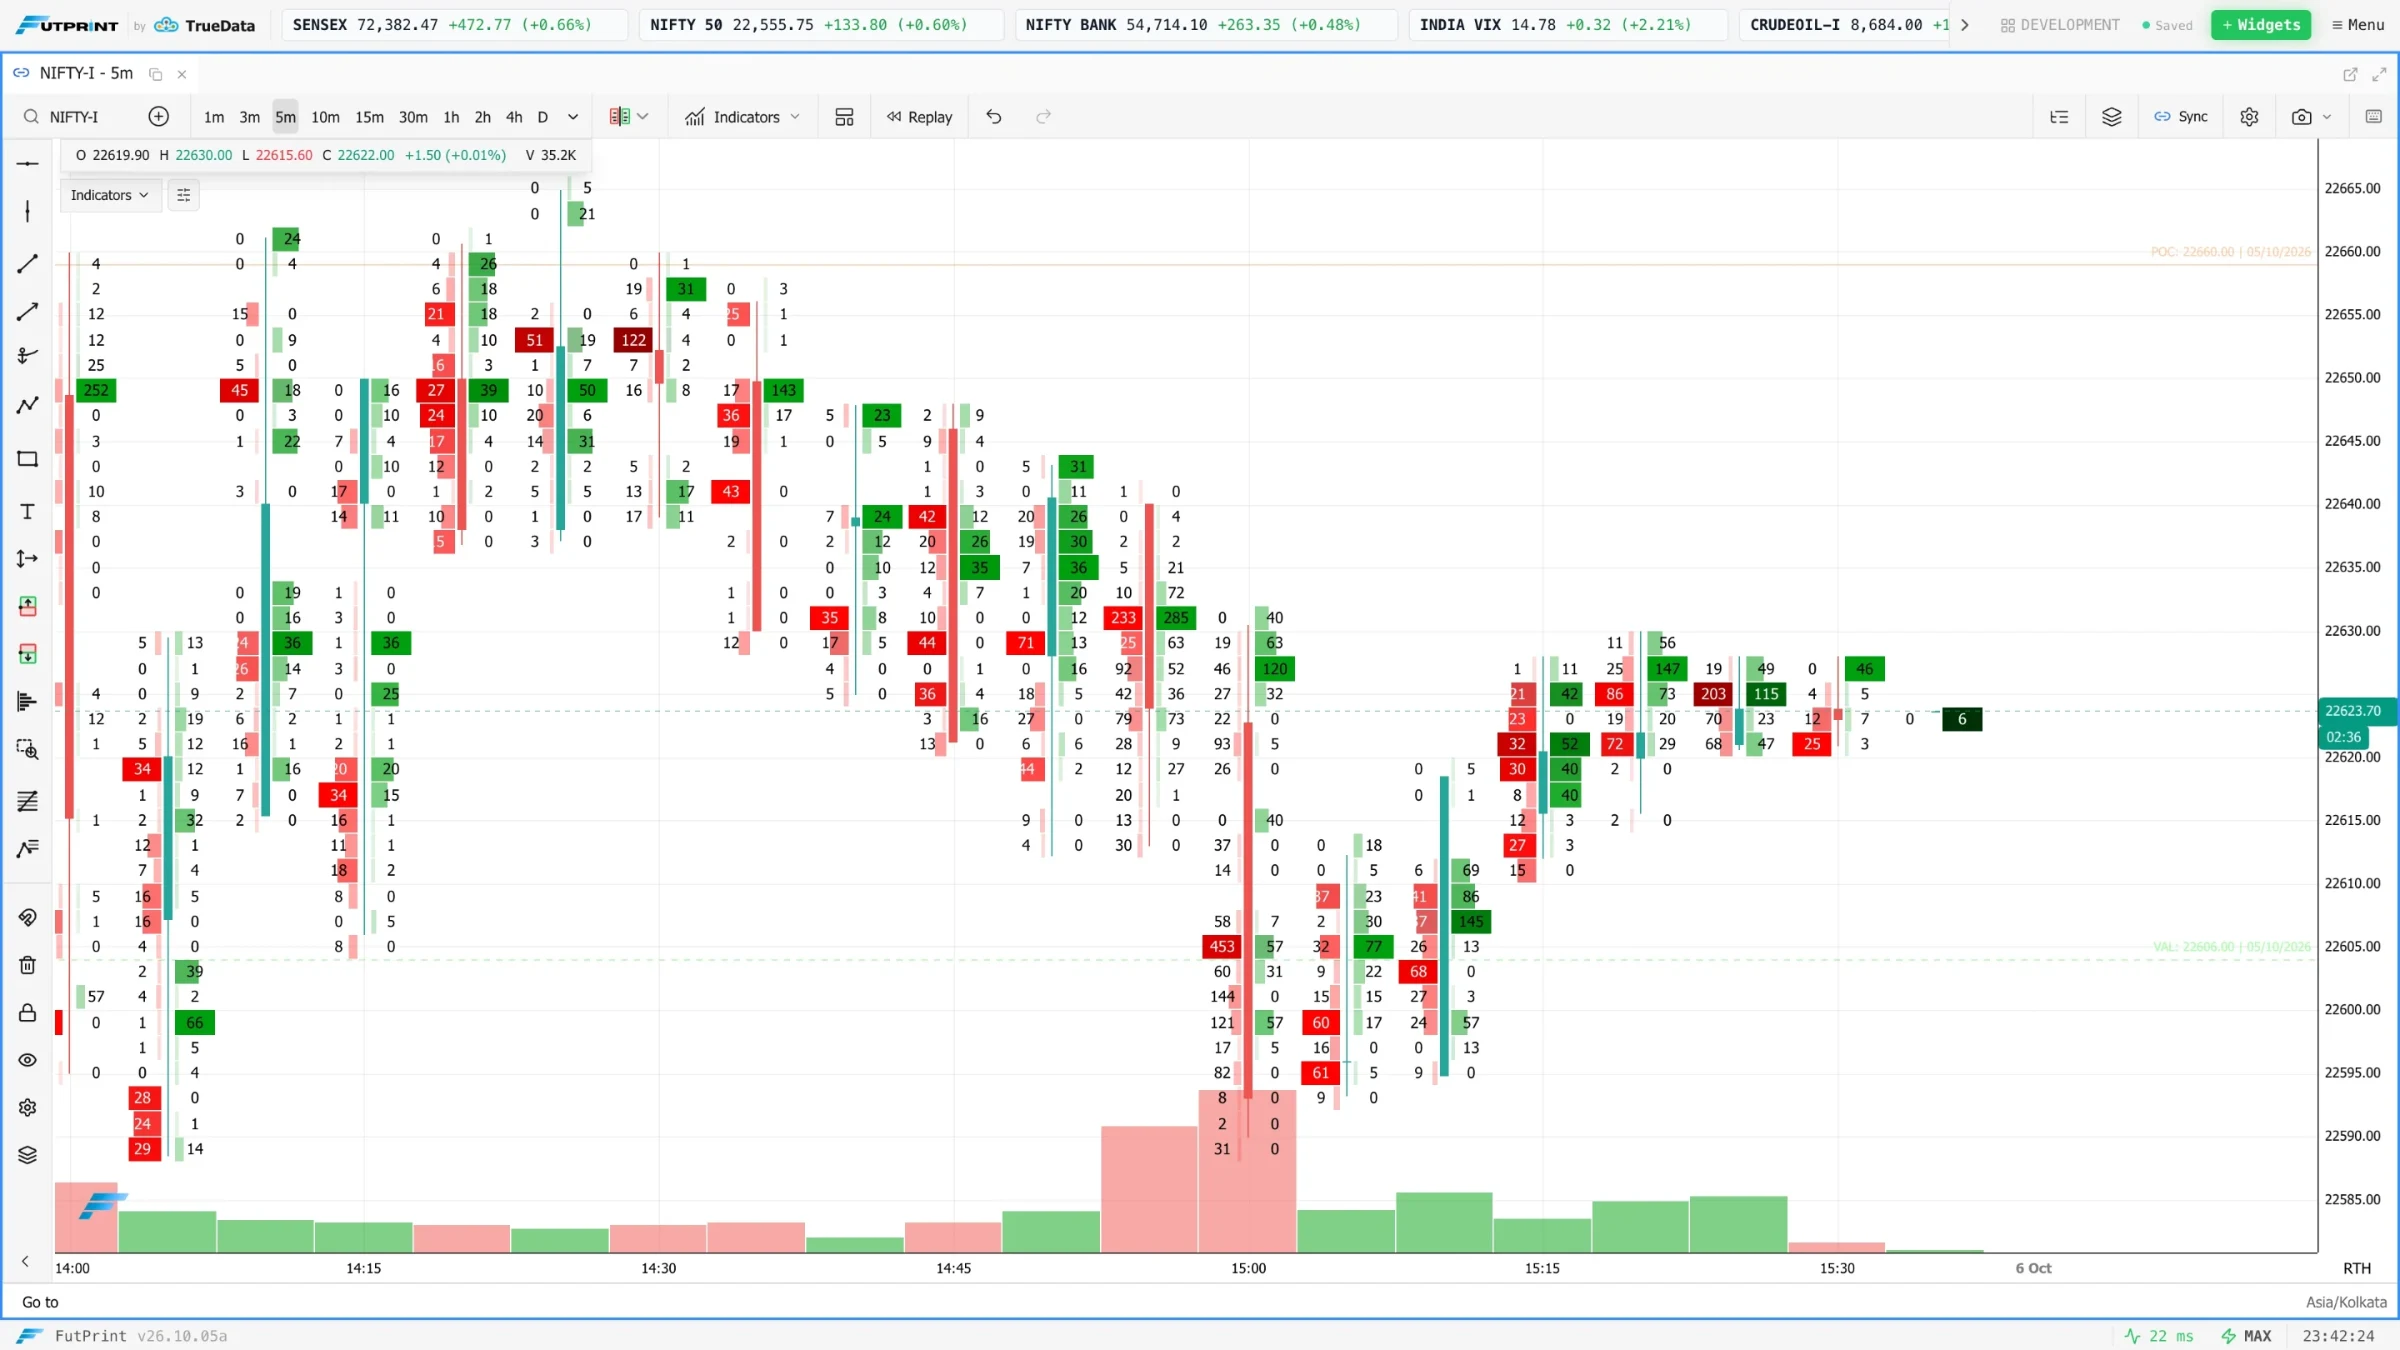
A price bar tells you where the market moved. A footprint adds the participation inside it: bid and ask volume, delta and imbalances at each level.
Discover order flowMore volume traded on the ask side in this example. Compare it with price movement and nearby structure.
Illustrative data · educational diagramMore ways
to read the market.
Go deep in one discipline. Connect it to the next. Build a process that is yours.
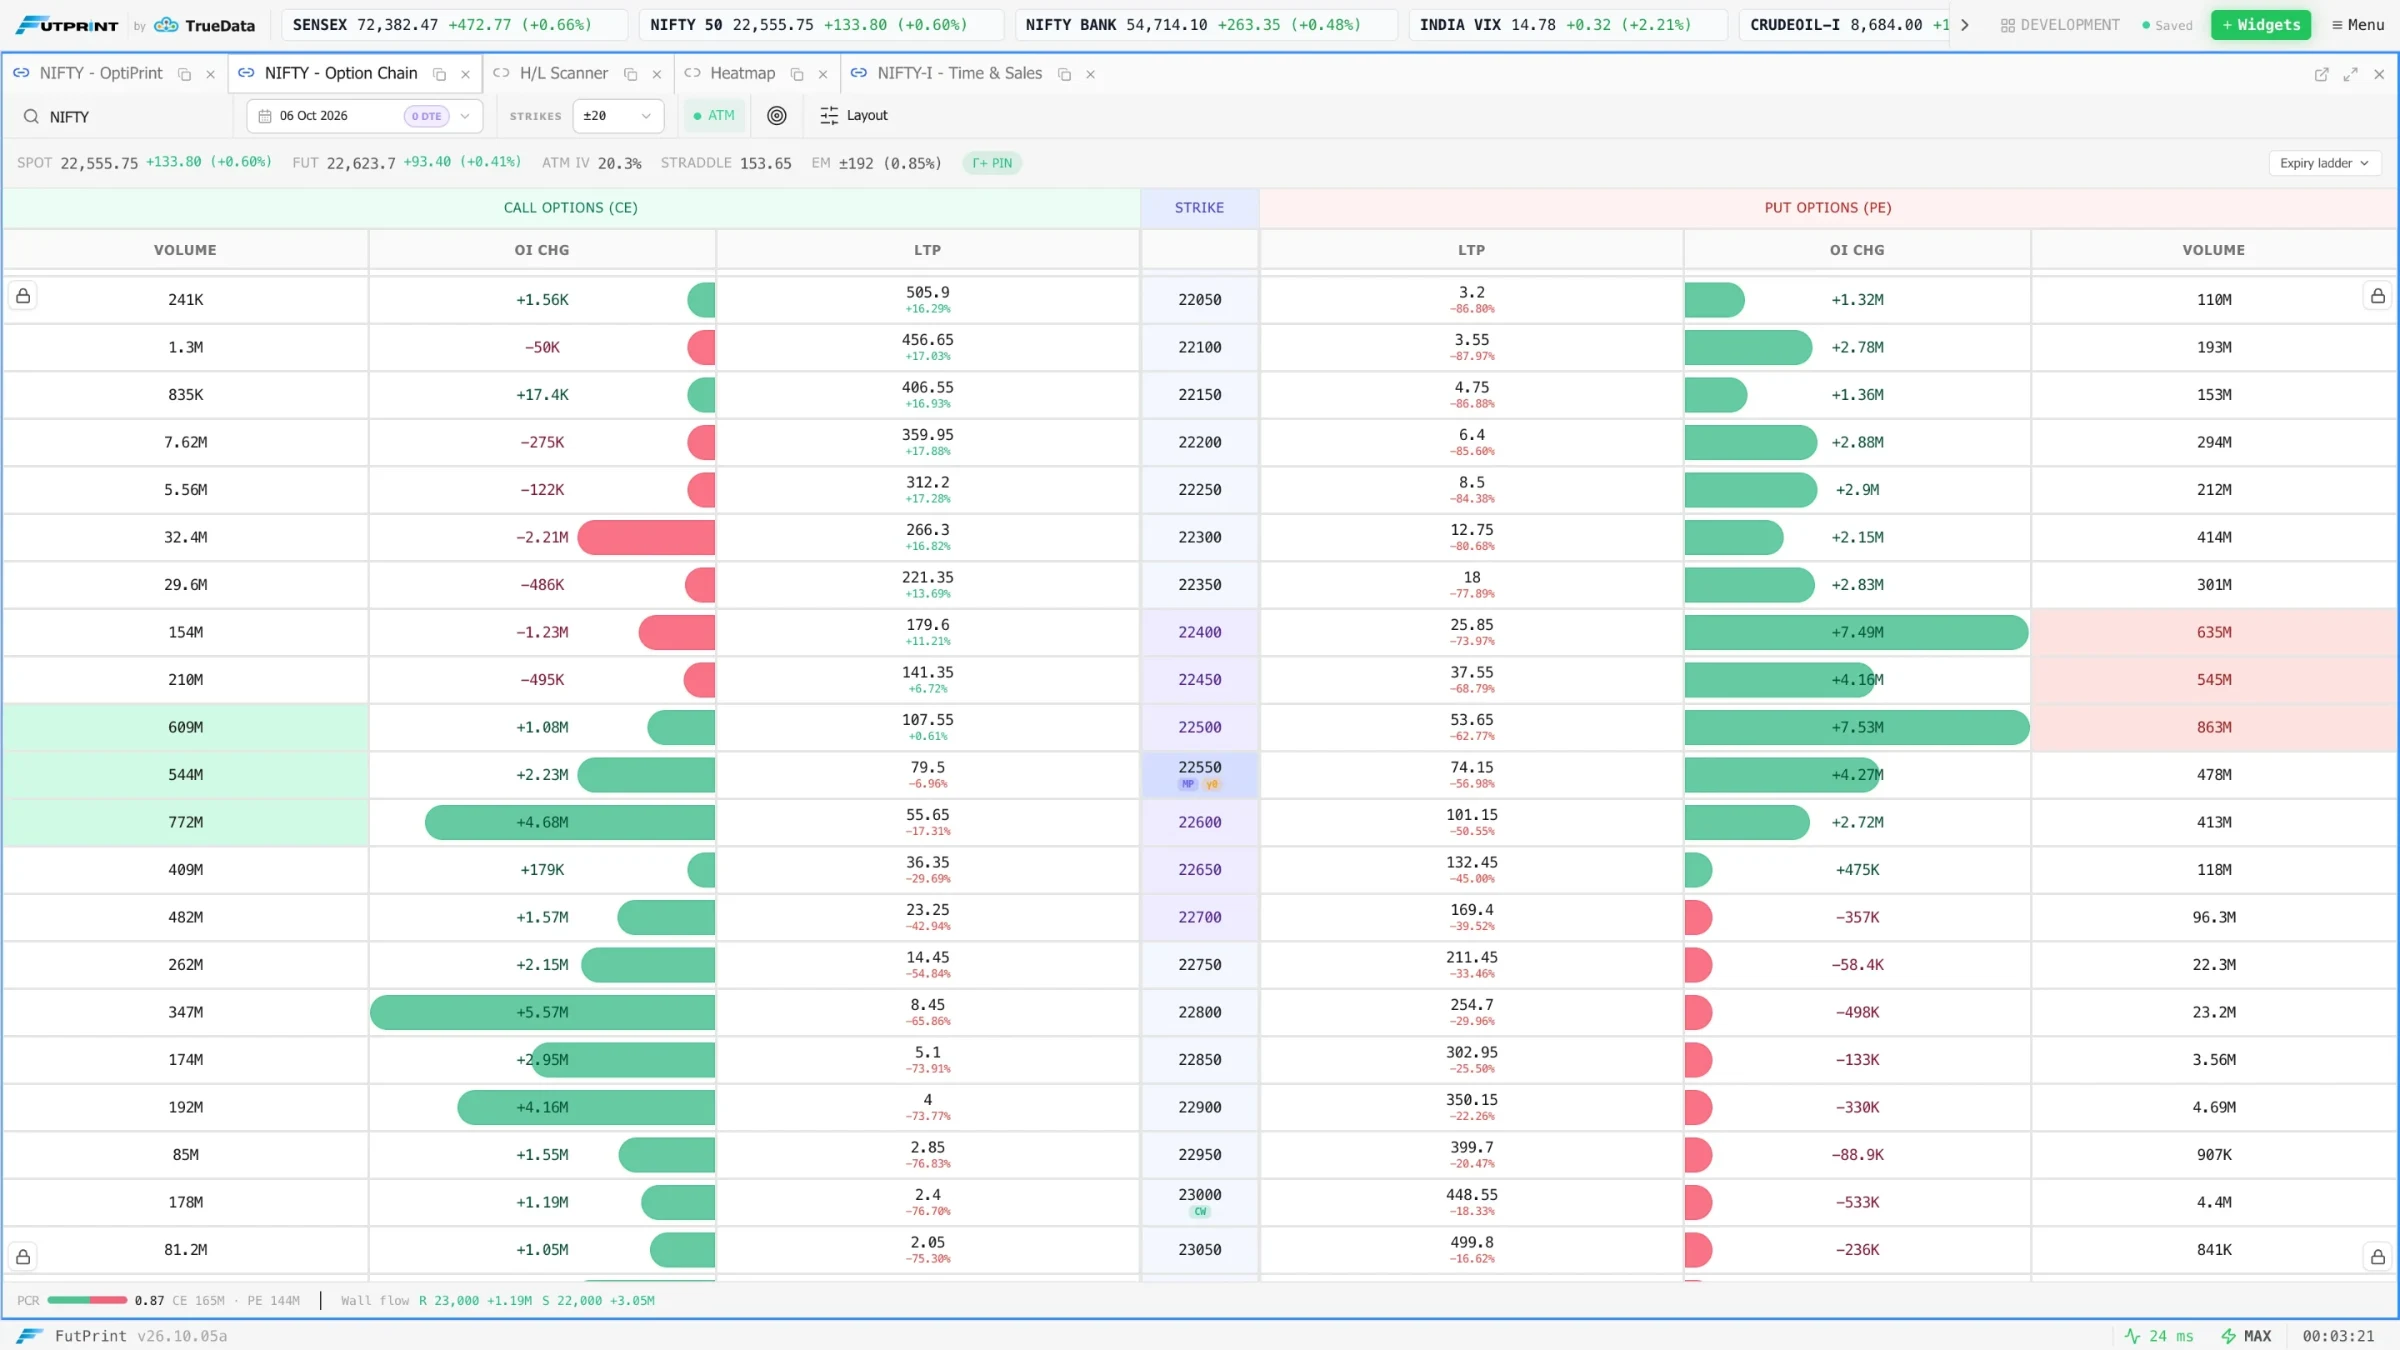
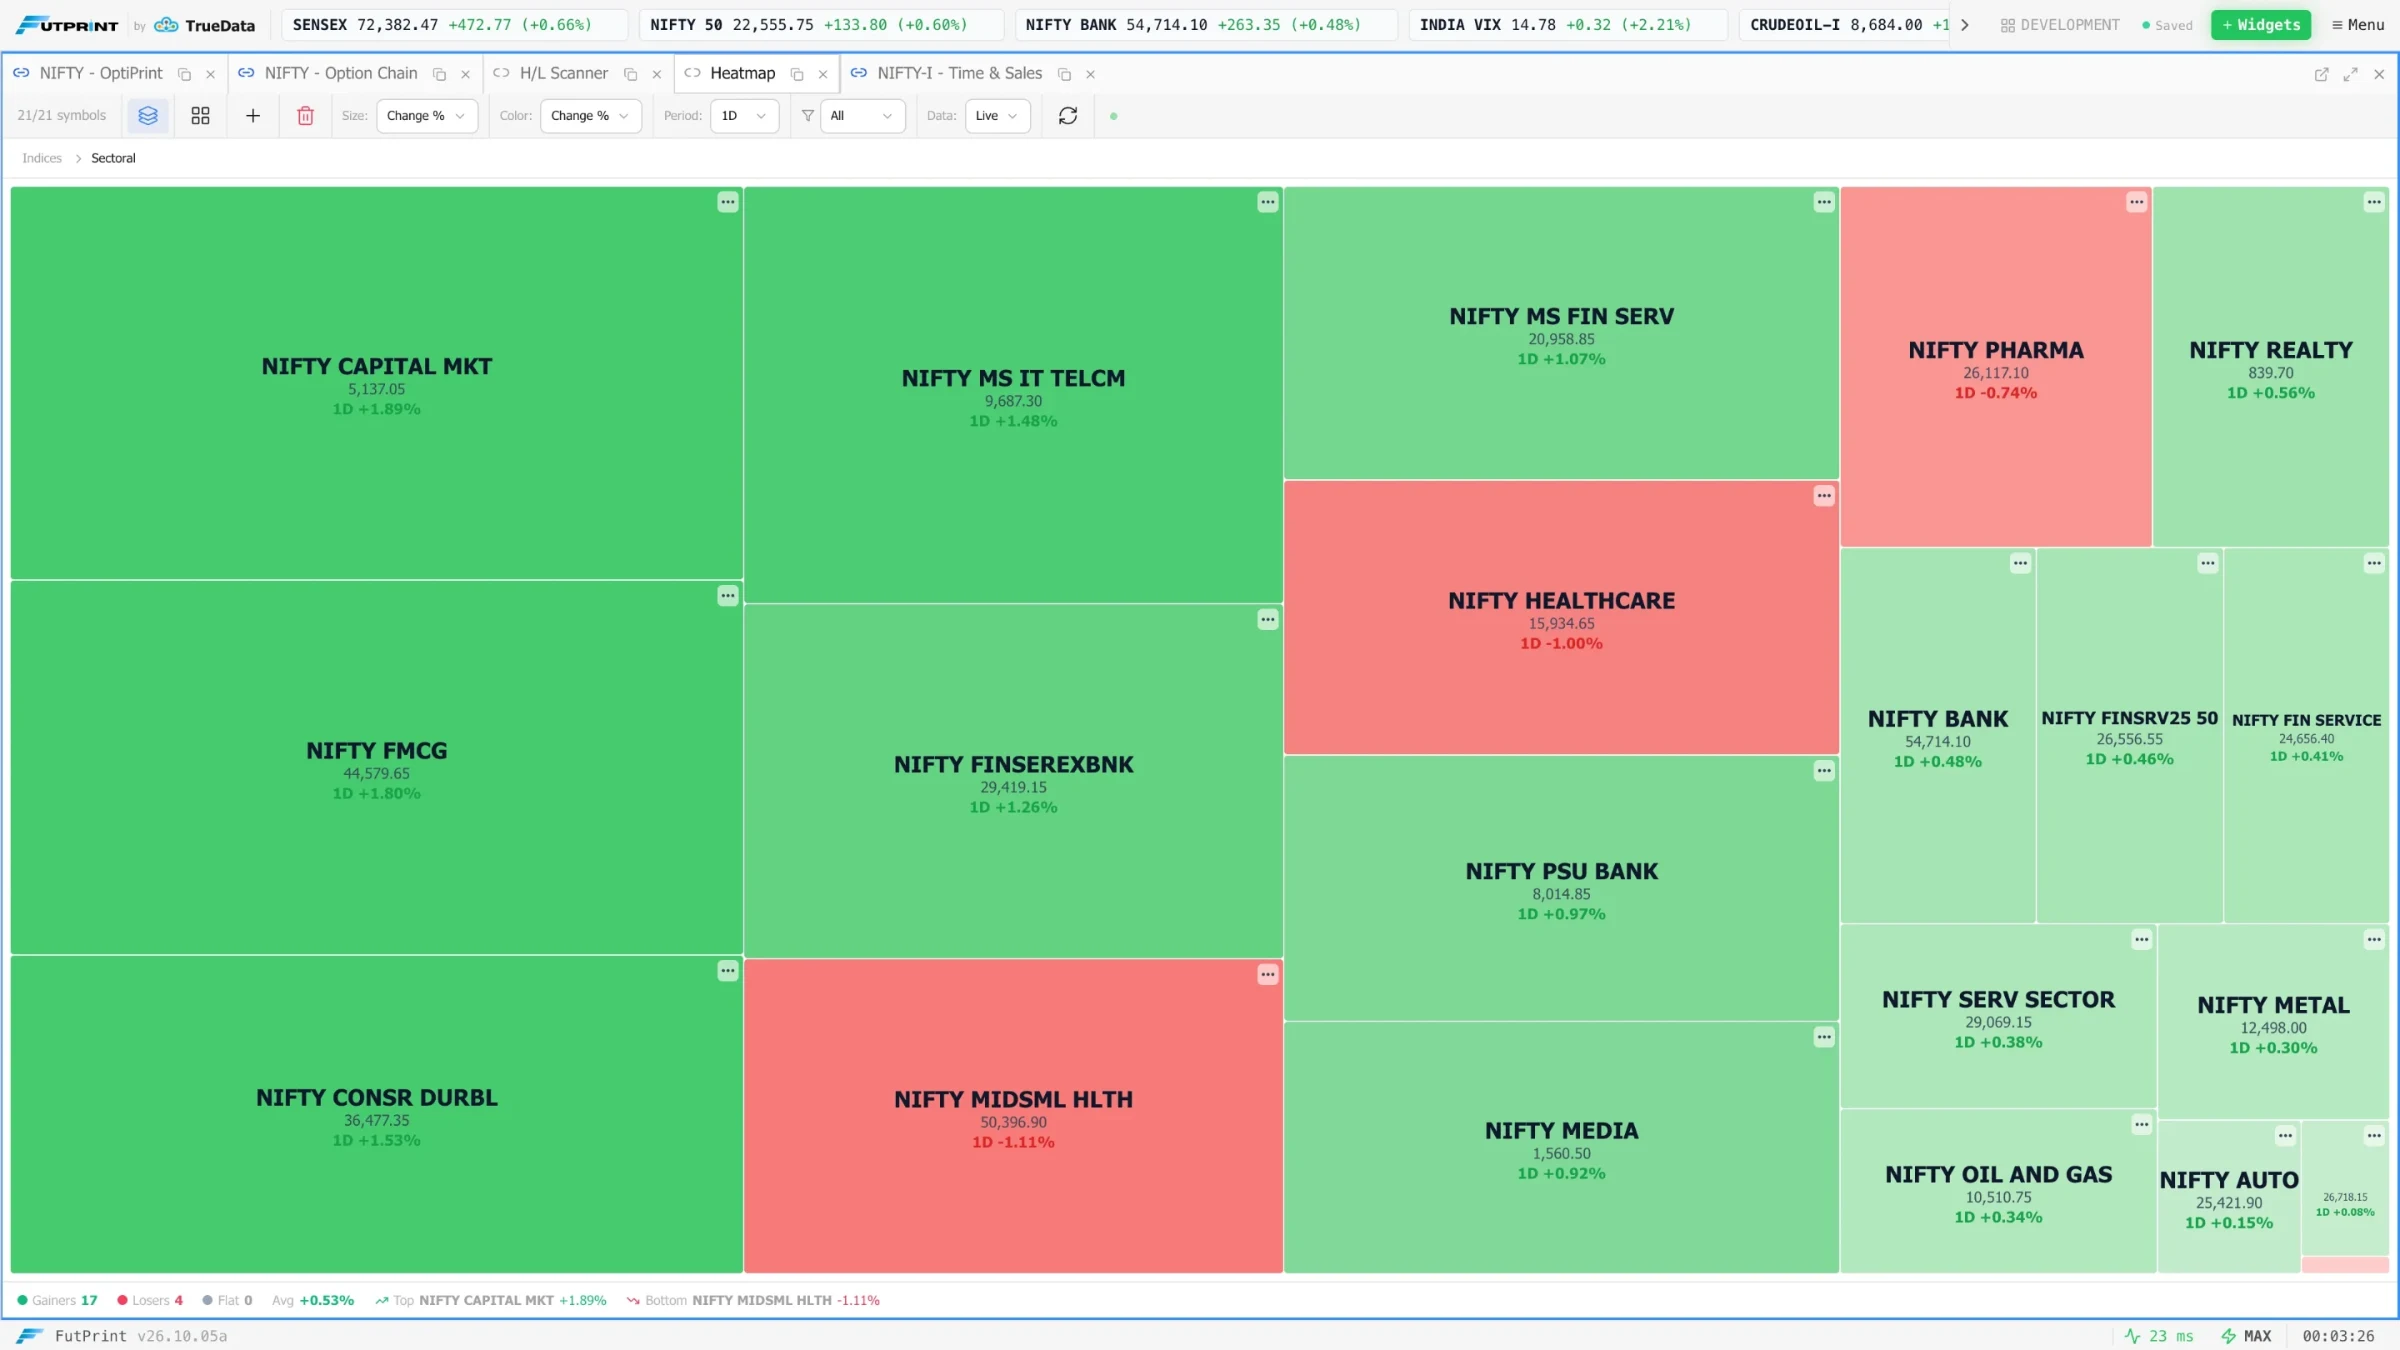
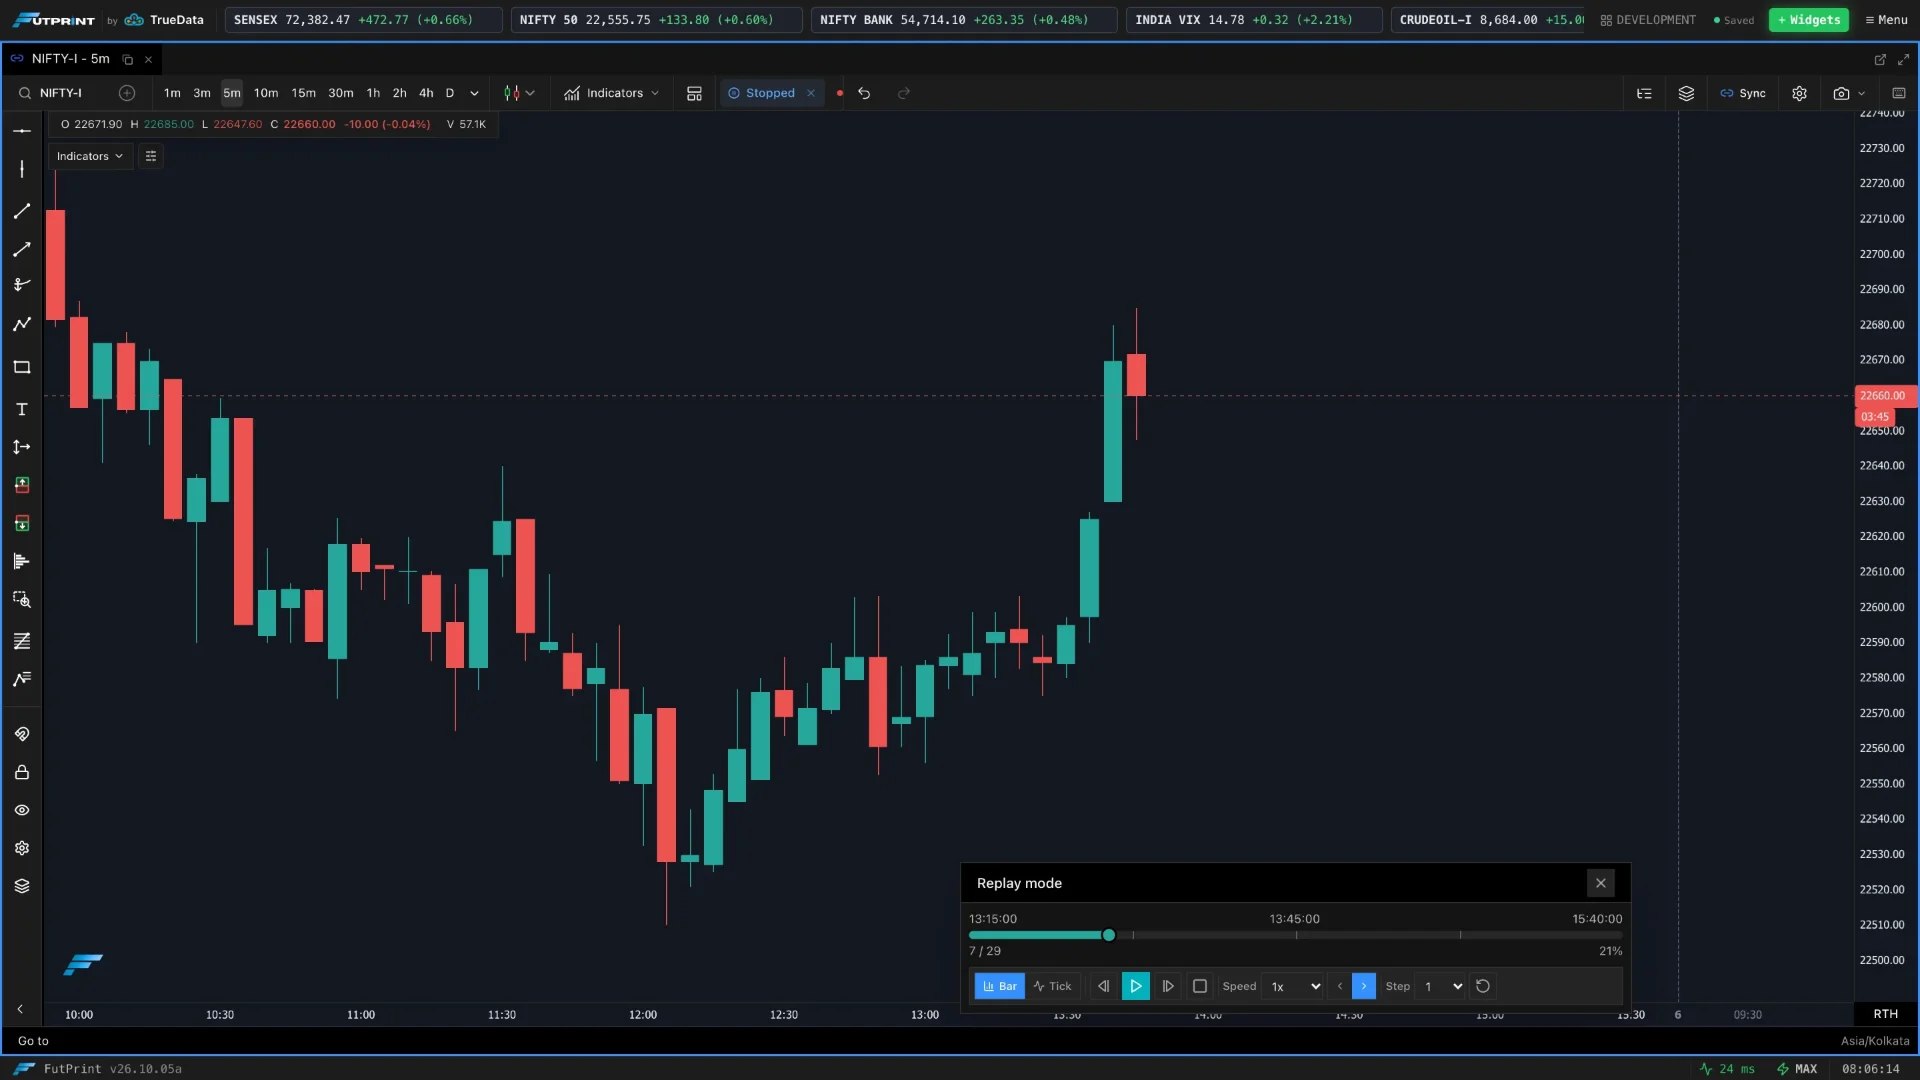
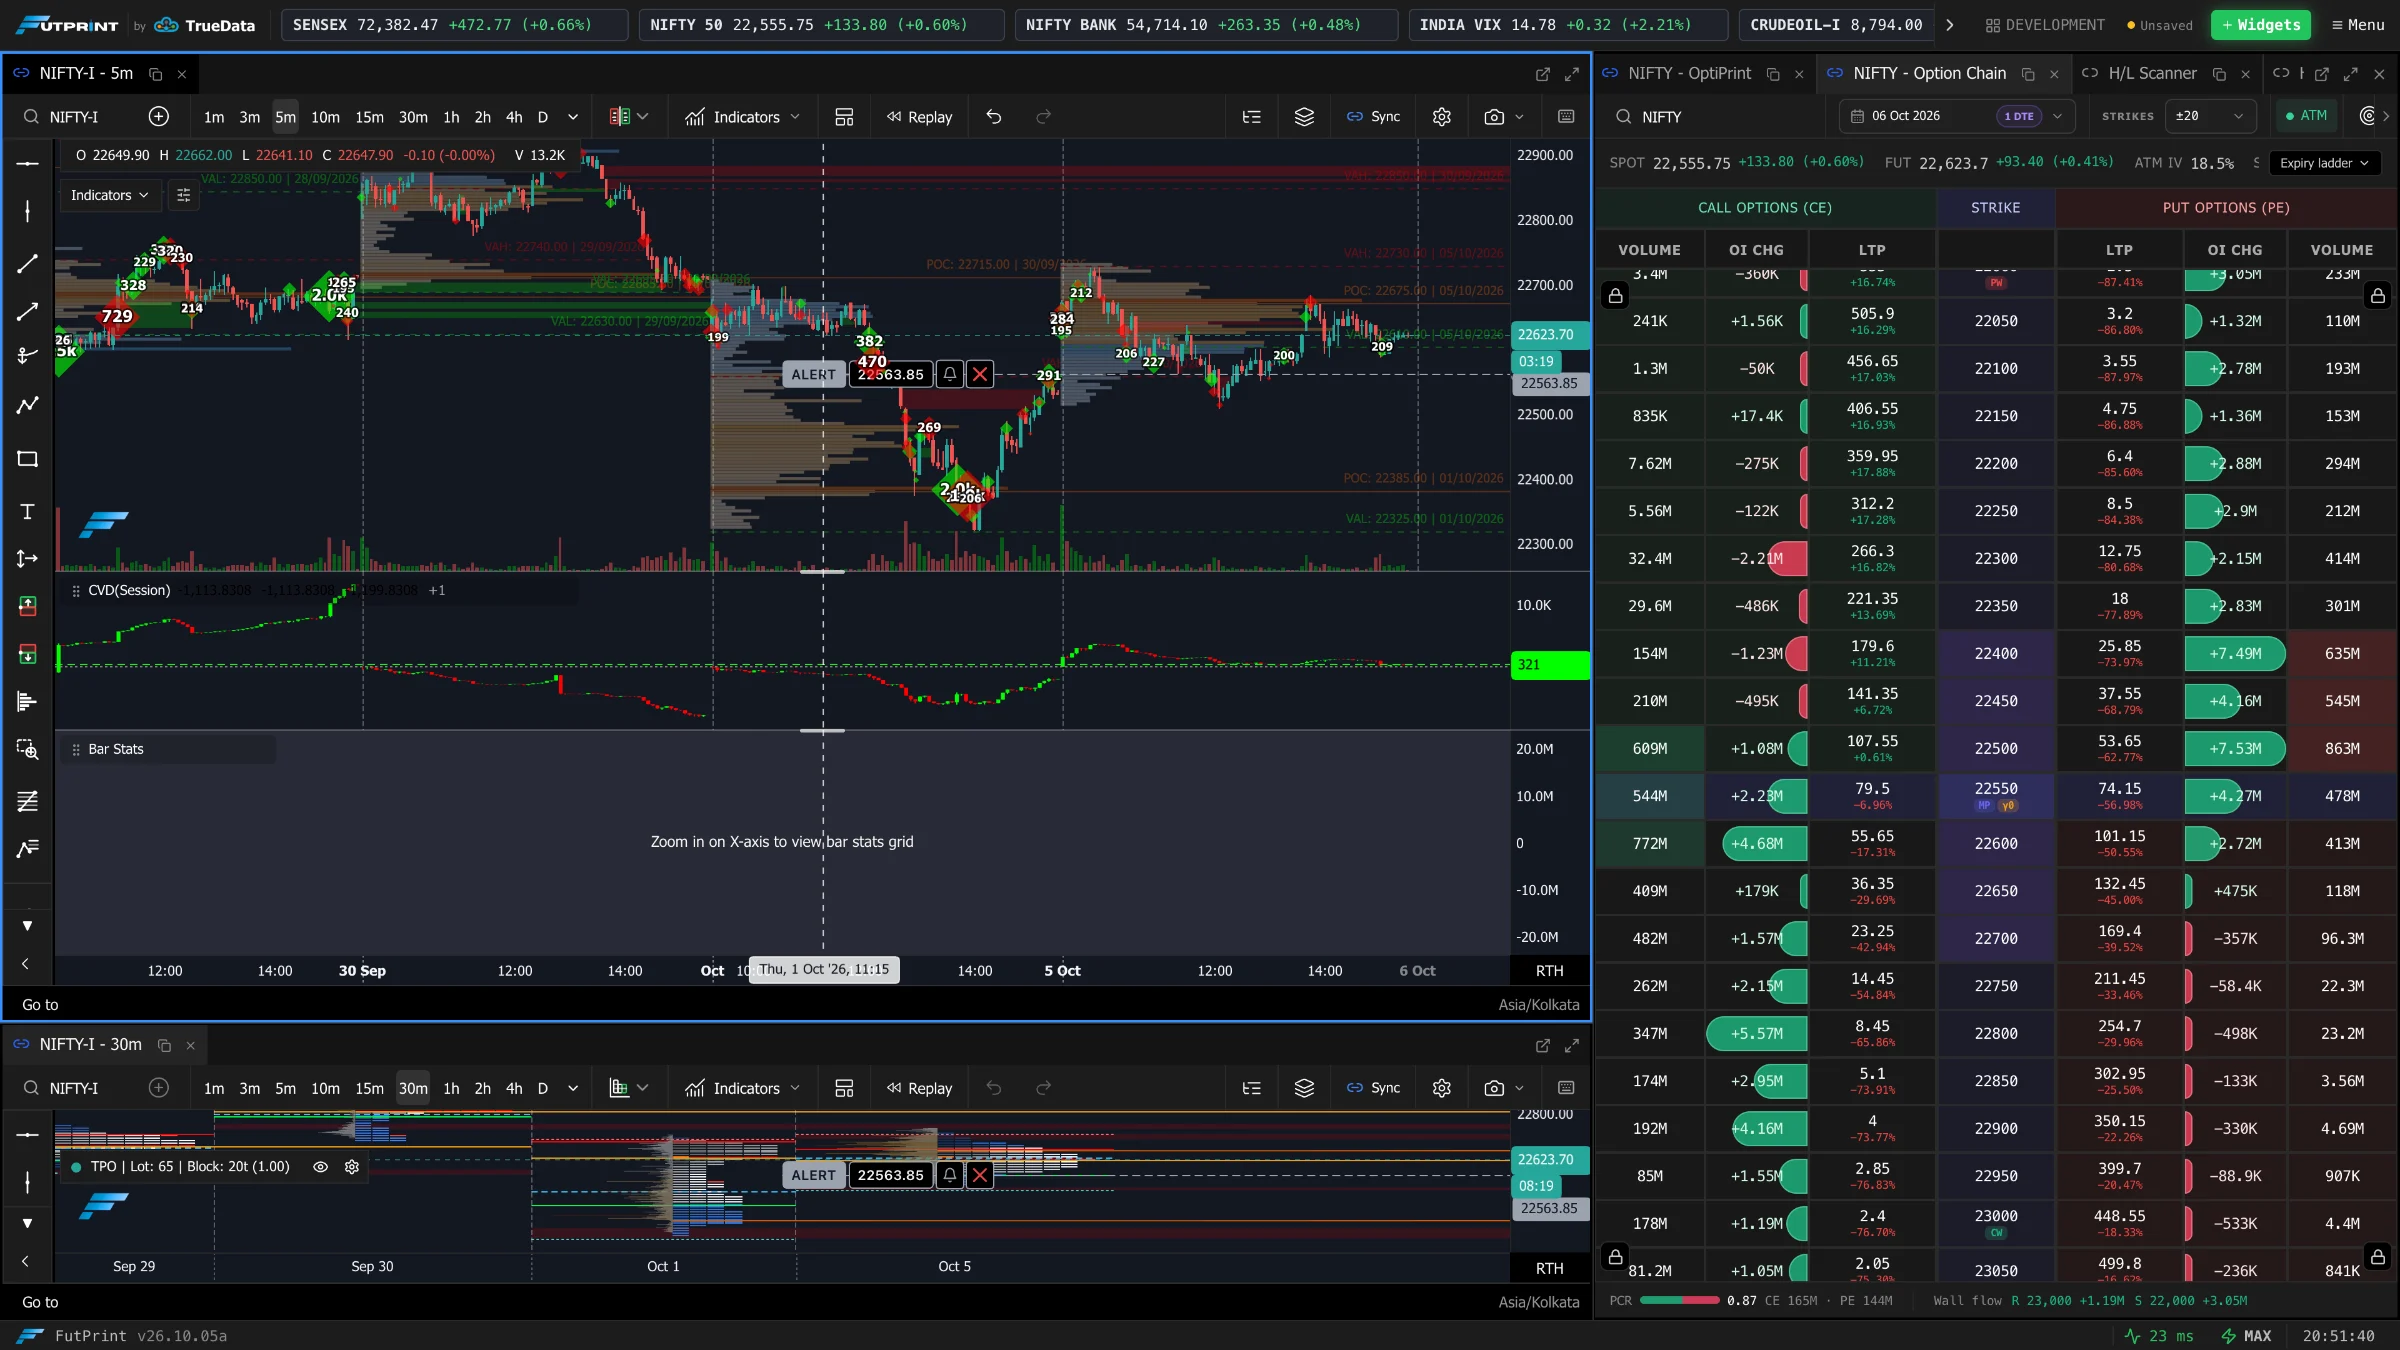
Real detail.
At every scale.
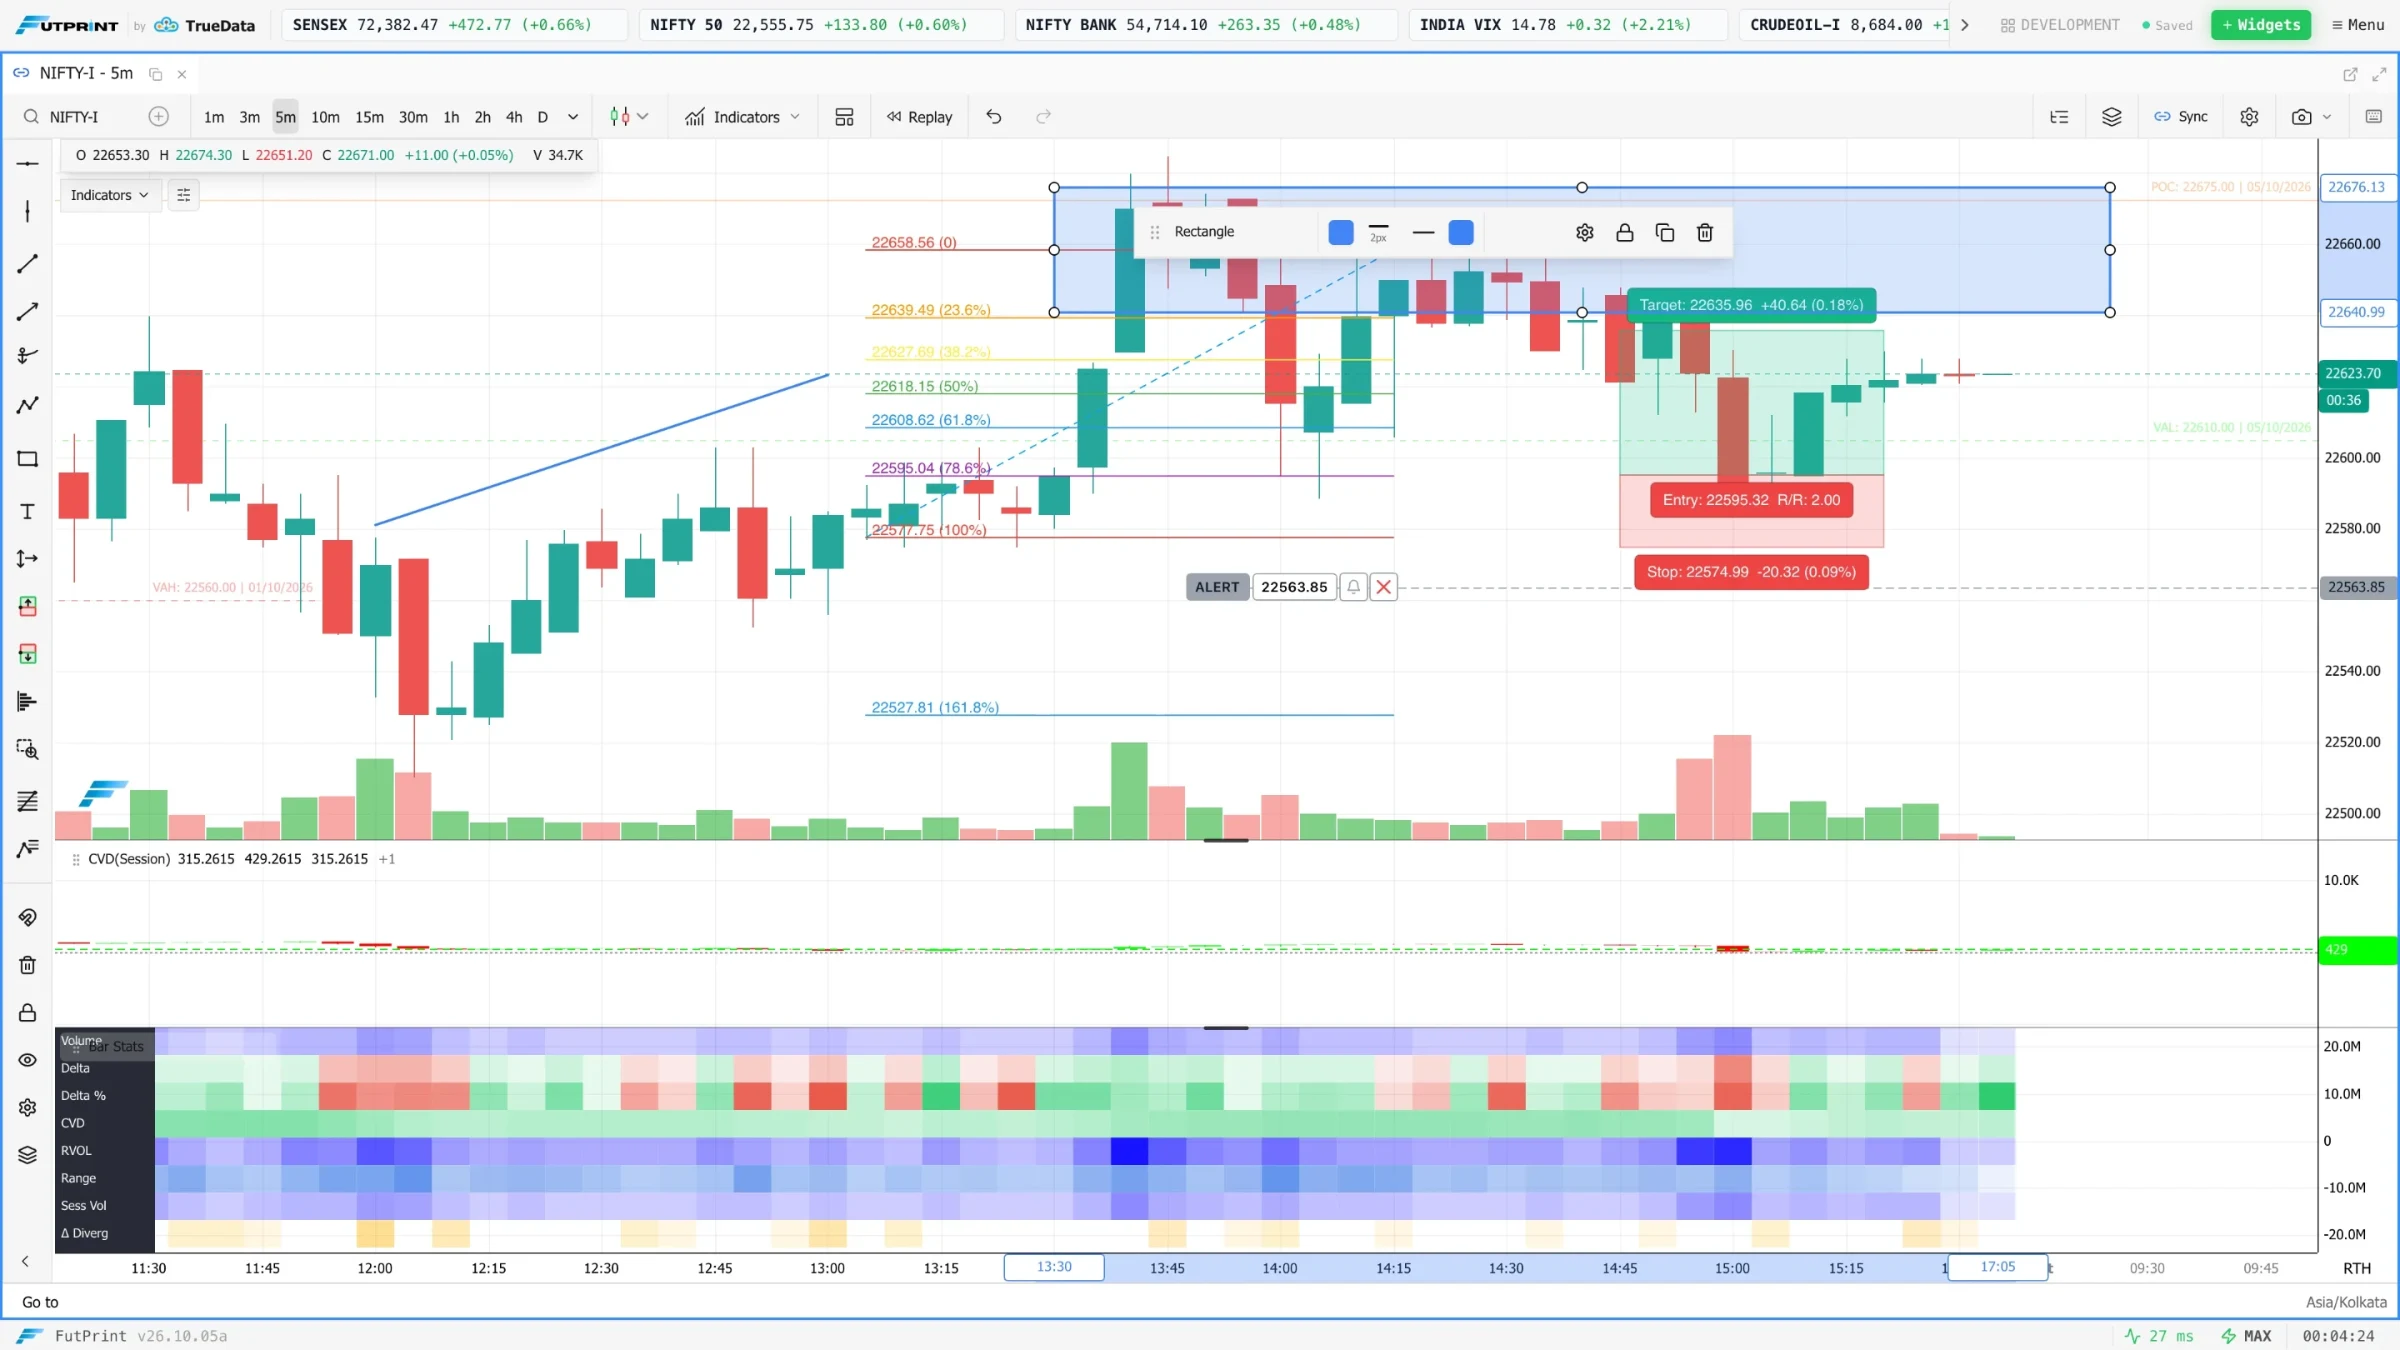
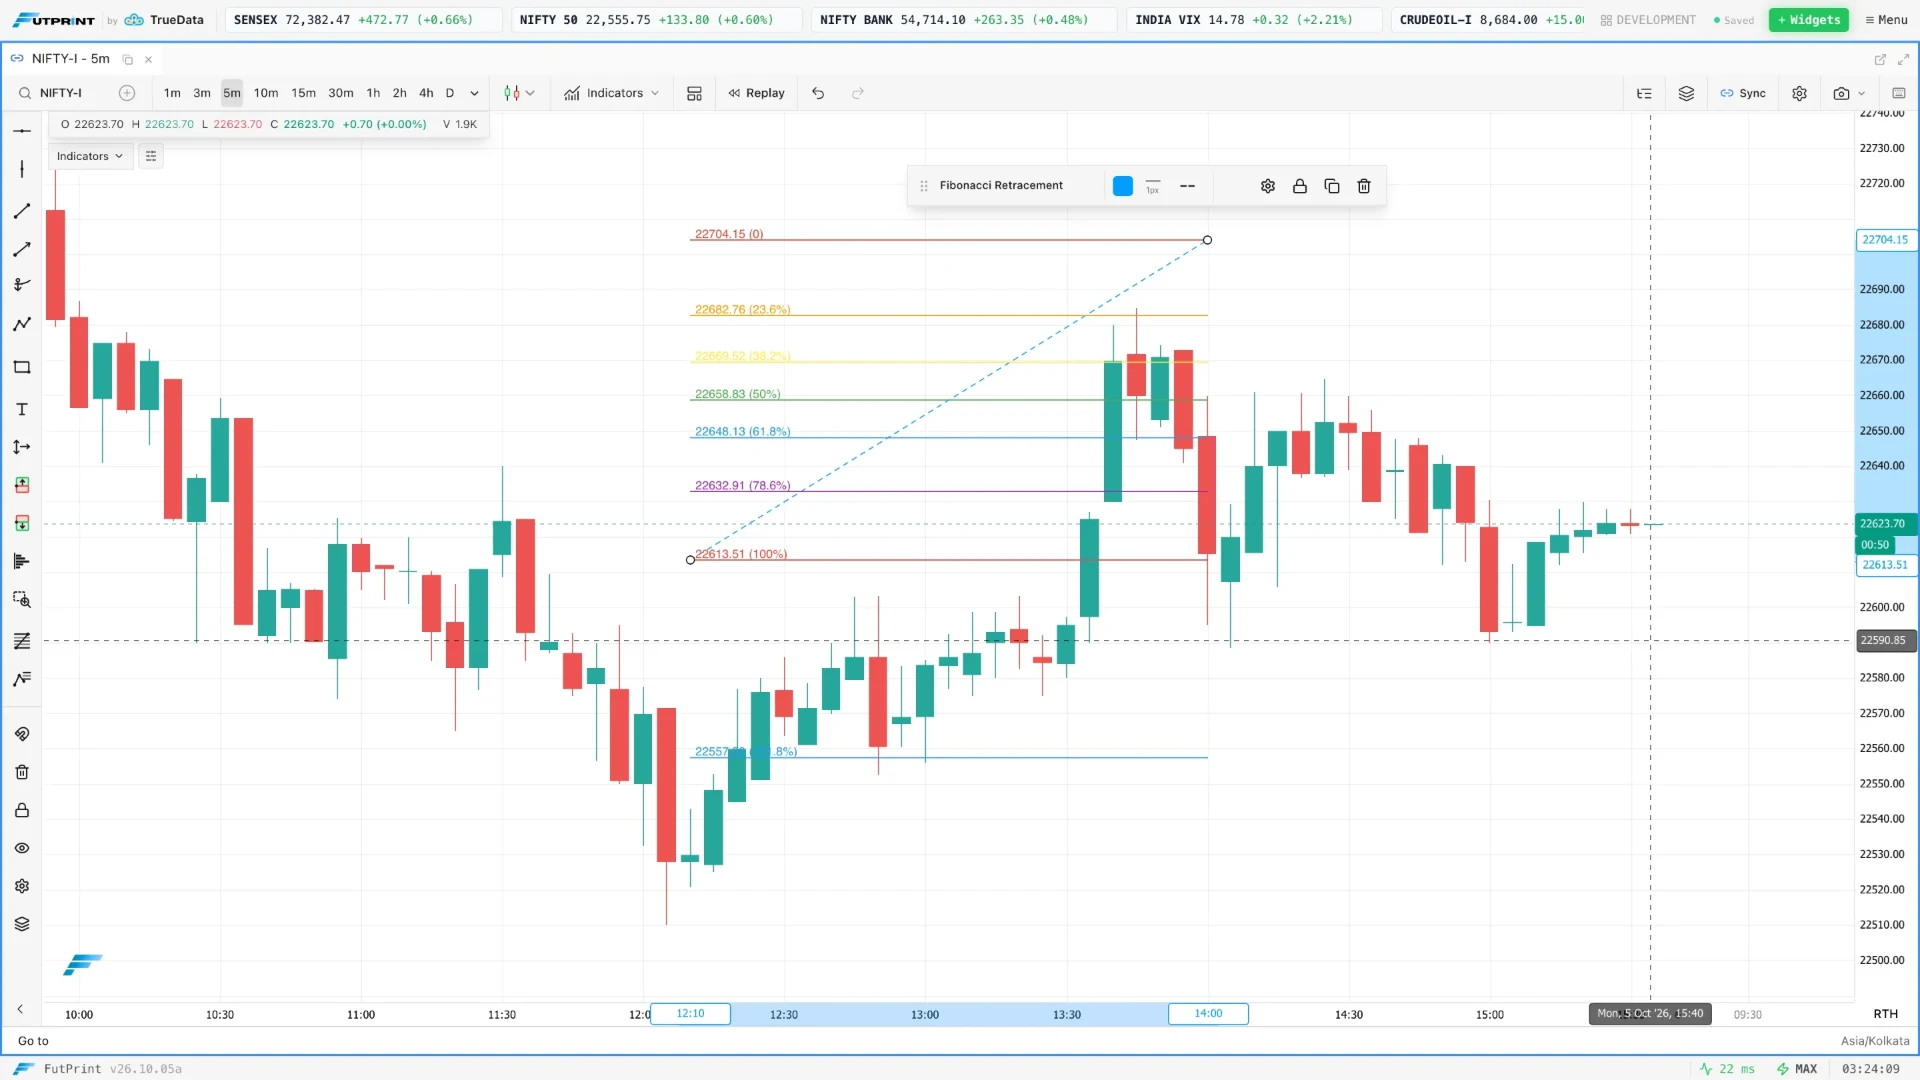
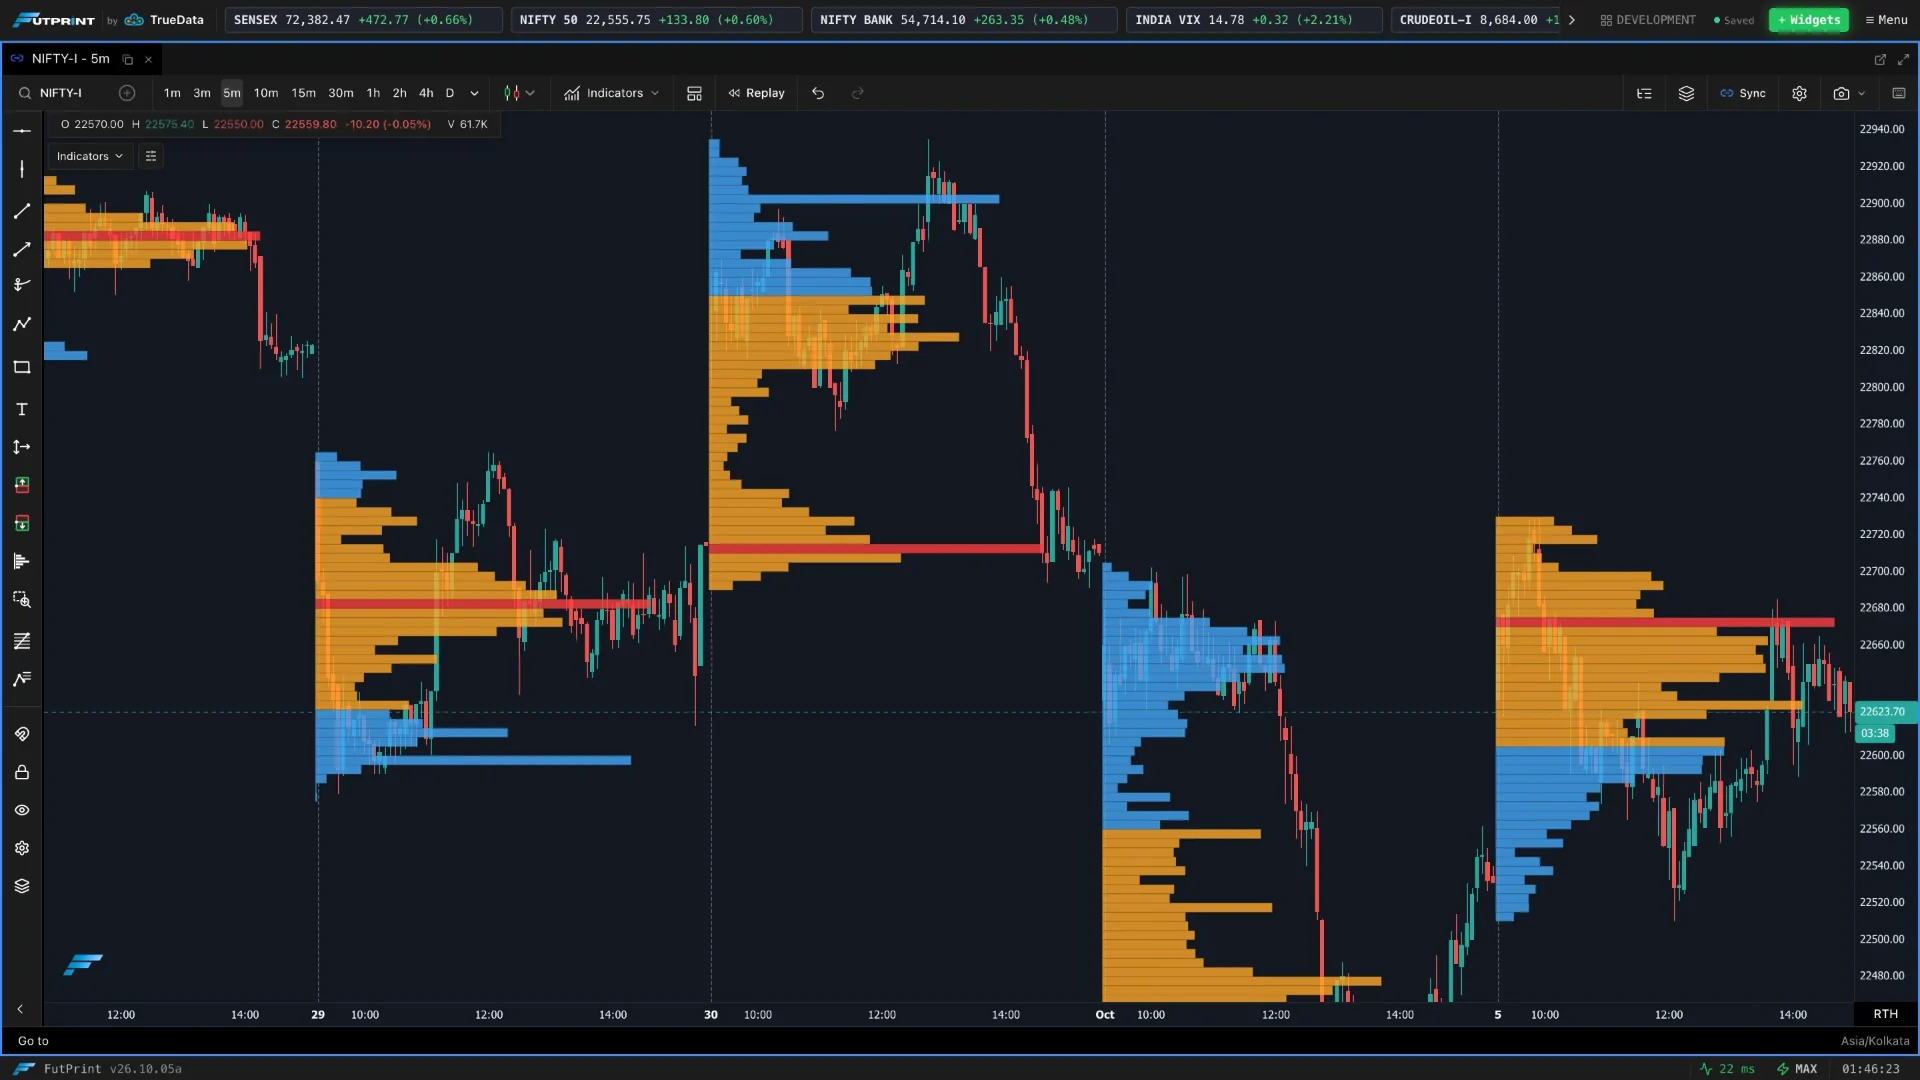
Explore existing captures from the terminal. Open any view to inspect the details.
Built-in depth.
Worth exploring.
One process.
From start to finish.
Discover activity. Investigate the detail. Study your decisions. Bring the stages of your work into one environment.
Move from breadth and sector leadership to individual order-flow events, then examine the underlying instrument.
Explore the workflowThe right tools. The right data.
Compare end-of-day and real-time plans, exchange coverage and module limits.
FutPrint brings charting, order flow, options analysis, market monitoring and practice tools into a configurable terminal for Indian-market traders.
No. Data timing, exchange coverage, footprint history and widget limits vary by plan. The pricing page gives the current comparison, including the limits of the free plan.
No. Gamma exposure is model-based, and scanner events are derived from observed market data and configured rules. They are analytical context to investigate, not guaranteed outcomes.
FutPrint includes paper-trading tools, historical replay and a journal. The Scalper currently supports paper accounts. Historical and simulated results differ from live execution.
Yes. Add and dock modules, resize panels, create symbol link groups and save a workspace. Available modules and instance counts depend on your subscription.
Make the market
your workspace.
Data timing, coverage and tools vary by plan.