Tick Analyser
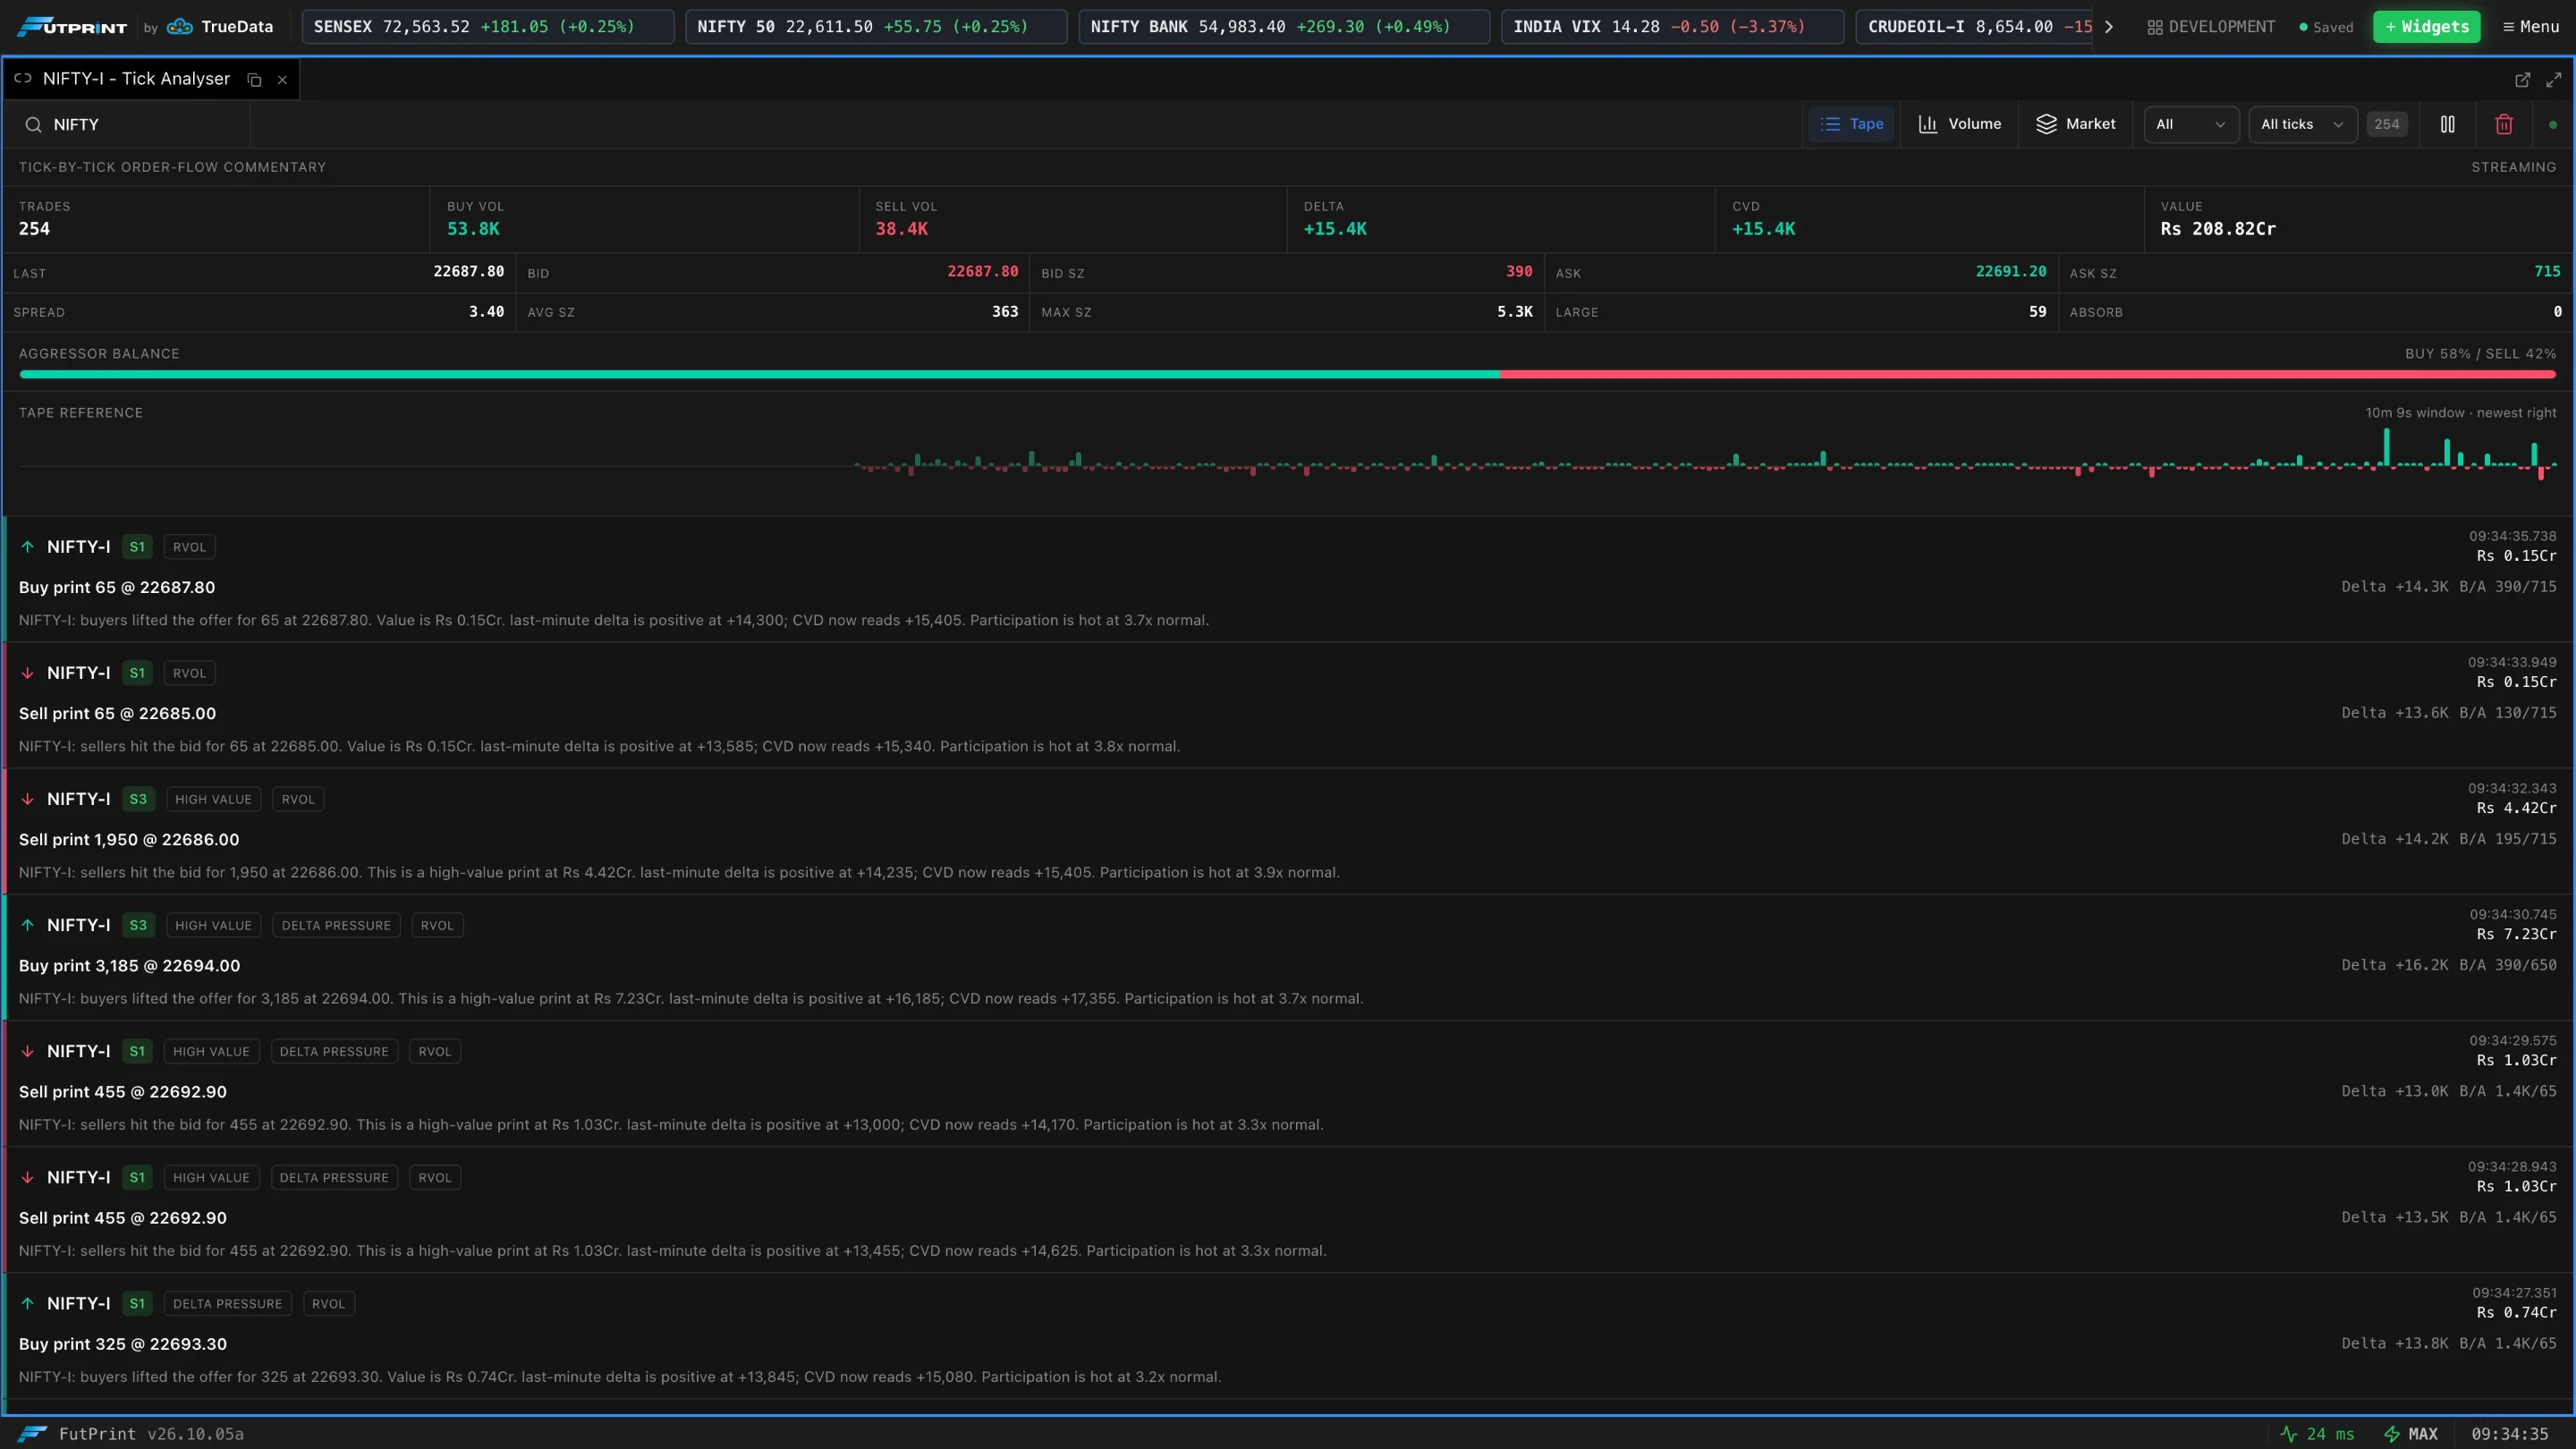
Tick Analyser reads the tape of one instrument for you. Every print gets a headline, a strength, tags and a one-line explanation in plain English, above a live summary of the session's order flow. Two further views draw the same ticks as a volume profile and as a market profile.
Choosing a symbol
Type in Symbol… at the top left, or link the panel to a chart, Time & Sales or another symbol panel and it follows that panel's symbol. Until a symbol is chosen the panel reads No tick reads yet.
The summary
| Field | Meaning |
|---|---|
| Trades | Prints seen since the panel started on this symbol. |
| Buy Vol / Sell Vol | Quantity traded by aggressive buyers and aggressive sellers. |
| Delta | Buy volume minus sell volume. |
| CVD | Cumulative delta for the session. |
| Value | Traded value. |
| Last, Bid, Ask, Bid Sz, Ask Sz, Spread | The current quote. |
| Avg Sz / Max Sz | Average and largest print size. |
| Large | Count of high-value prints. |
| Absorb | Count of prints flagged for absorption. |
Aggressor Balance splits the bar between buy-side and sell-side volume, with the percentages at the right. Tape Reference is a strip of the most recent prints, newest at the right.
The tape
Each row is one print:
| Part | Meaning |
|---|---|
| Arrow and colour | Green for a buy-side print, red for a sell-side print. |
| S1 / S2 / S3 | Strength, from ordinary (S1) to strong (S3). |
| Tags | Why the print is notable (see below). |
| Headline | For example Sell print 390 @ 22660.20. |
| Commentary | Who was the aggressor, the value, the last minute's delta, the session CVD, and whether price is at the session high or low. |
| Right side | The time, the value, the running delta and the bid/ask sizes at the print. |
| Tag | Meaning |
|---|---|
| HIGH VALUE | The print is worth ₹1 Cr or more. |
| DELTA PRESSURE | At least 65% of the last minute's volume was on one side. |
| ABSORPTION | 50,000 or more quantity traded in 30 seconds while price stayed within 4 ticks. |
| RVOL | The last minute's volume is at least 3× normal. |
| SESSION HIGH / SESSION LOW | The print is within one tick of the session high or low. |
Two filters sit in the toolbar while Tape is selected:
- Side: All, Buy, Sell or Neutral.
- Strength: All ticks, Notable+ (S2 and S3) or Strong (S3 only).
On a busy contract, Notable+ removes most of the noise.
Volume view
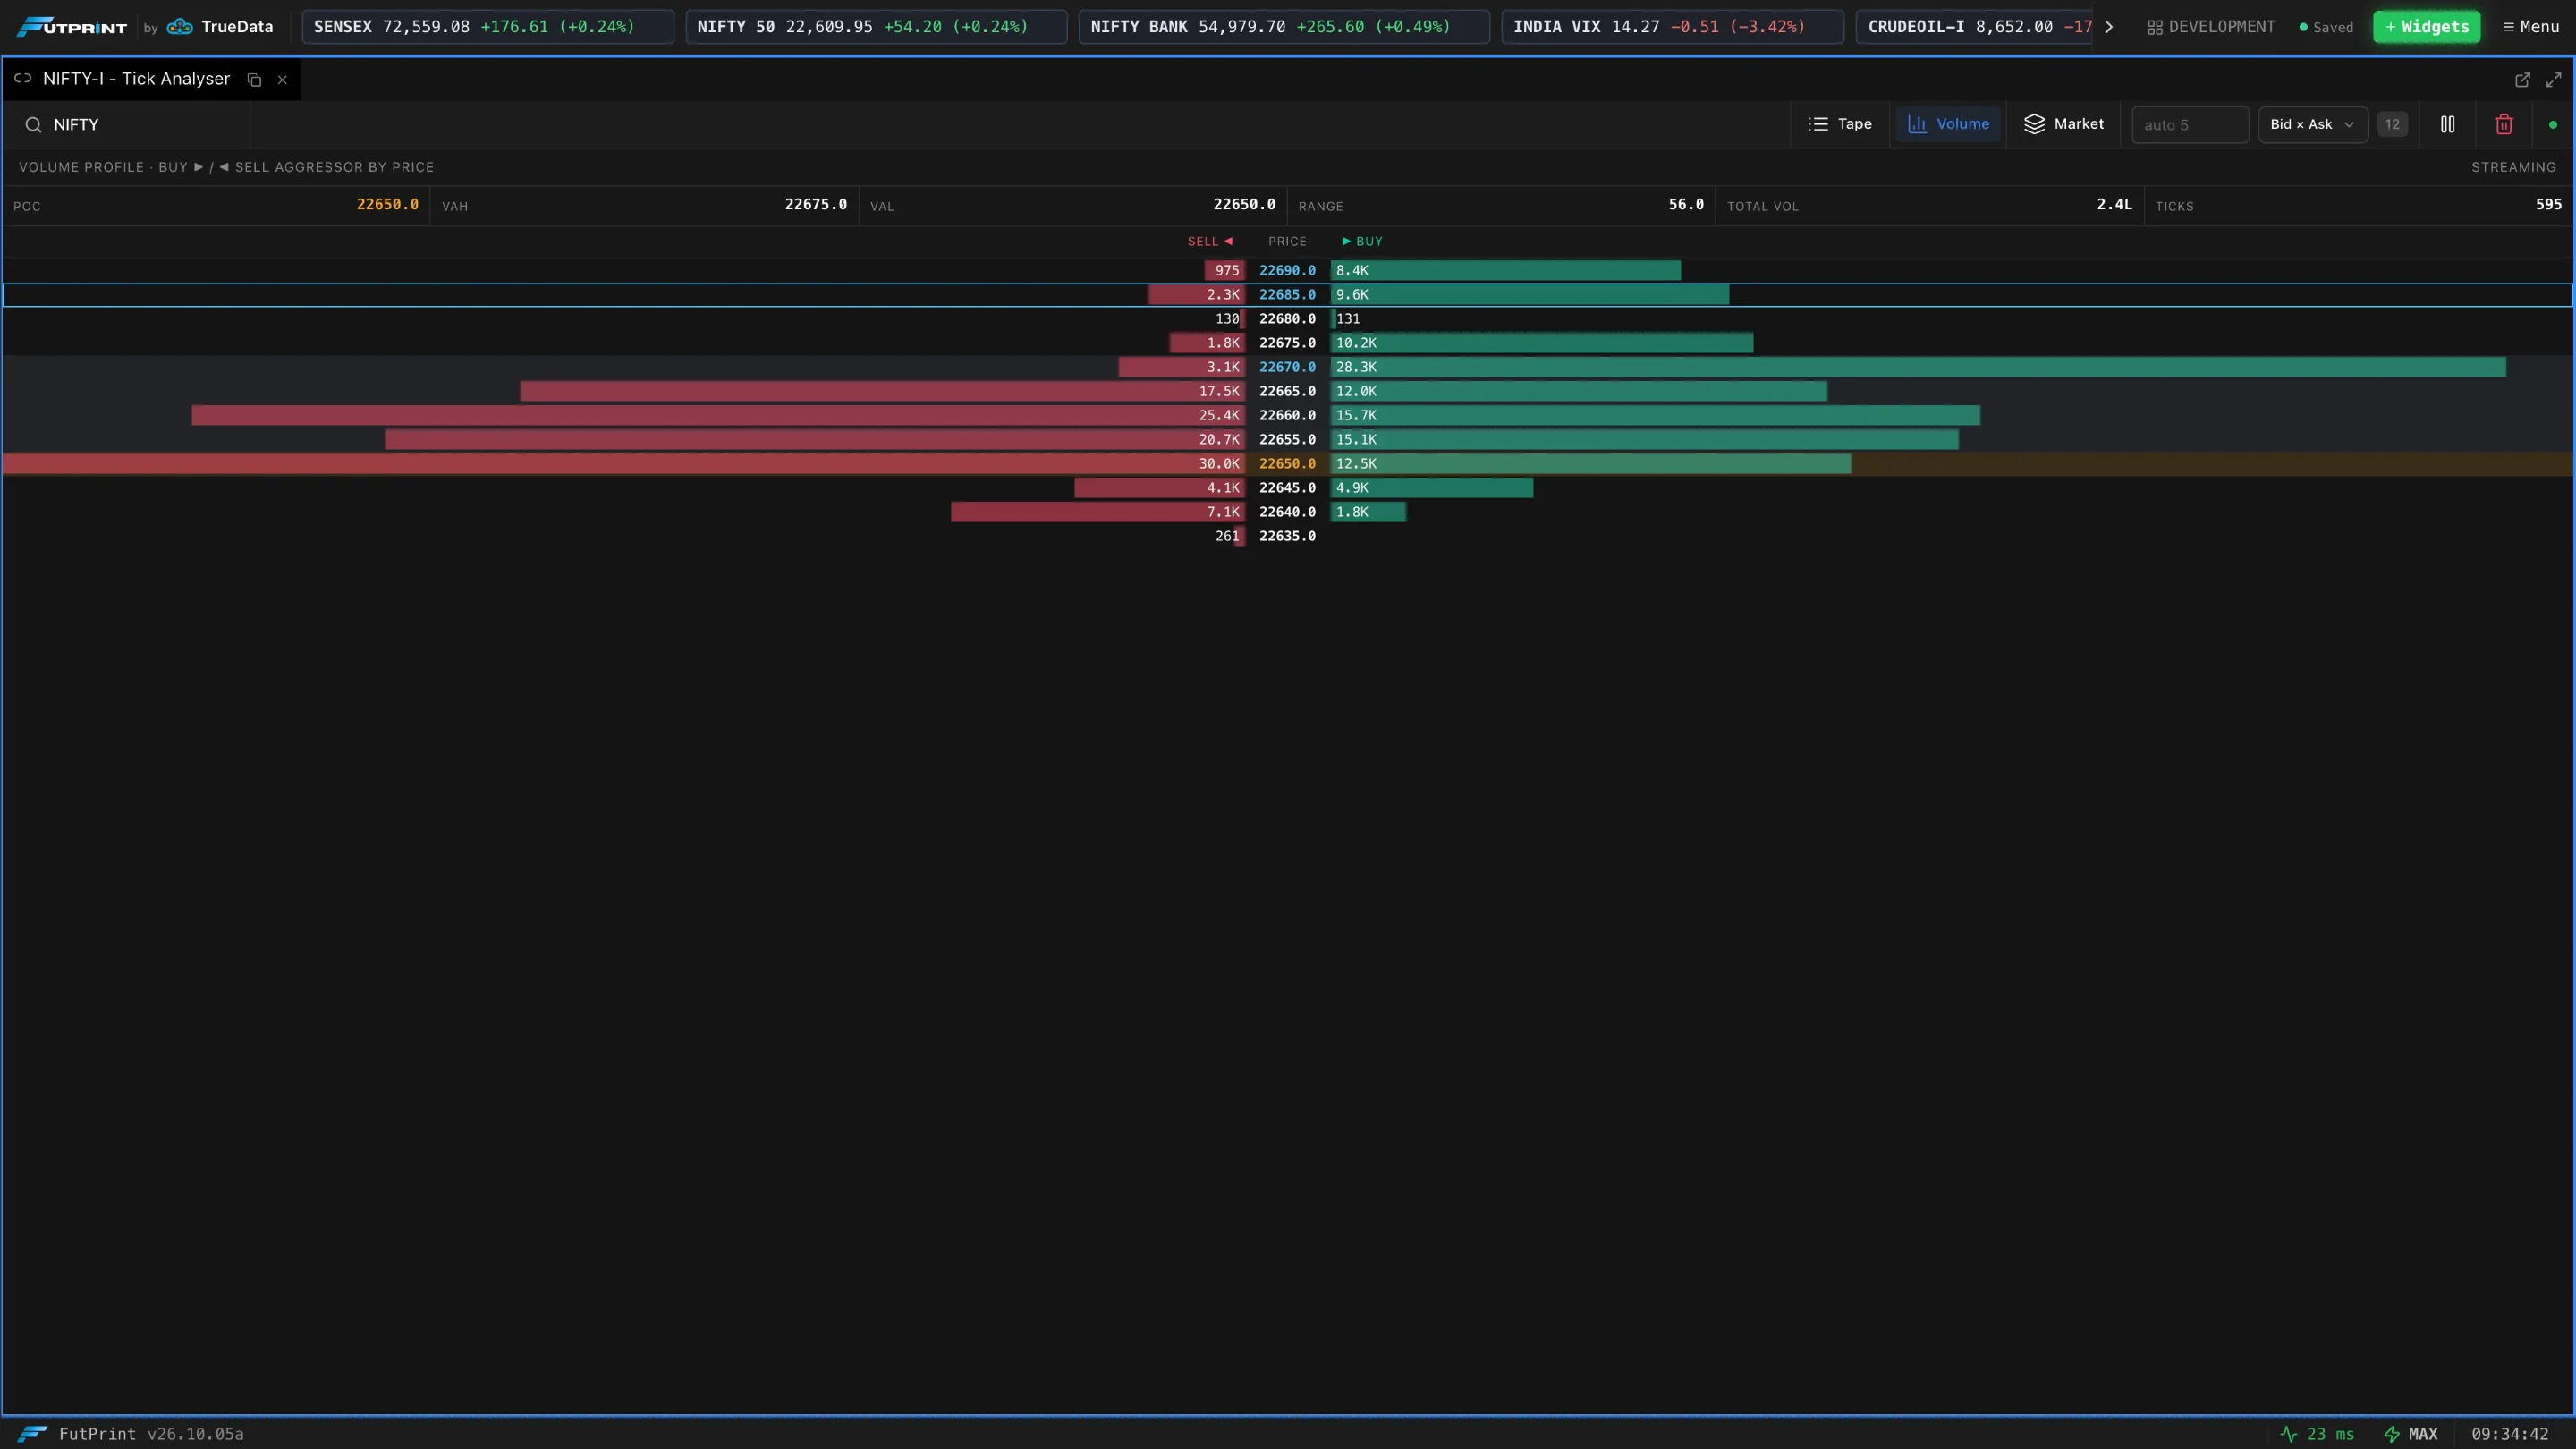
A volume profile built from the session's ticks, one row per price. The strip above it shows the POC, VAH, VAL, the Range, Total Vol and the number of Ticks.
| Control | What it does |
|---|---|
| Bin size | Price step per row. Leave it blank for automatic. |
| Mode | Bid × Ask, Delta, Total, Buy only or Sell only. |
Market view
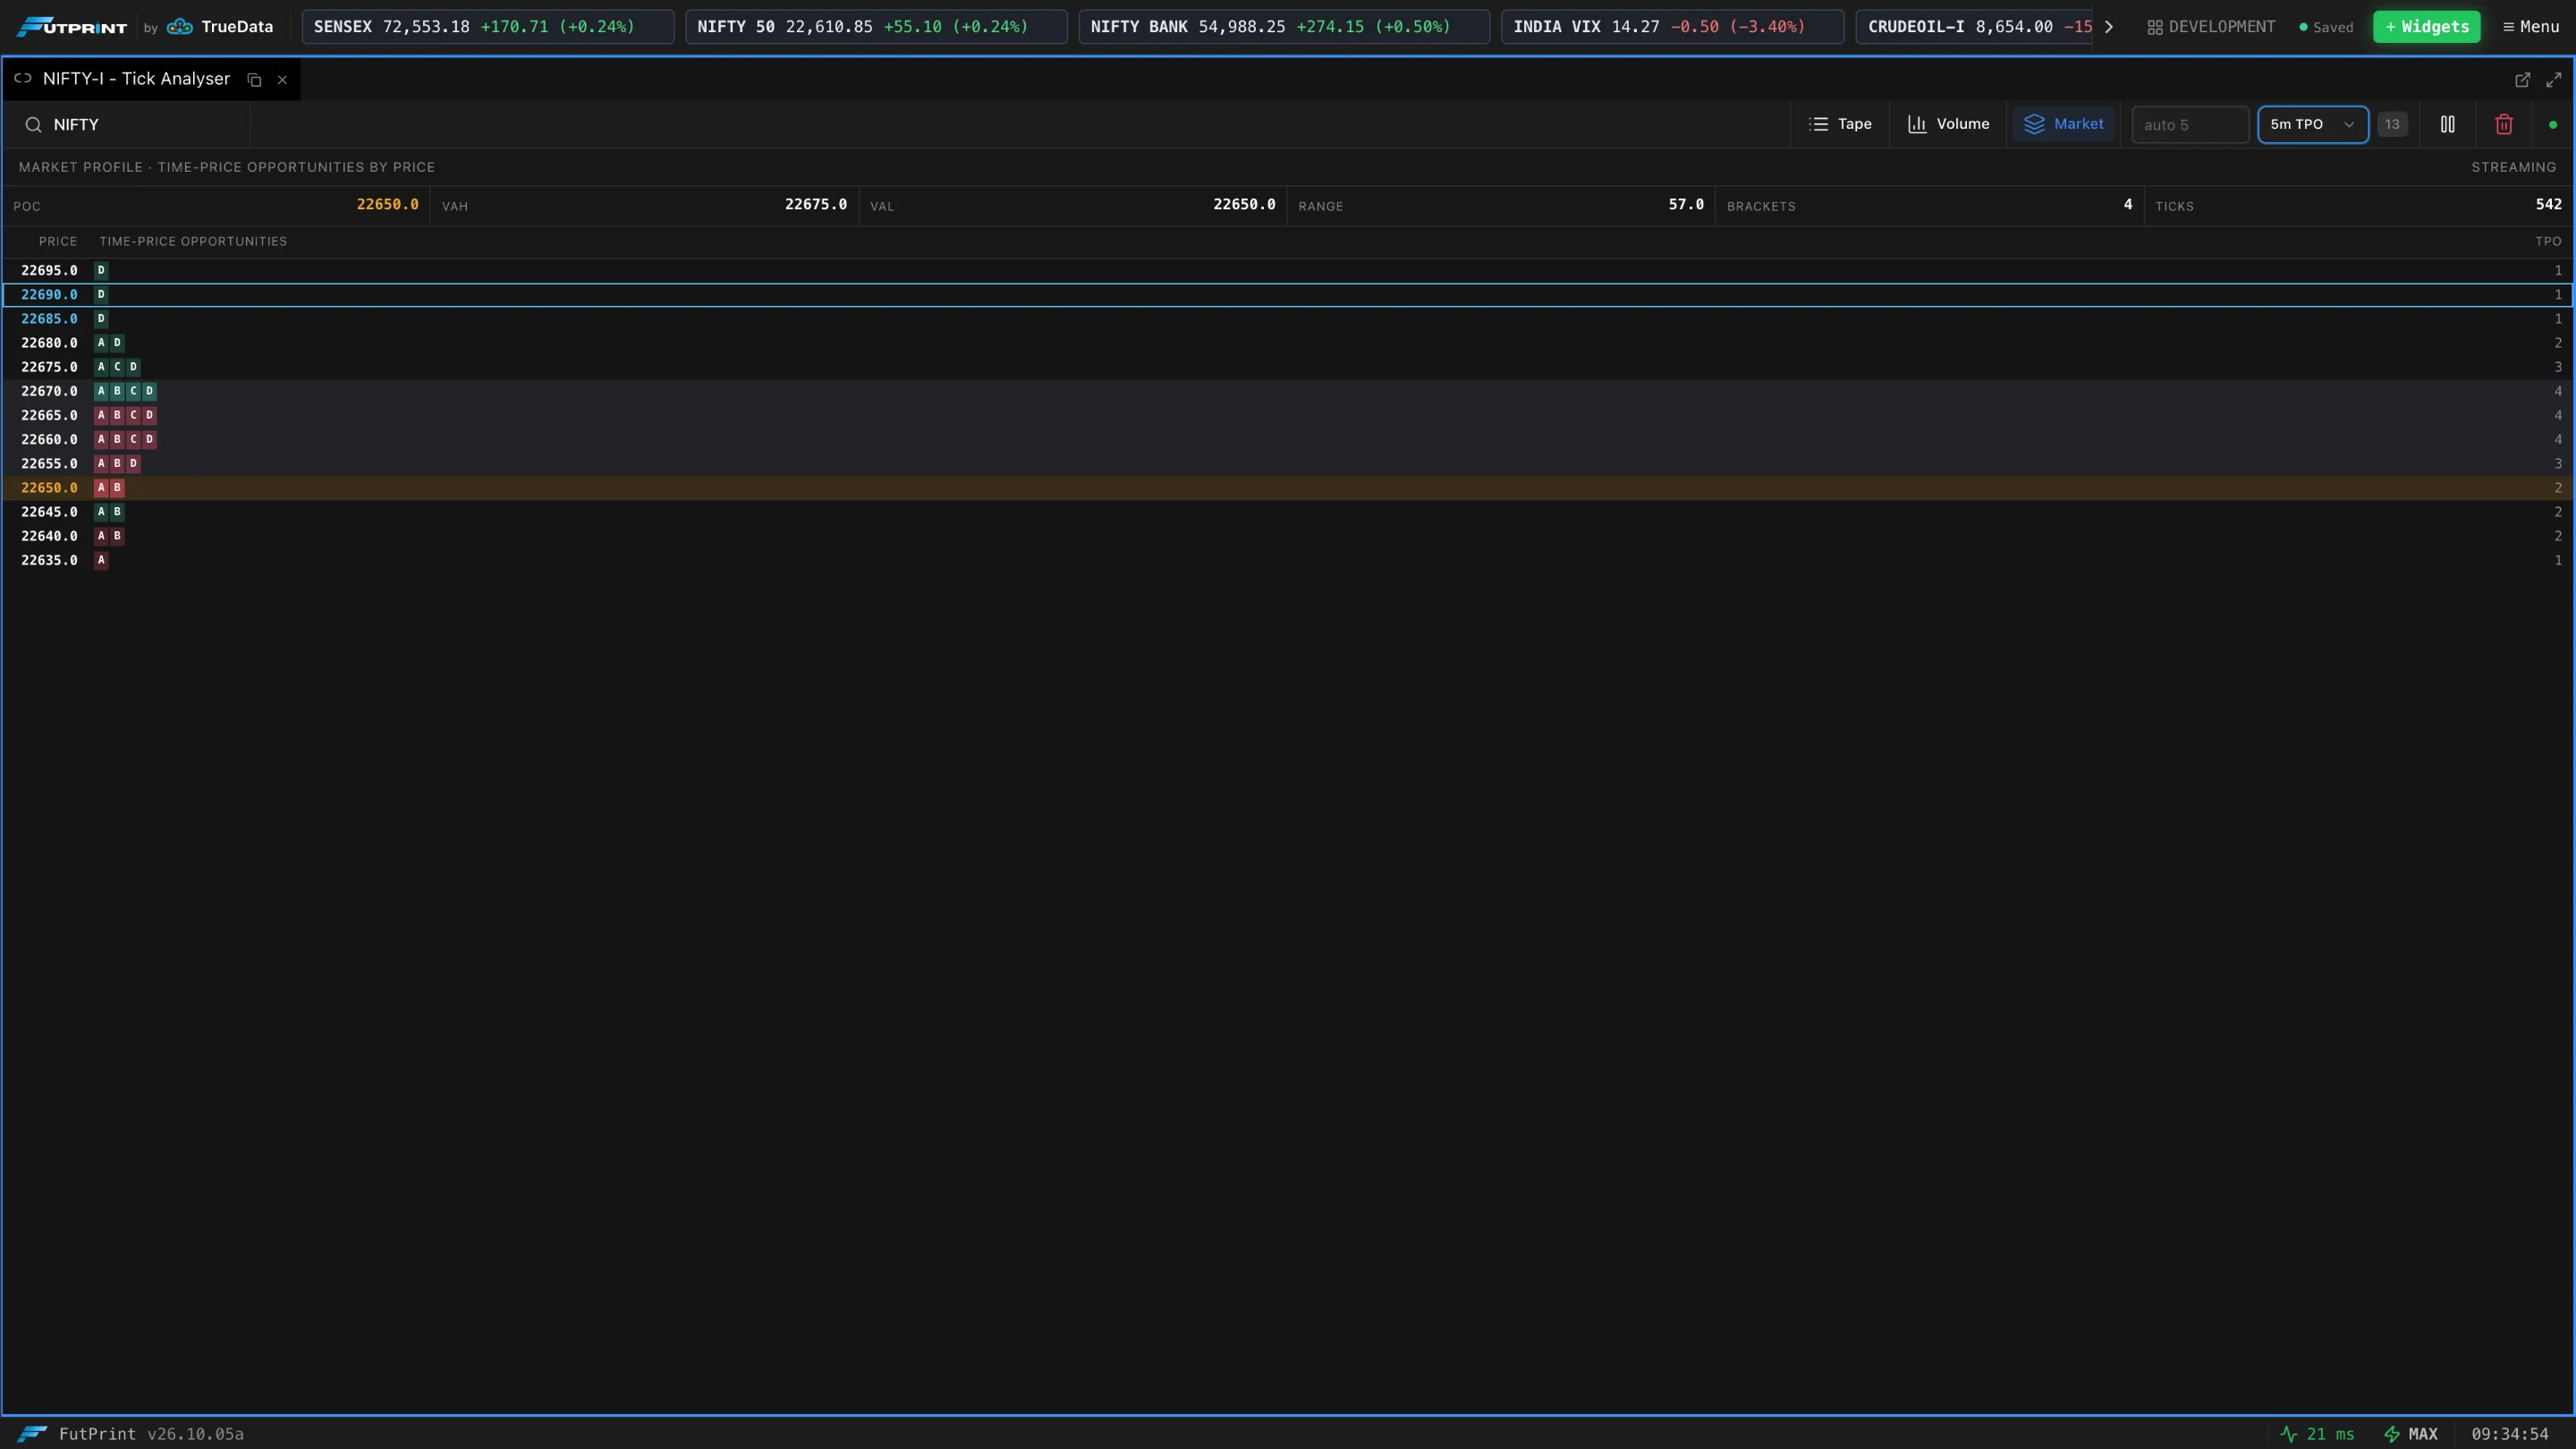
A market profile (TPO) of the same ticks: one letter per time bracket at each price it traded. The strip shows POC, VAH, VAL, Range, Brackets and Ticks.
| Control | What it does |
|---|---|
| Bin size | Price step per row. Leave it blank for automatic. |
| Bracket | Length of each letter's period: 5m, 15m, 30m or 60m. |
Pause and clear
Pause freezes the tape so you can read it; Clear empties it. Neither changes the symbol.
Use Tick Analyser beside a footprint chart of the same symbol. The chart shows where volume traded; the commentary tells you what the latest prints mean as they arrive.
The commentary describes order flow. It is not advice; confirm what you see on the chart before acting.