Indicator — Cumulative Volume Delta (CVD)
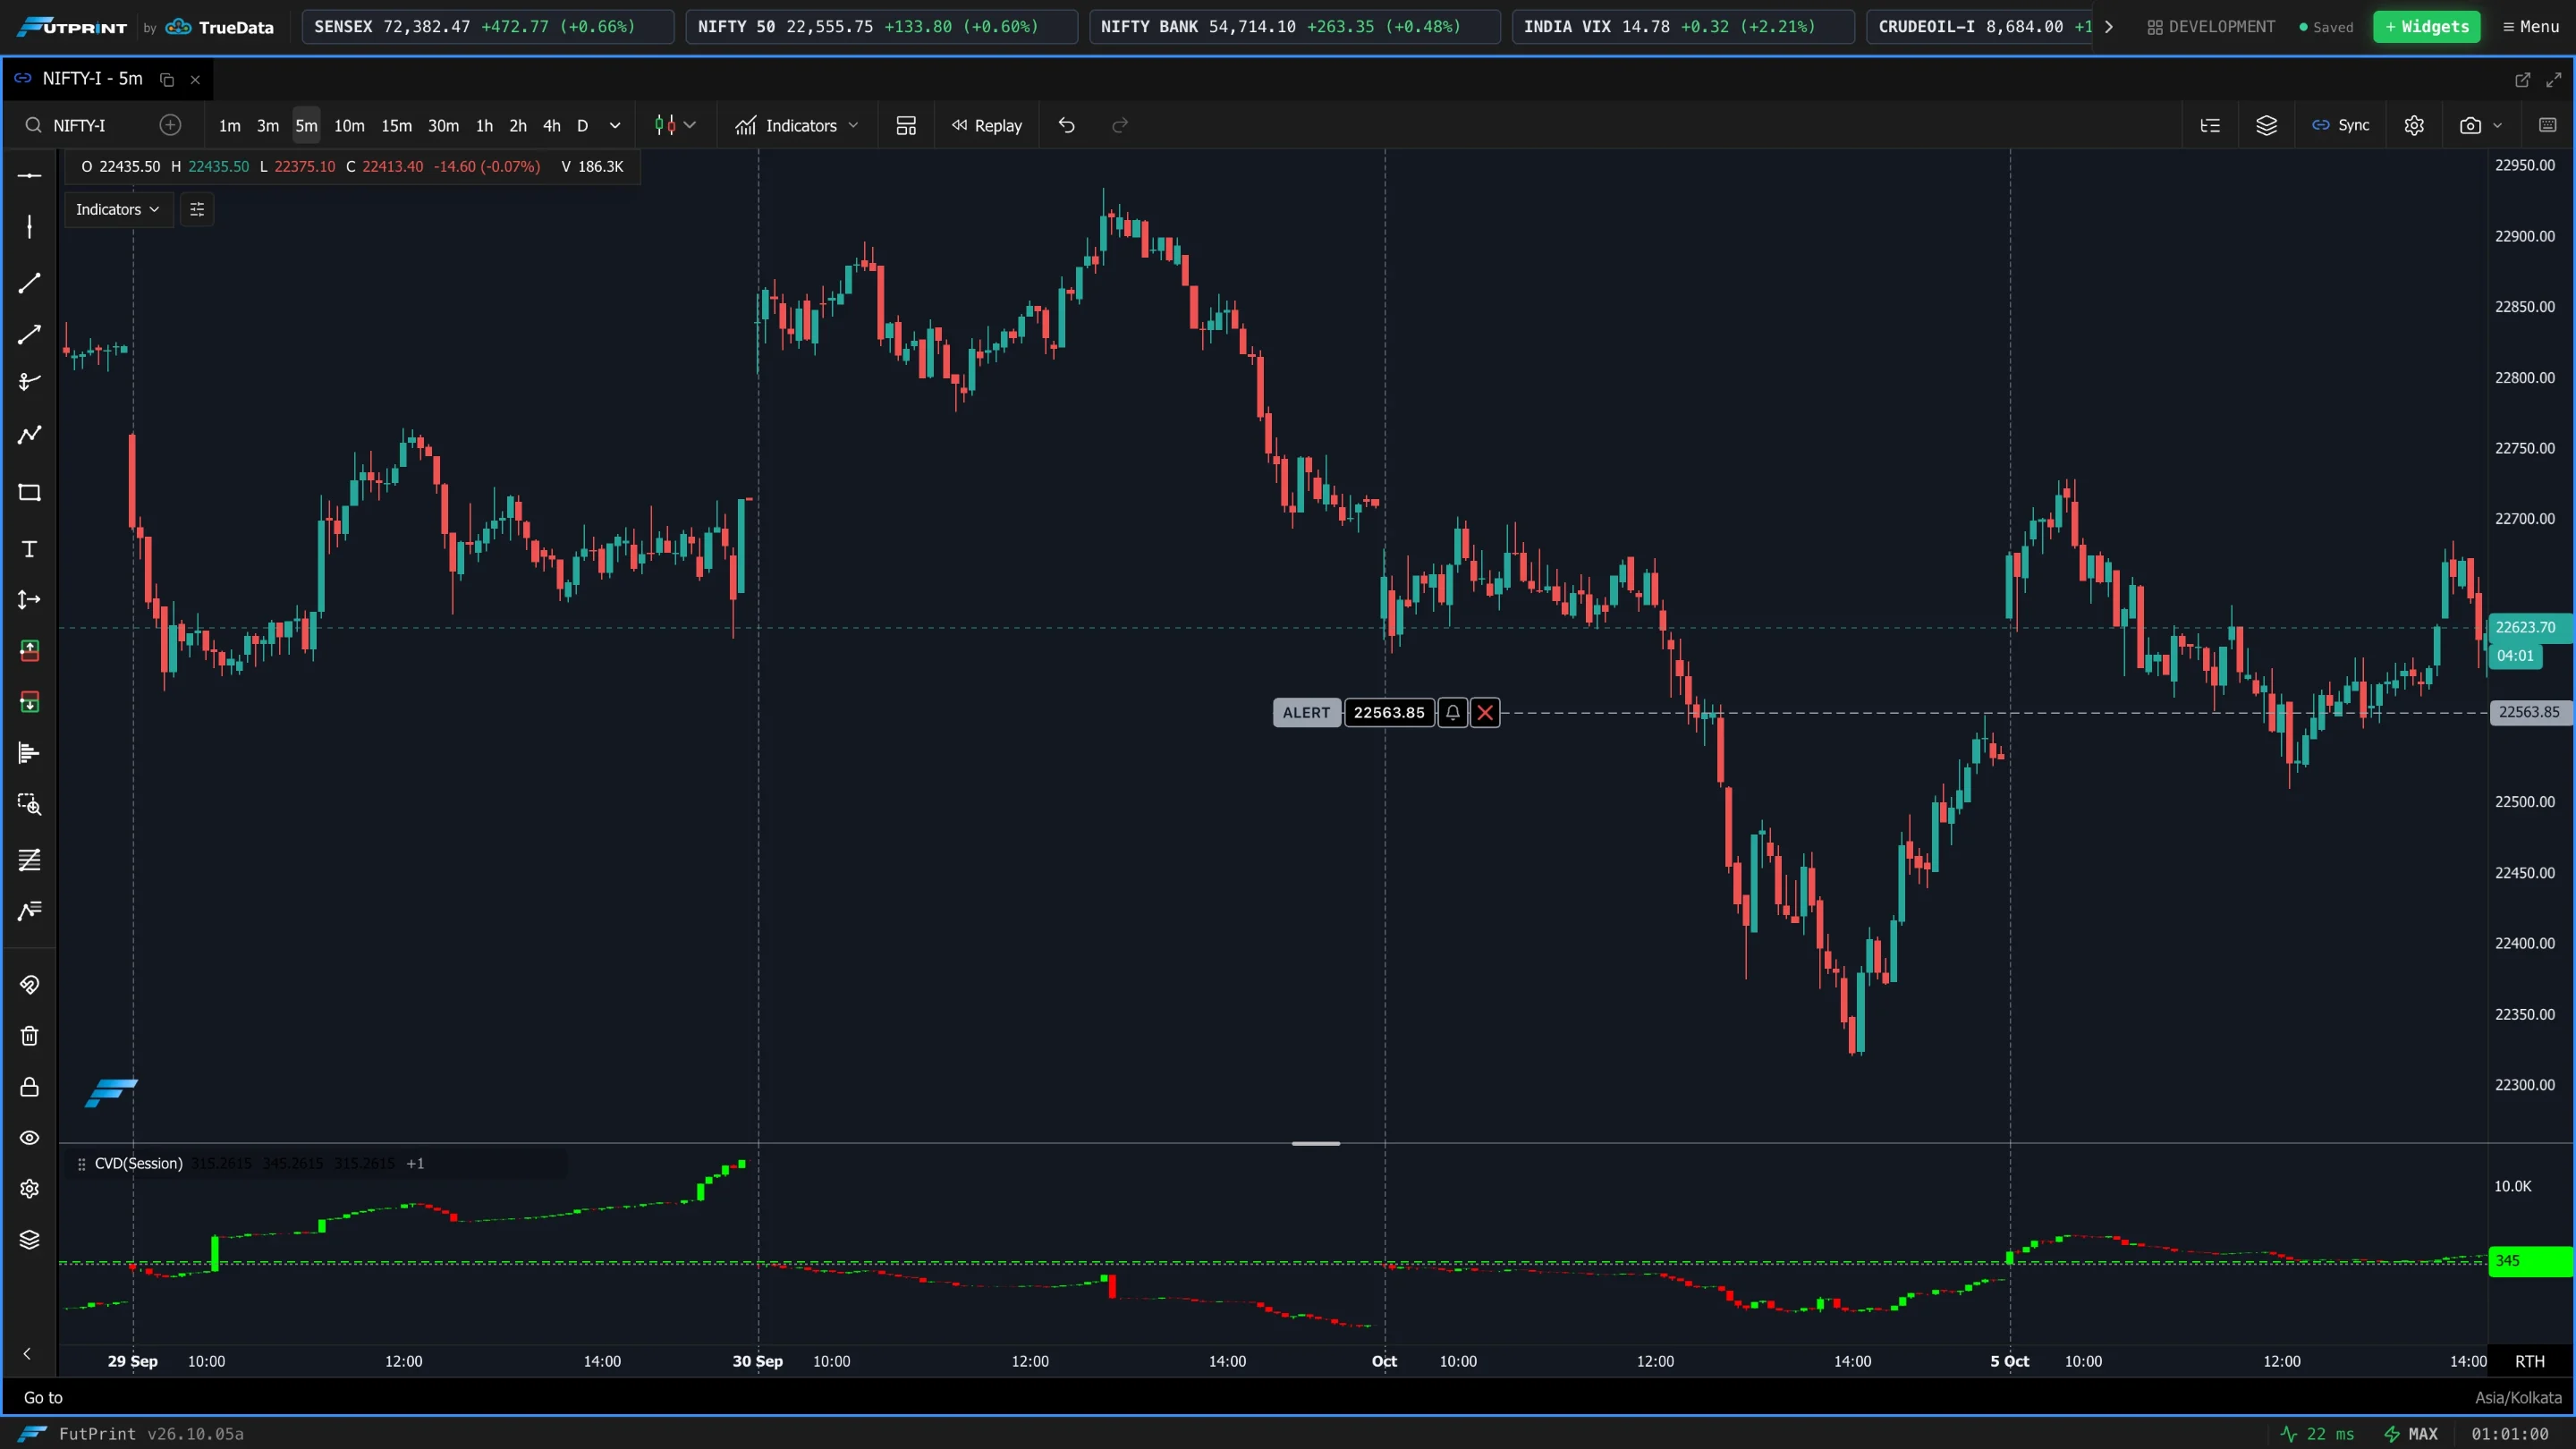
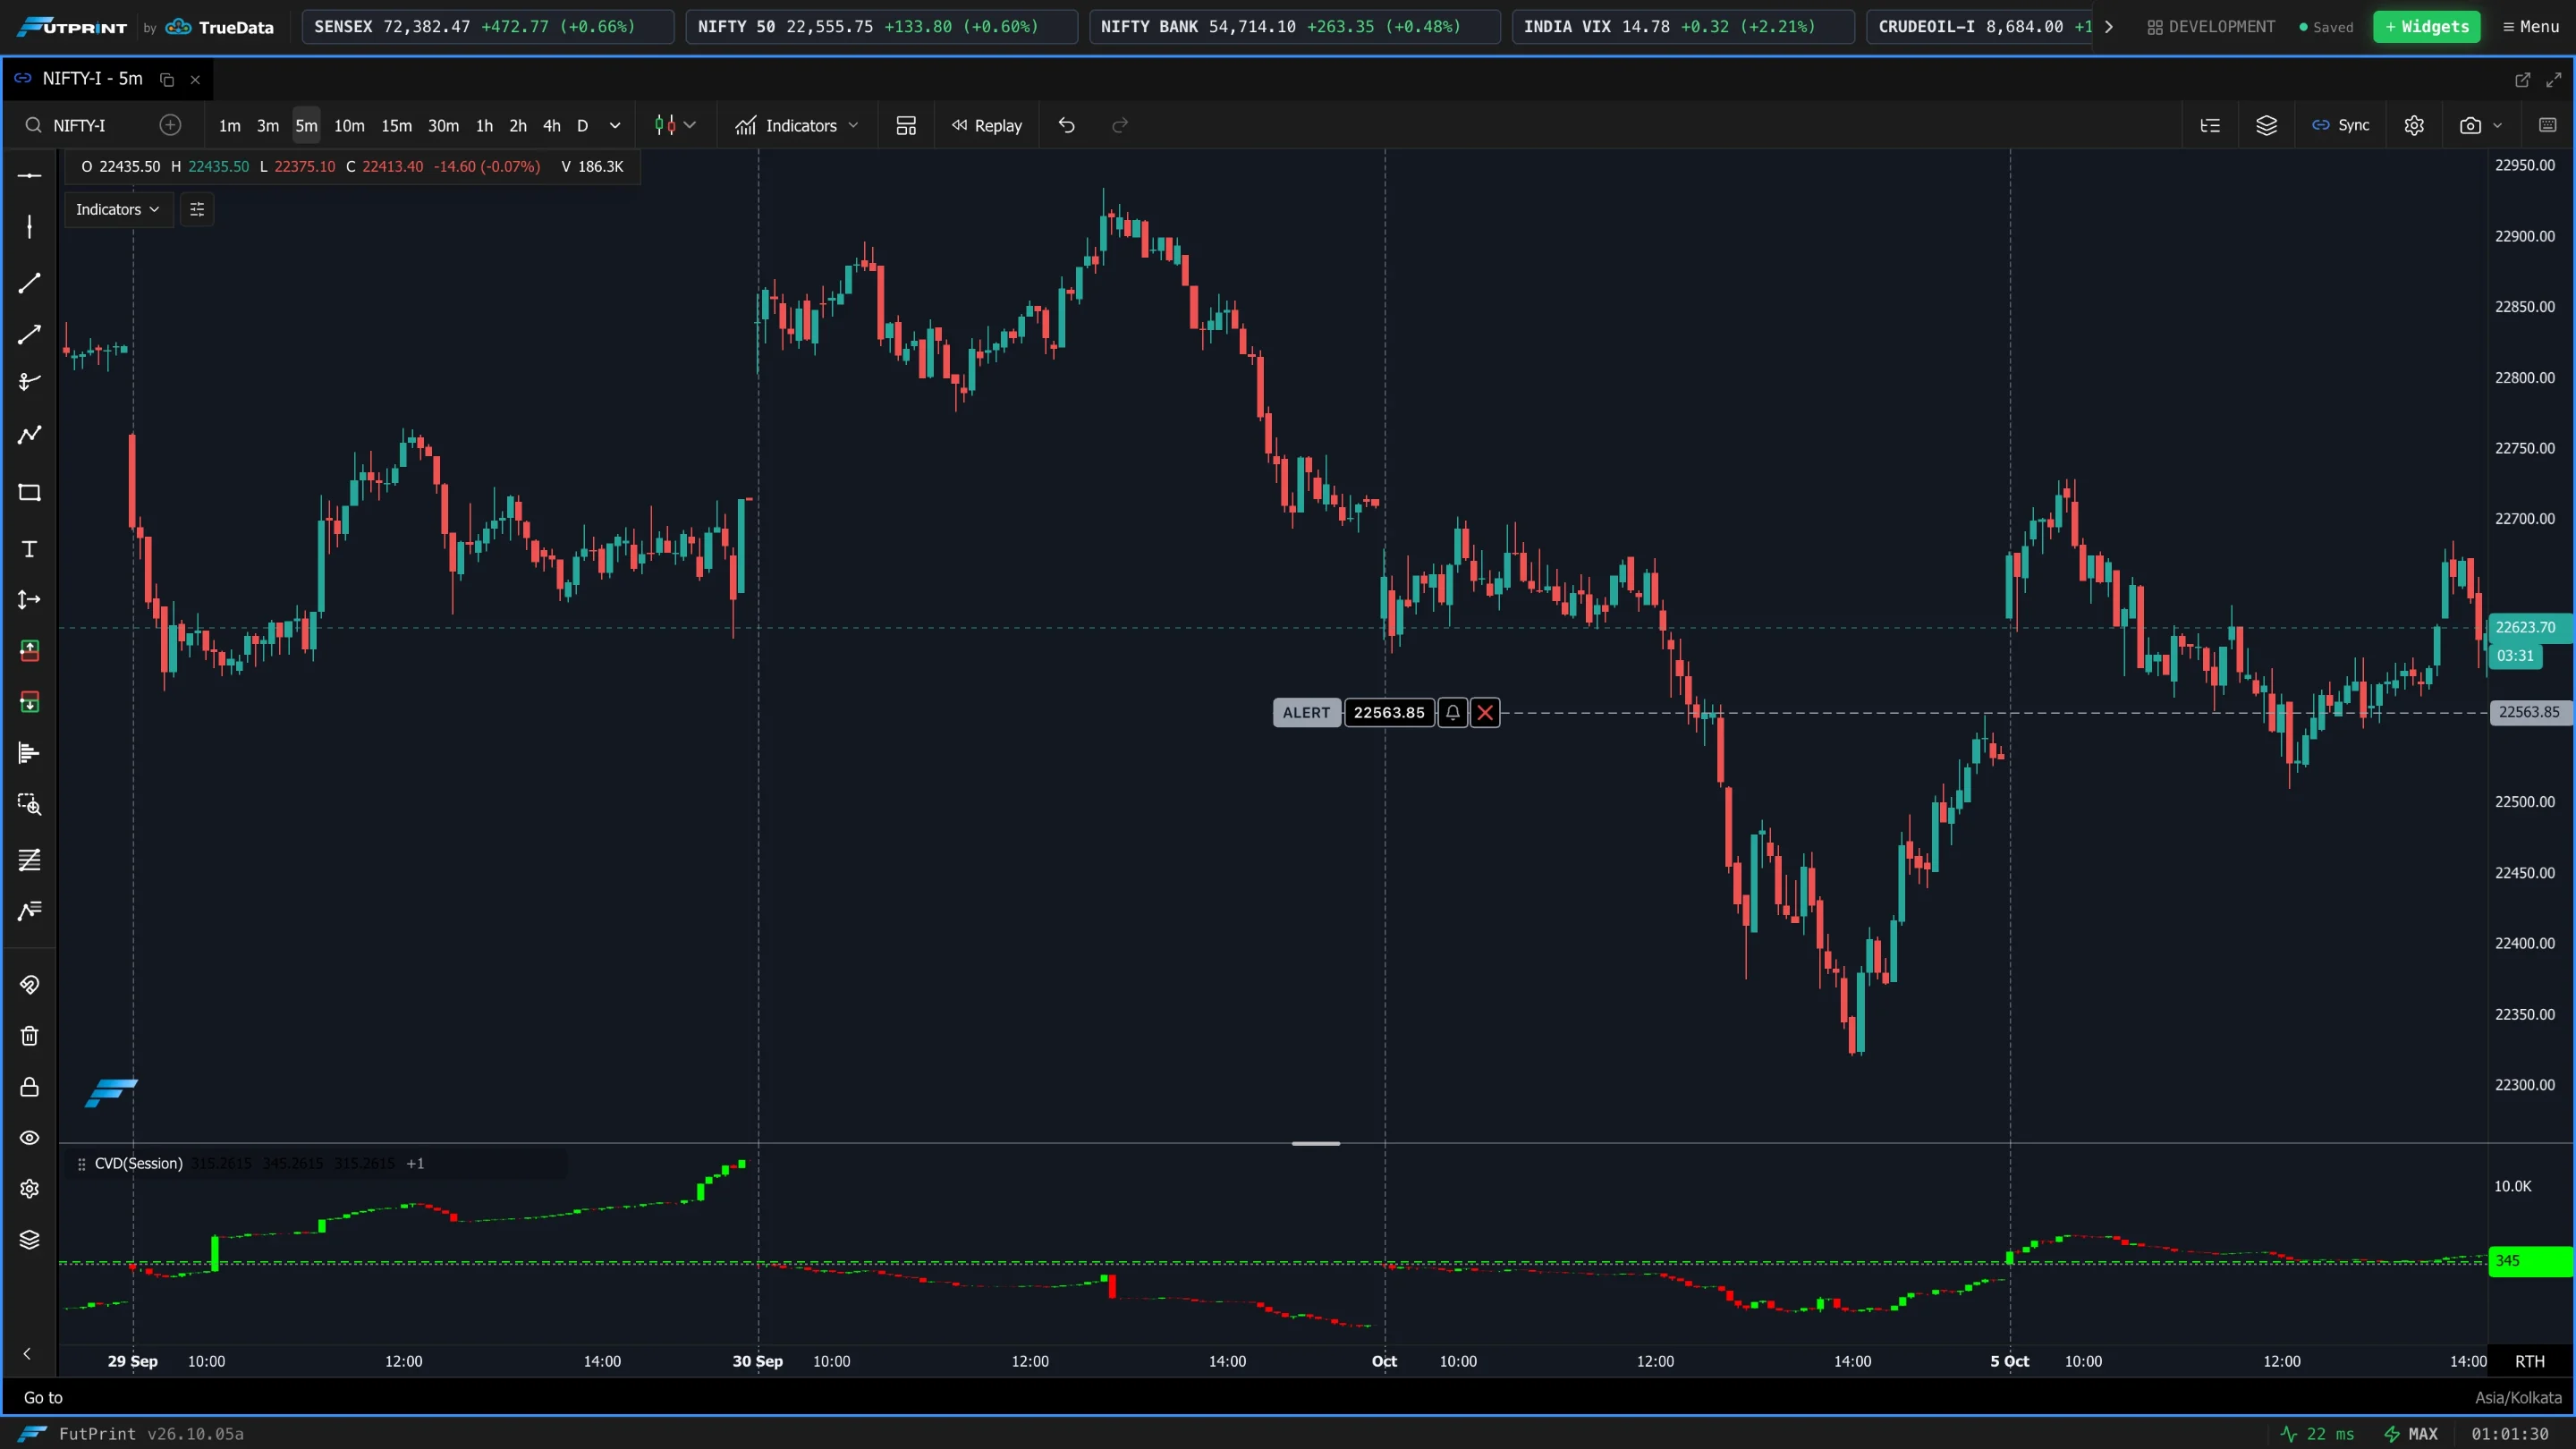
Cumulative Volume Delta is the running total of delta — buy volume minus sell volume — plotted in its own pane. Rising CVD means aggressive buyers have been in control over the period; falling CVD means aggressive sellers have.
Module
Cumulative Volume Delta
How to open
Chart ▸ Indicators ▸ Orderflow & Delta ▸ Cumulative Volume Delta
Data source
Tick-level buy and sell volume
Saved in workspace
Yes
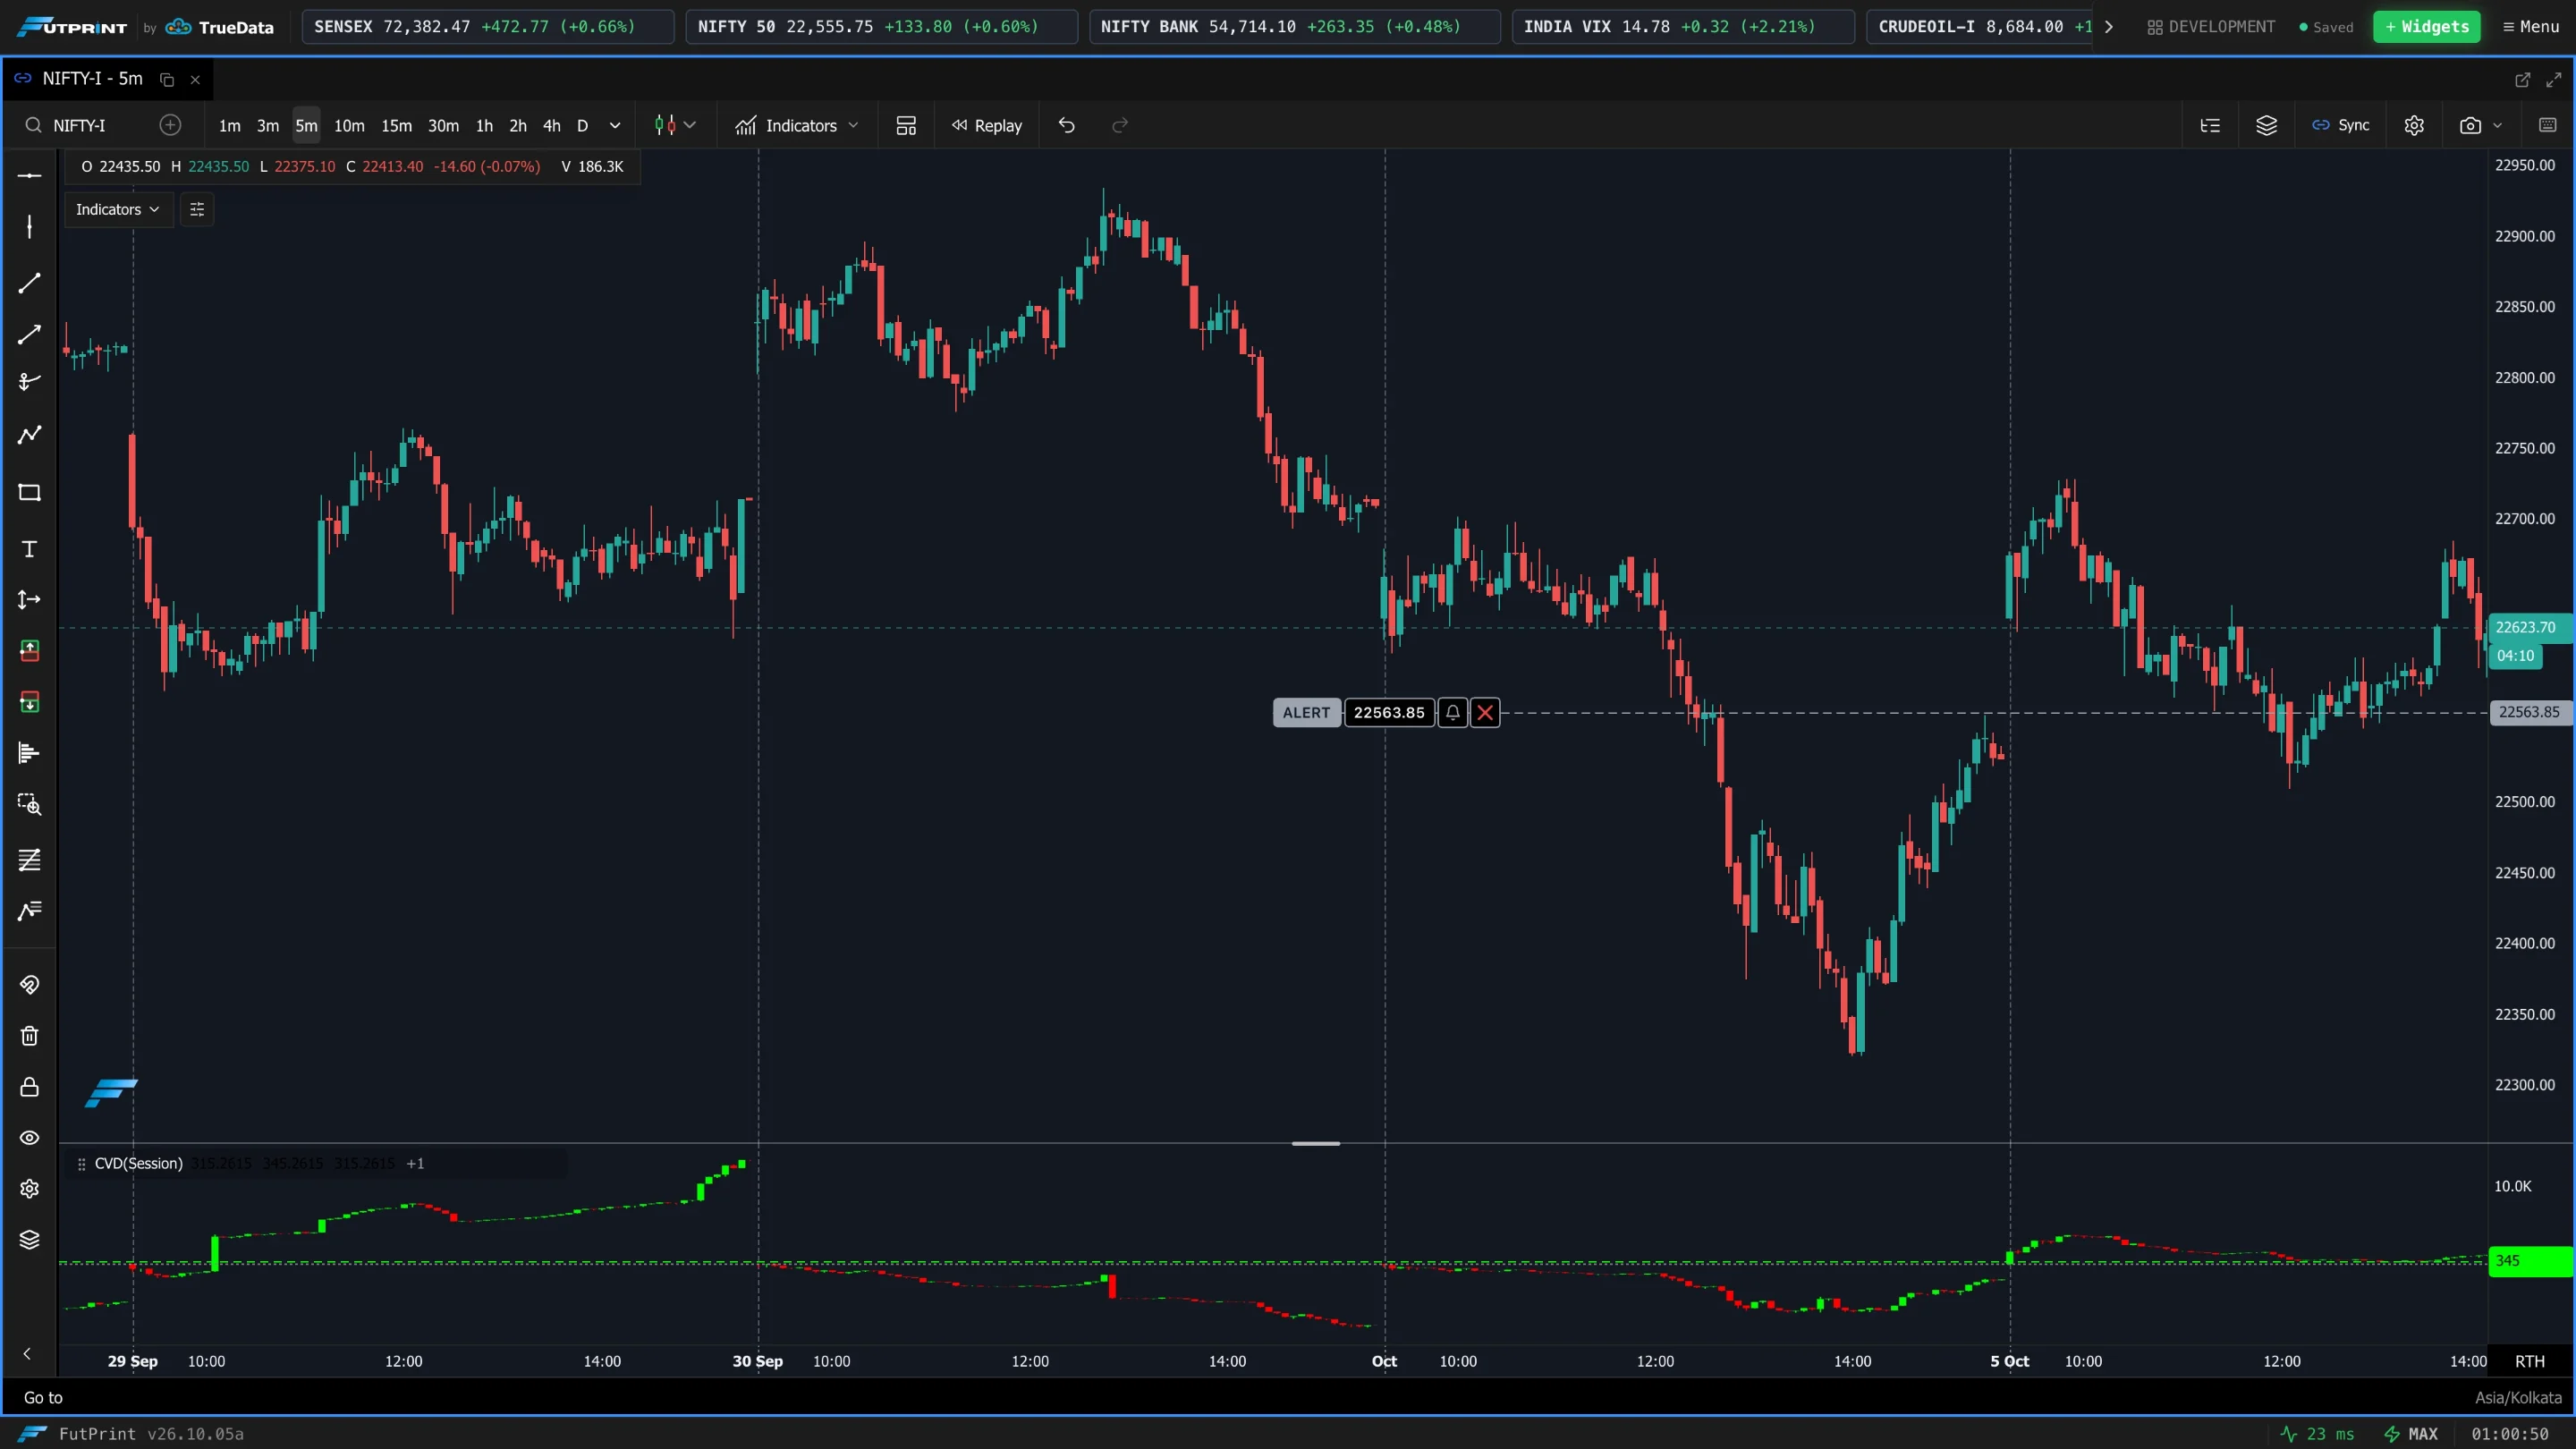
Reading CVD
- Agreement — price and CVD rising (or falling) together: the move is backed by aggressive orders.
- Divergence — price makes a new high while CVD does not (or a new low while CVD does not): the move is not backed by aggressive orders and is more likely to stall.
- Absorption — CVD moves strongly while price barely moves: passive orders are absorbing the aggression.
Settings
Open Indicators, click the CVD entry under Added, and use the Settings pane.
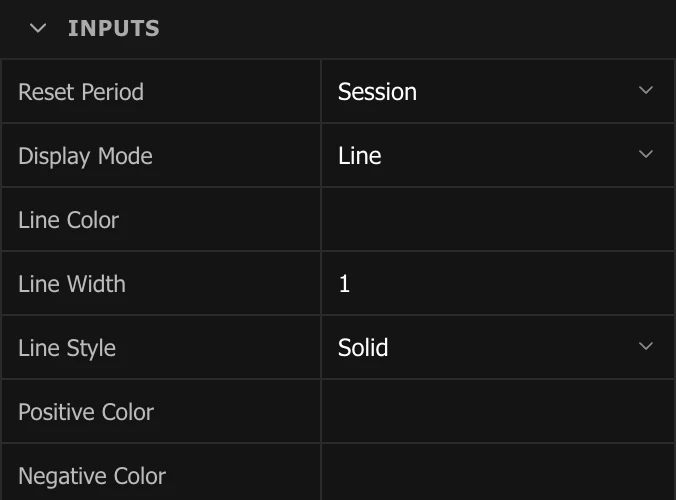
| Setting | What it does |
|---|---|
| Reset Period | When the running total restarts from zero: Session, Daily, Weekly or Monthly. |
| Display Mode | Line or Histogram. |
| Line Color, Line Width, Line Style | Appearance of the line (style is Solid, Dashed or Dotted). |
| Positive Color / Negative Color | Colours used above and below zero. |
Reset Period
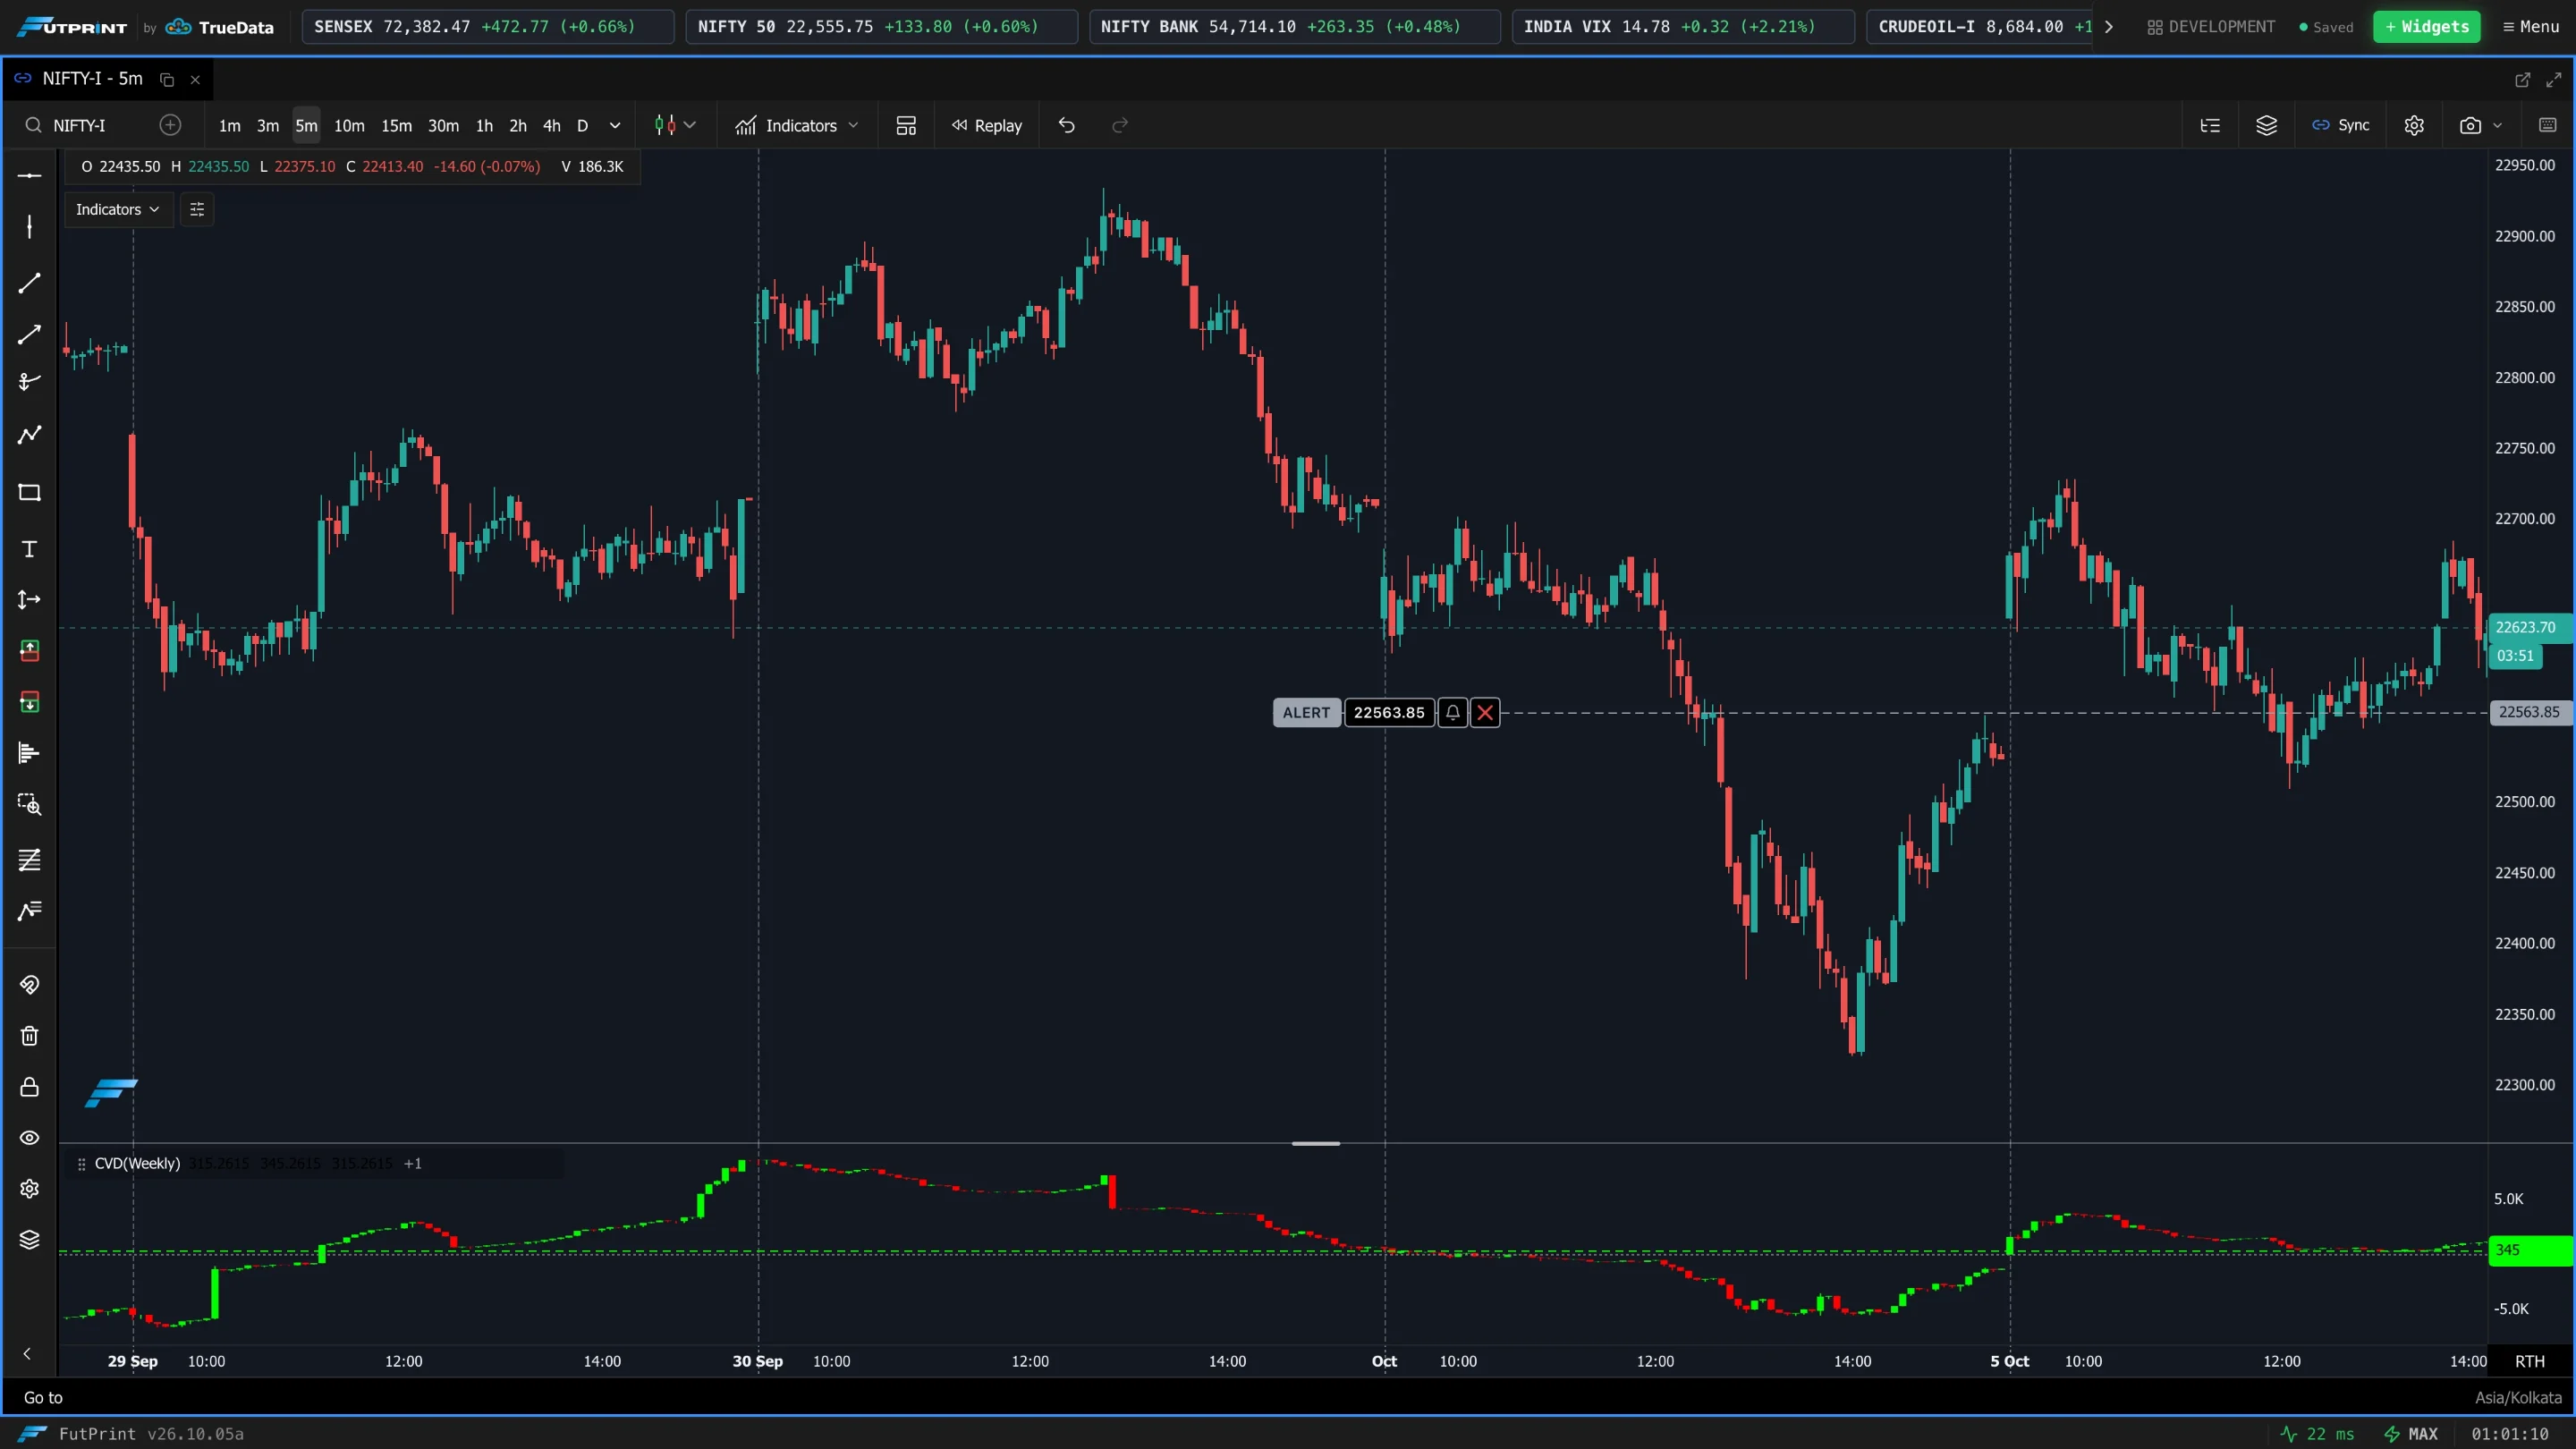
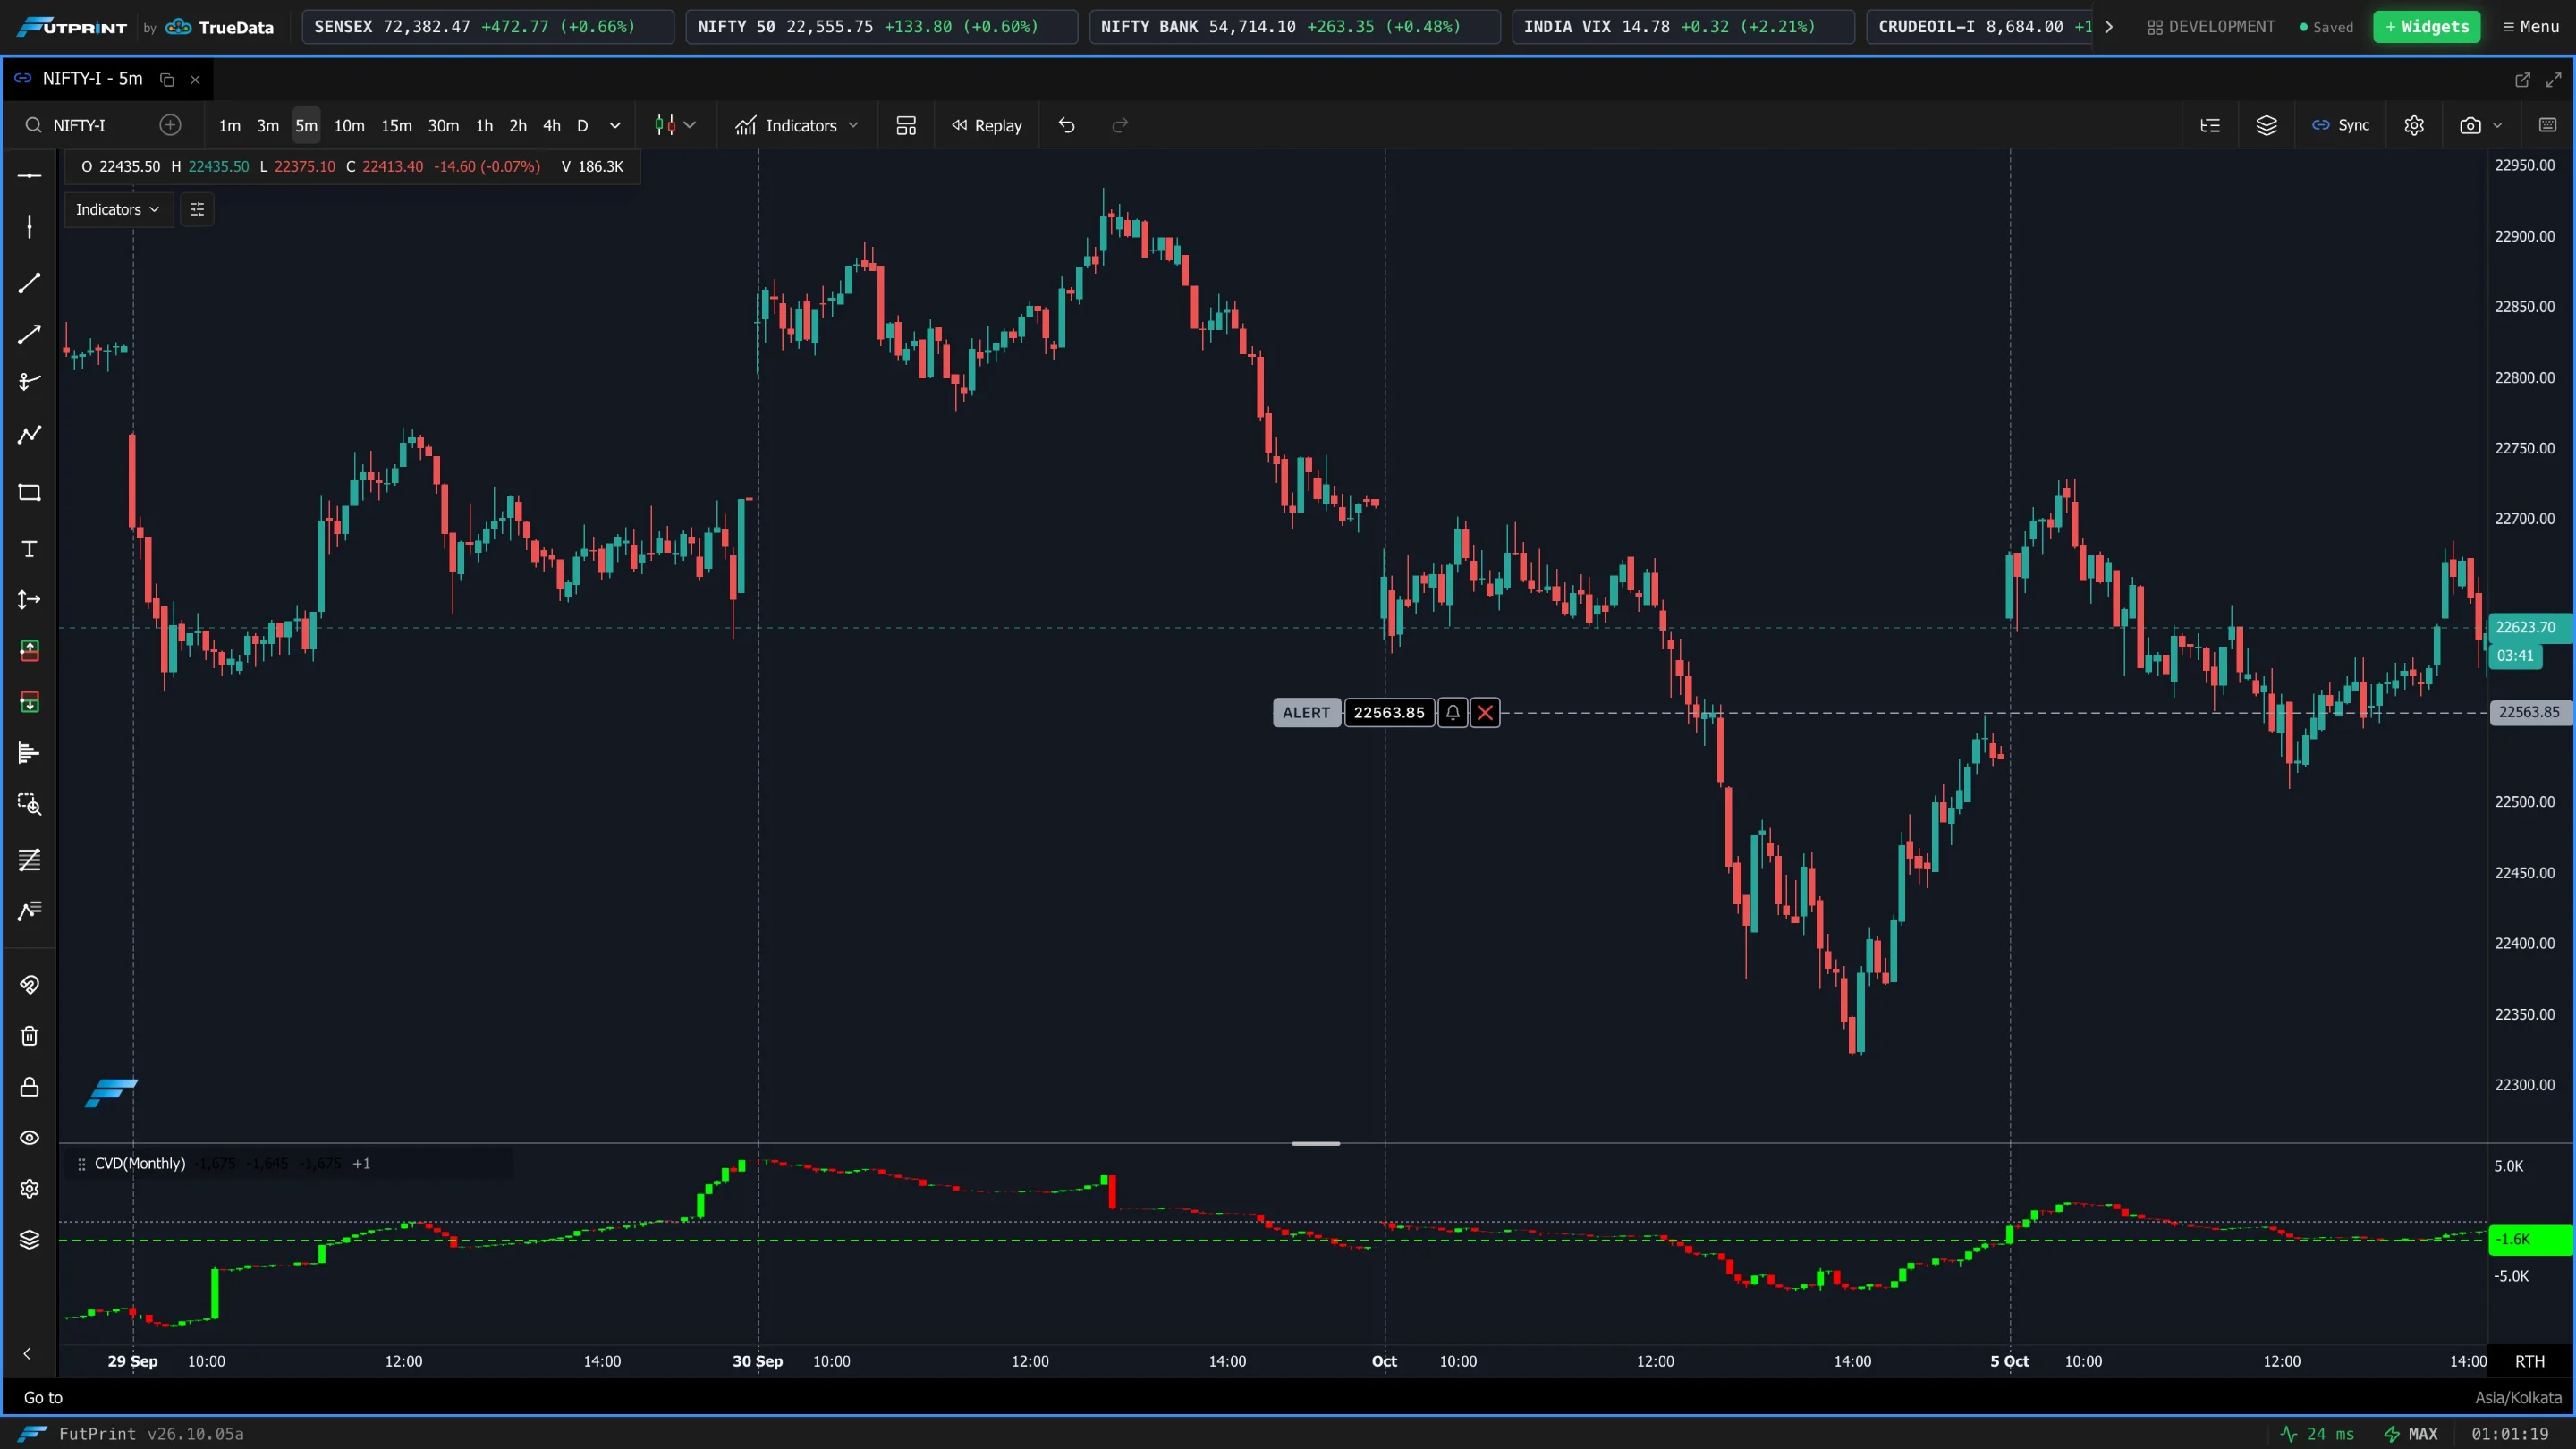
Use Session to compare one day's pressure with the next. Use Weekly or Monthly to see whether buying or selling has persisted across days.
Display Mode
Line Width
Note
The values follow the chart's Format Volume and Lot Size settings, so CVD reads in the same units as the footprint.