Watchlist
The Watchlist is a live, streaming table of the symbols you follow. Each row updates tick-by-tick and can show anything from a simple last price to a full set of quote fields, an intraday sparkline, and a tick-by-tick trend tape.
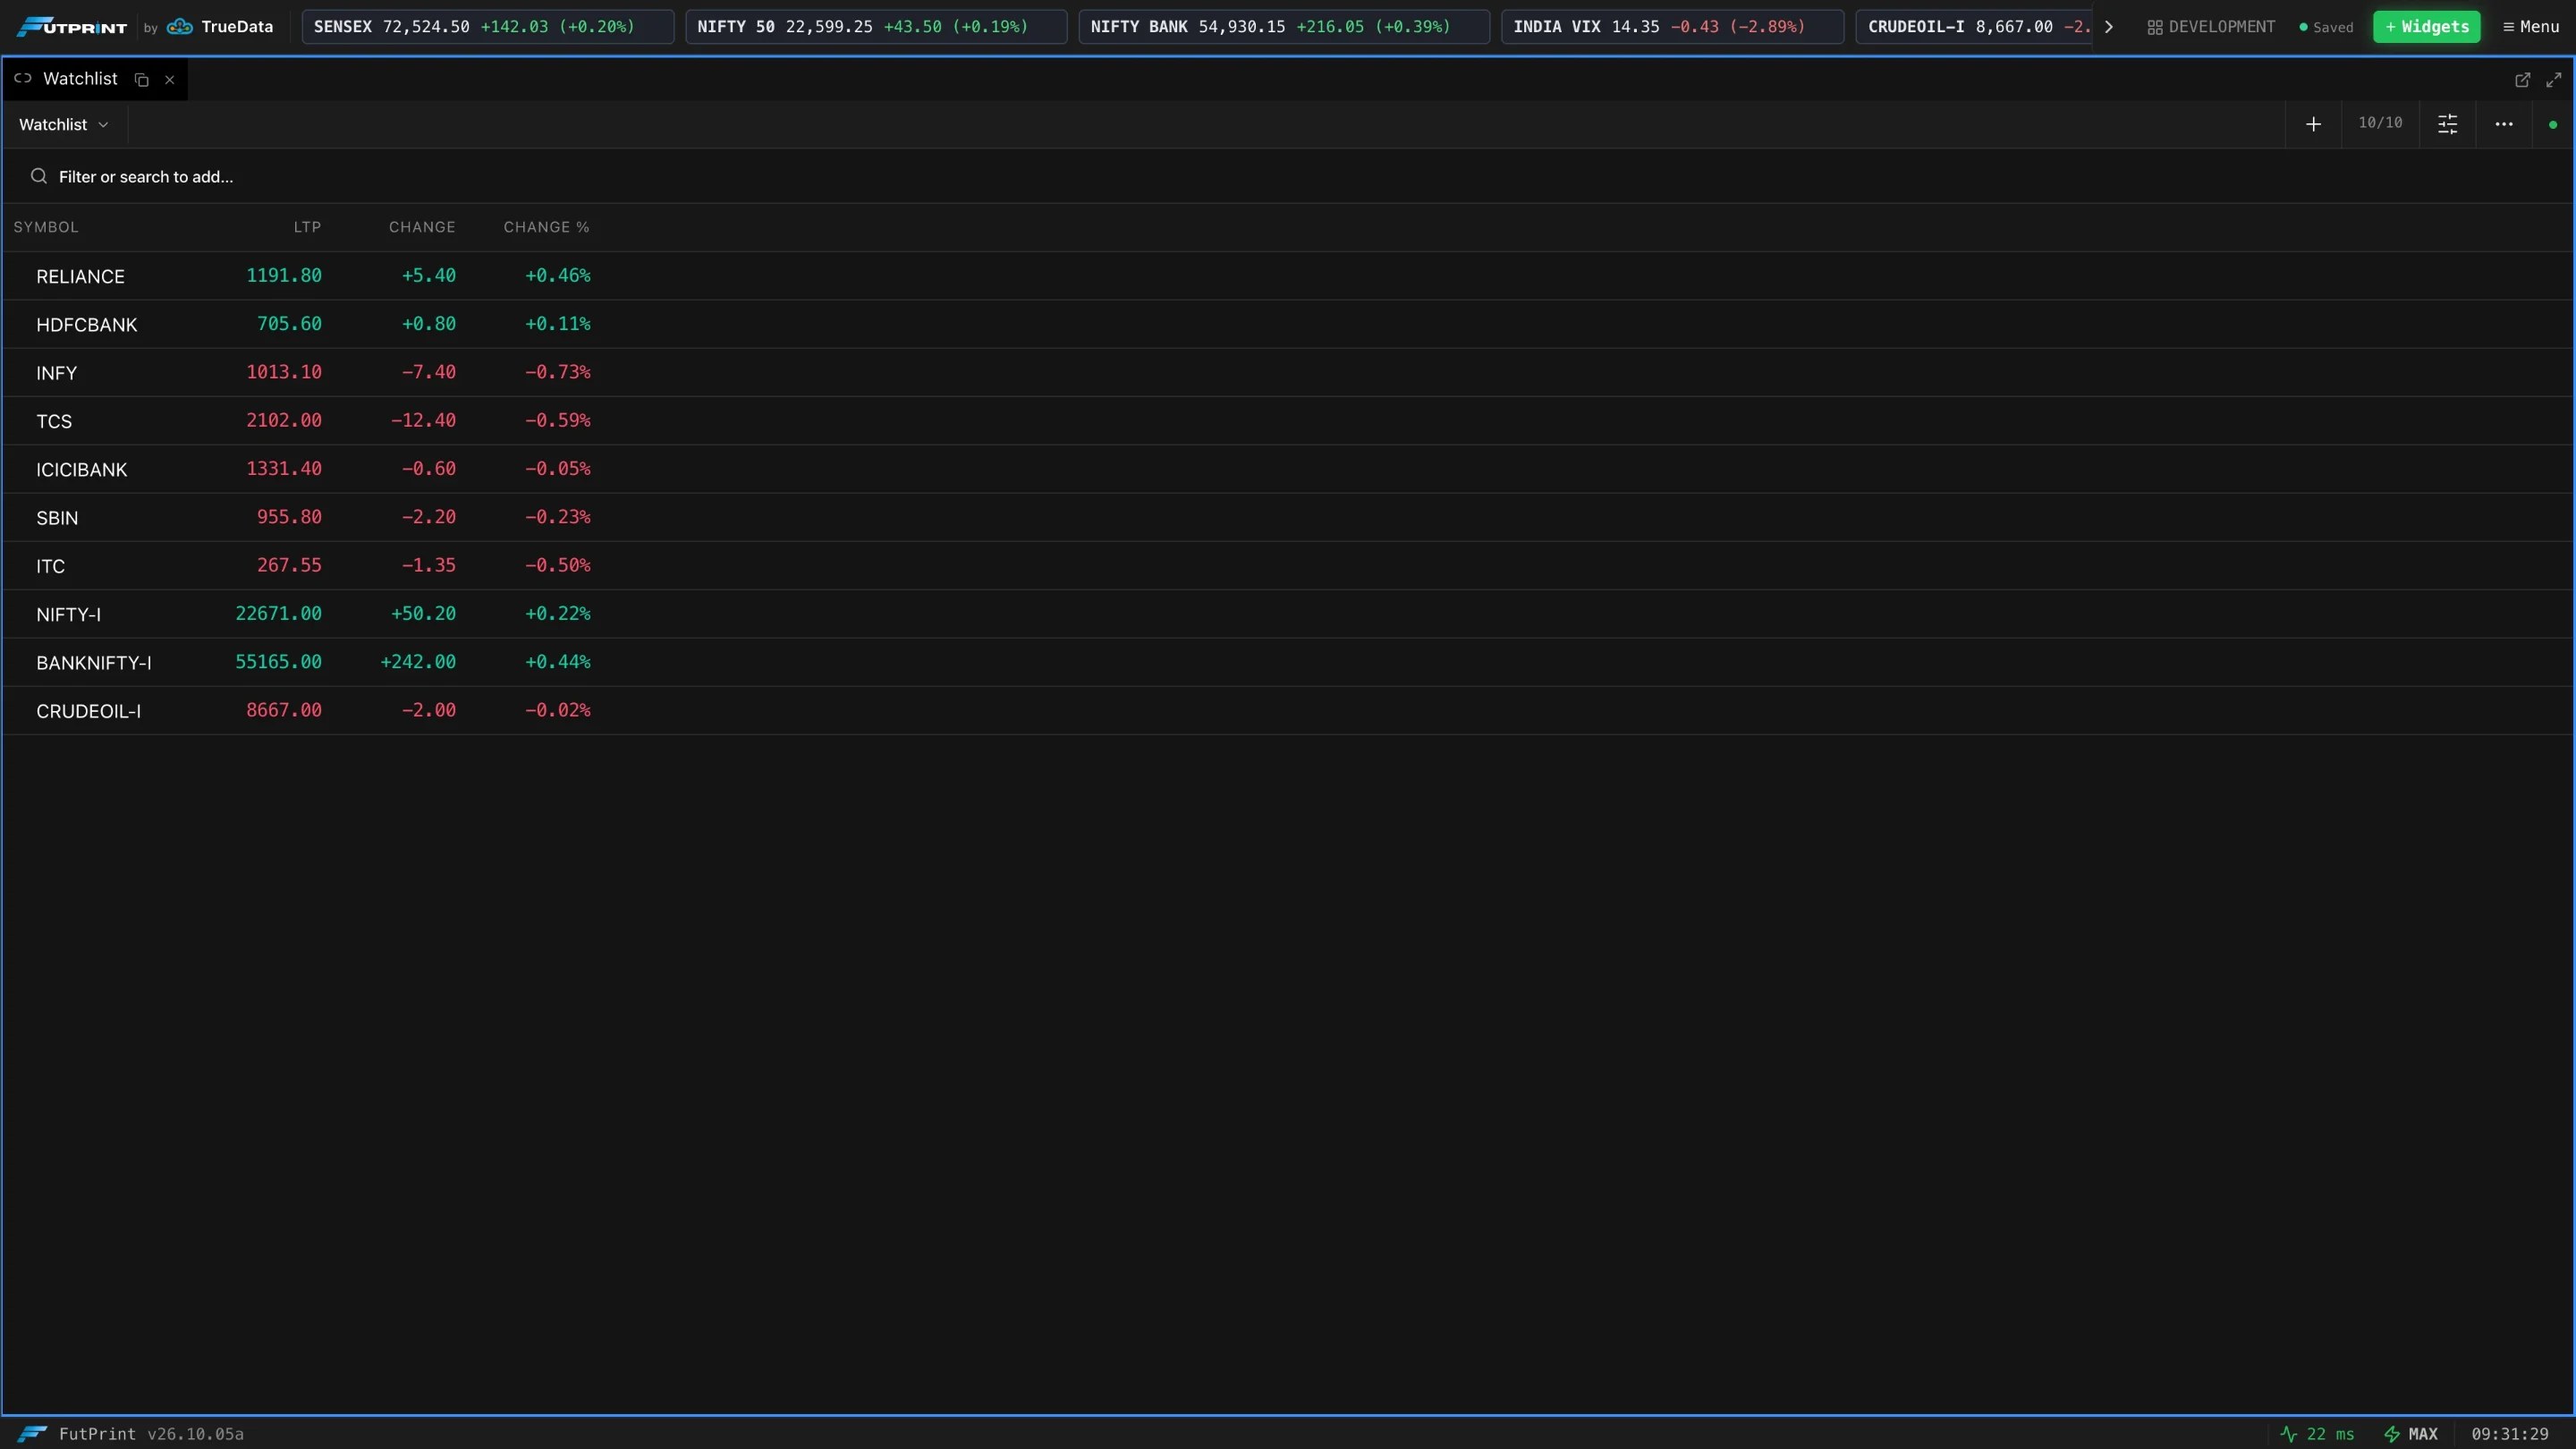
The toolbar
Along the top of the panel:
| Control | Location | What it does |
|---|---|---|
| Switch watchlist | Far left | Shows the current list's name. Open it to switch between your watchlists or create a New watchlist. |
Add symbols (+) | Right group | Opens the Add Symbols dialog. |
| Count | Right group | Symbols shown out of the total (for example 10/10), so you can see when a filter is hiding rows. |
| Column visibility (sliders) | Right group | Opens the column menu (below). |
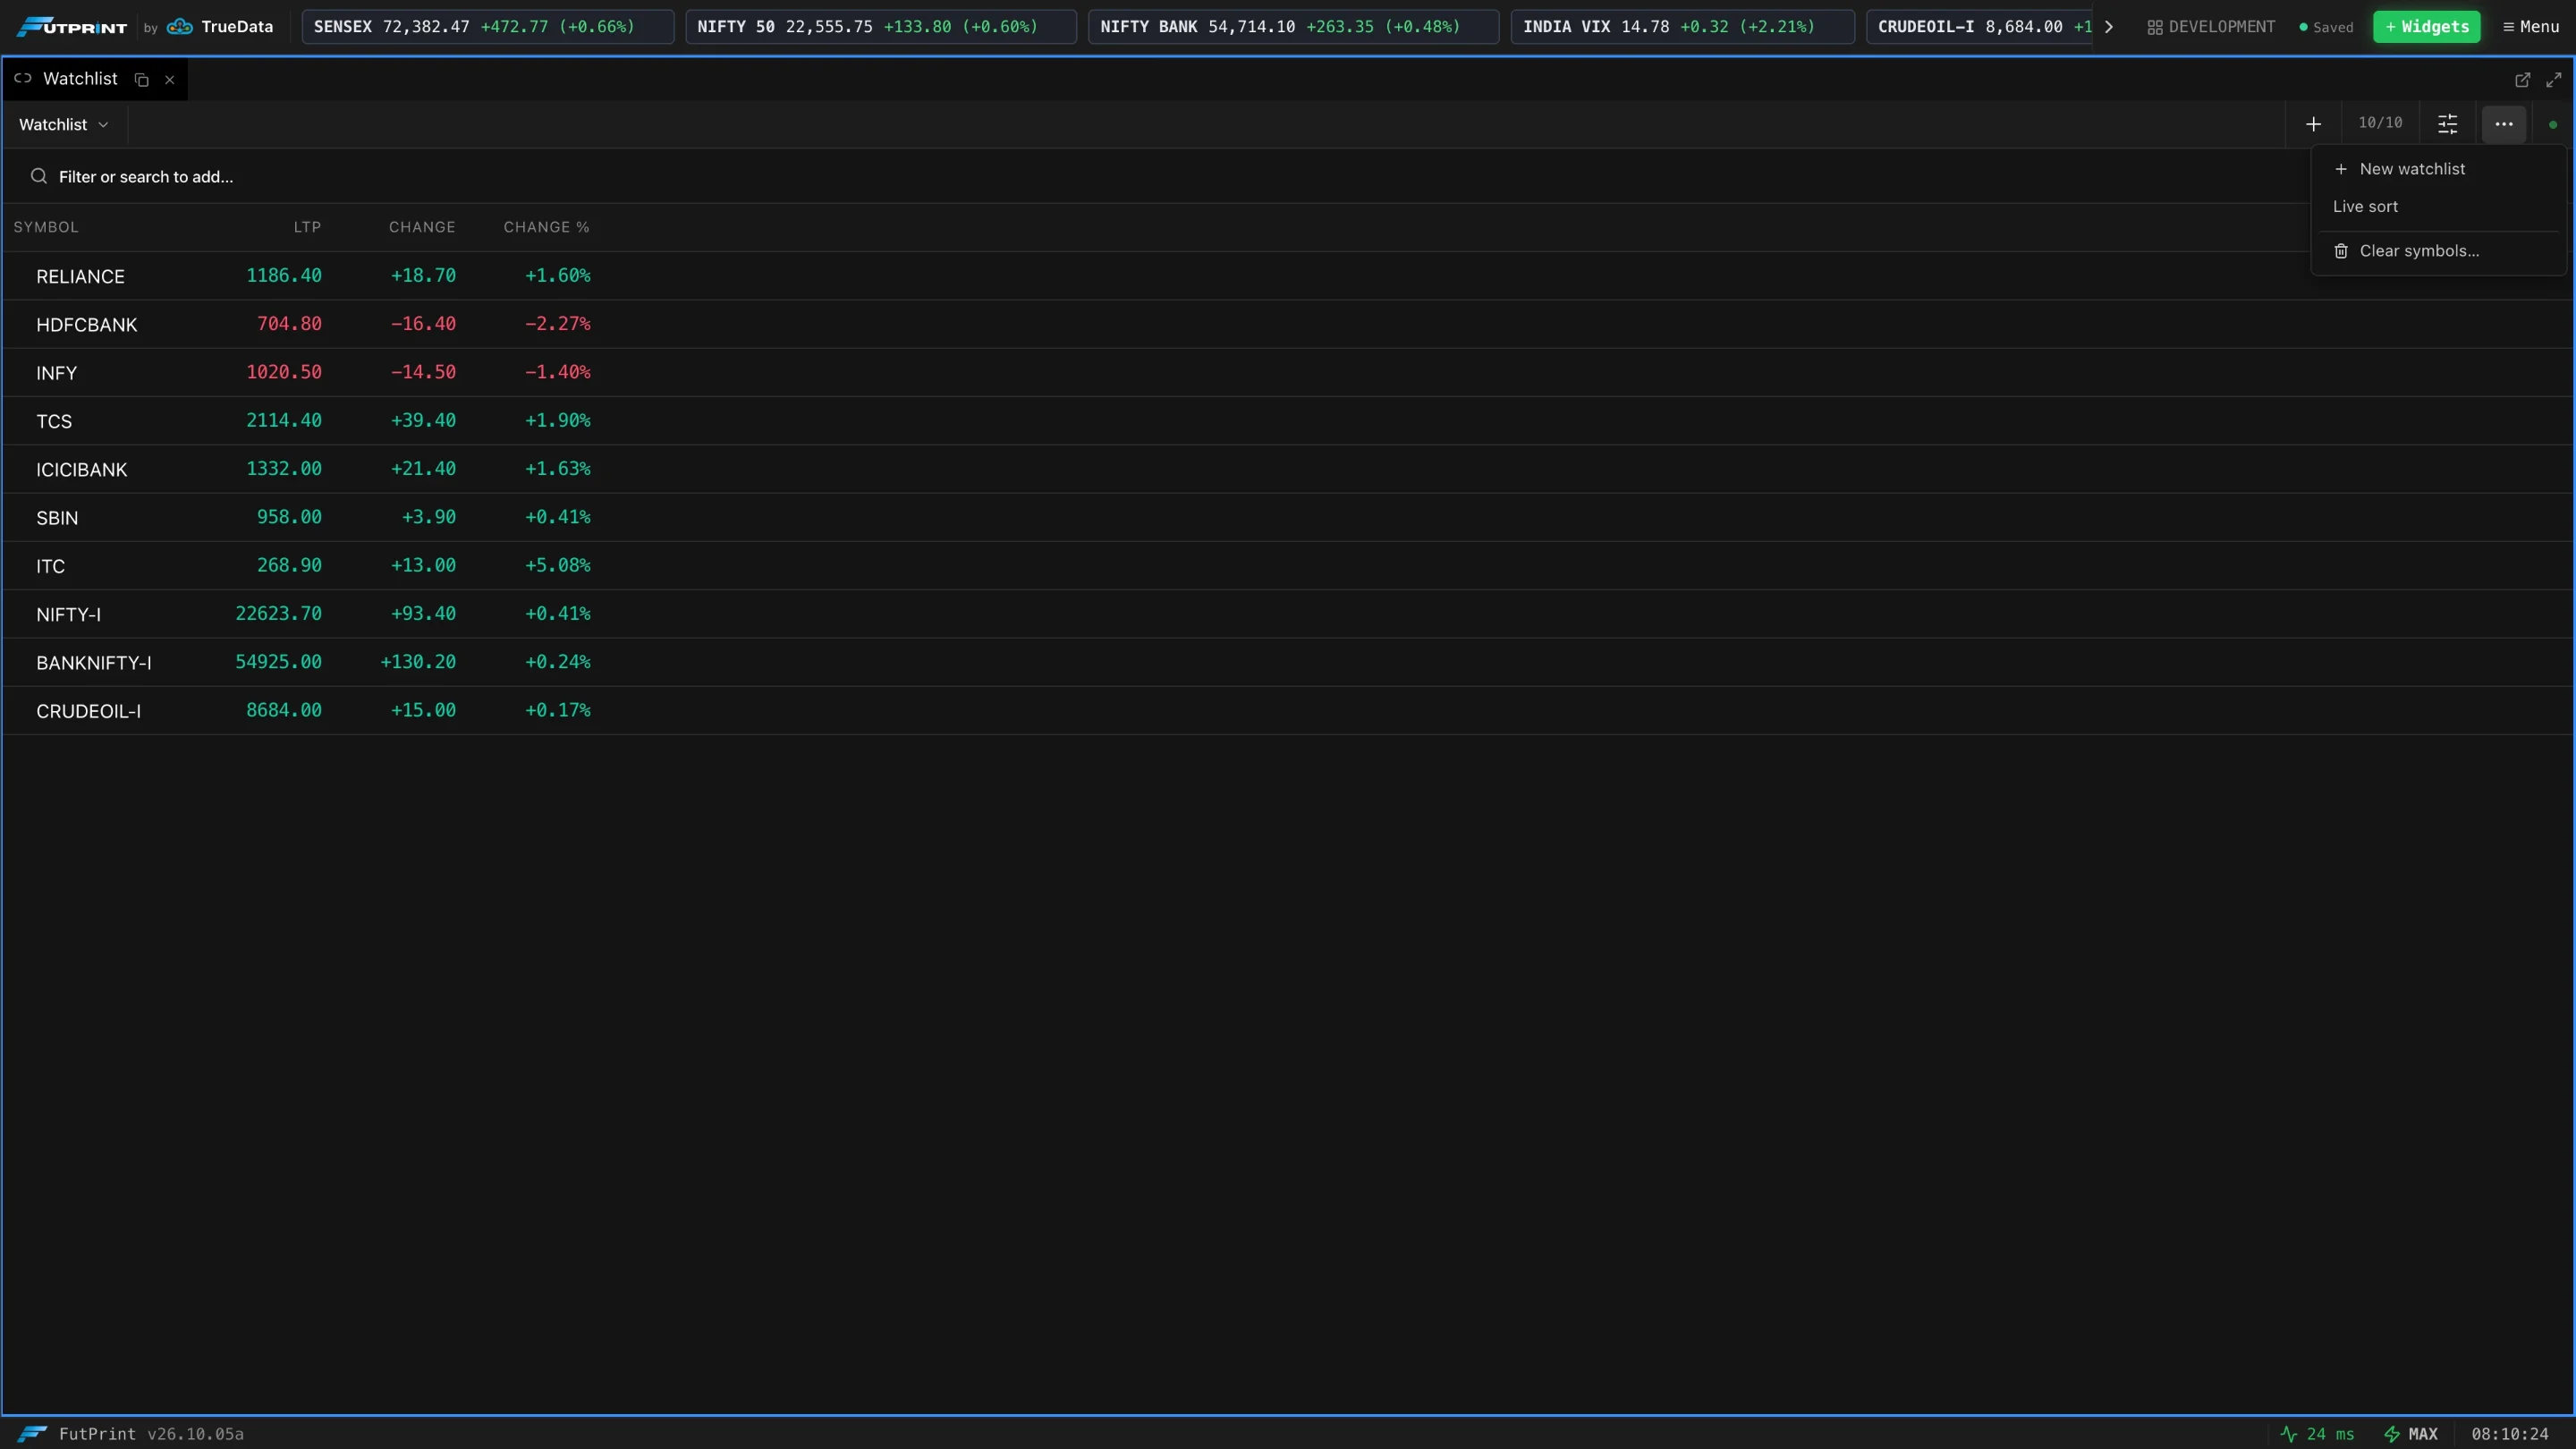
More watchlist actions (…) | Right group | New watchlist, Live sort and Clear symbols…. |
| Status dot | Far right | Green while the list is receiving live data, red when it is not. |
If the panel is too narrow to show the whole toolbar, ‹ › arrows appear at the edges to scroll it.
Adding and removing symbols
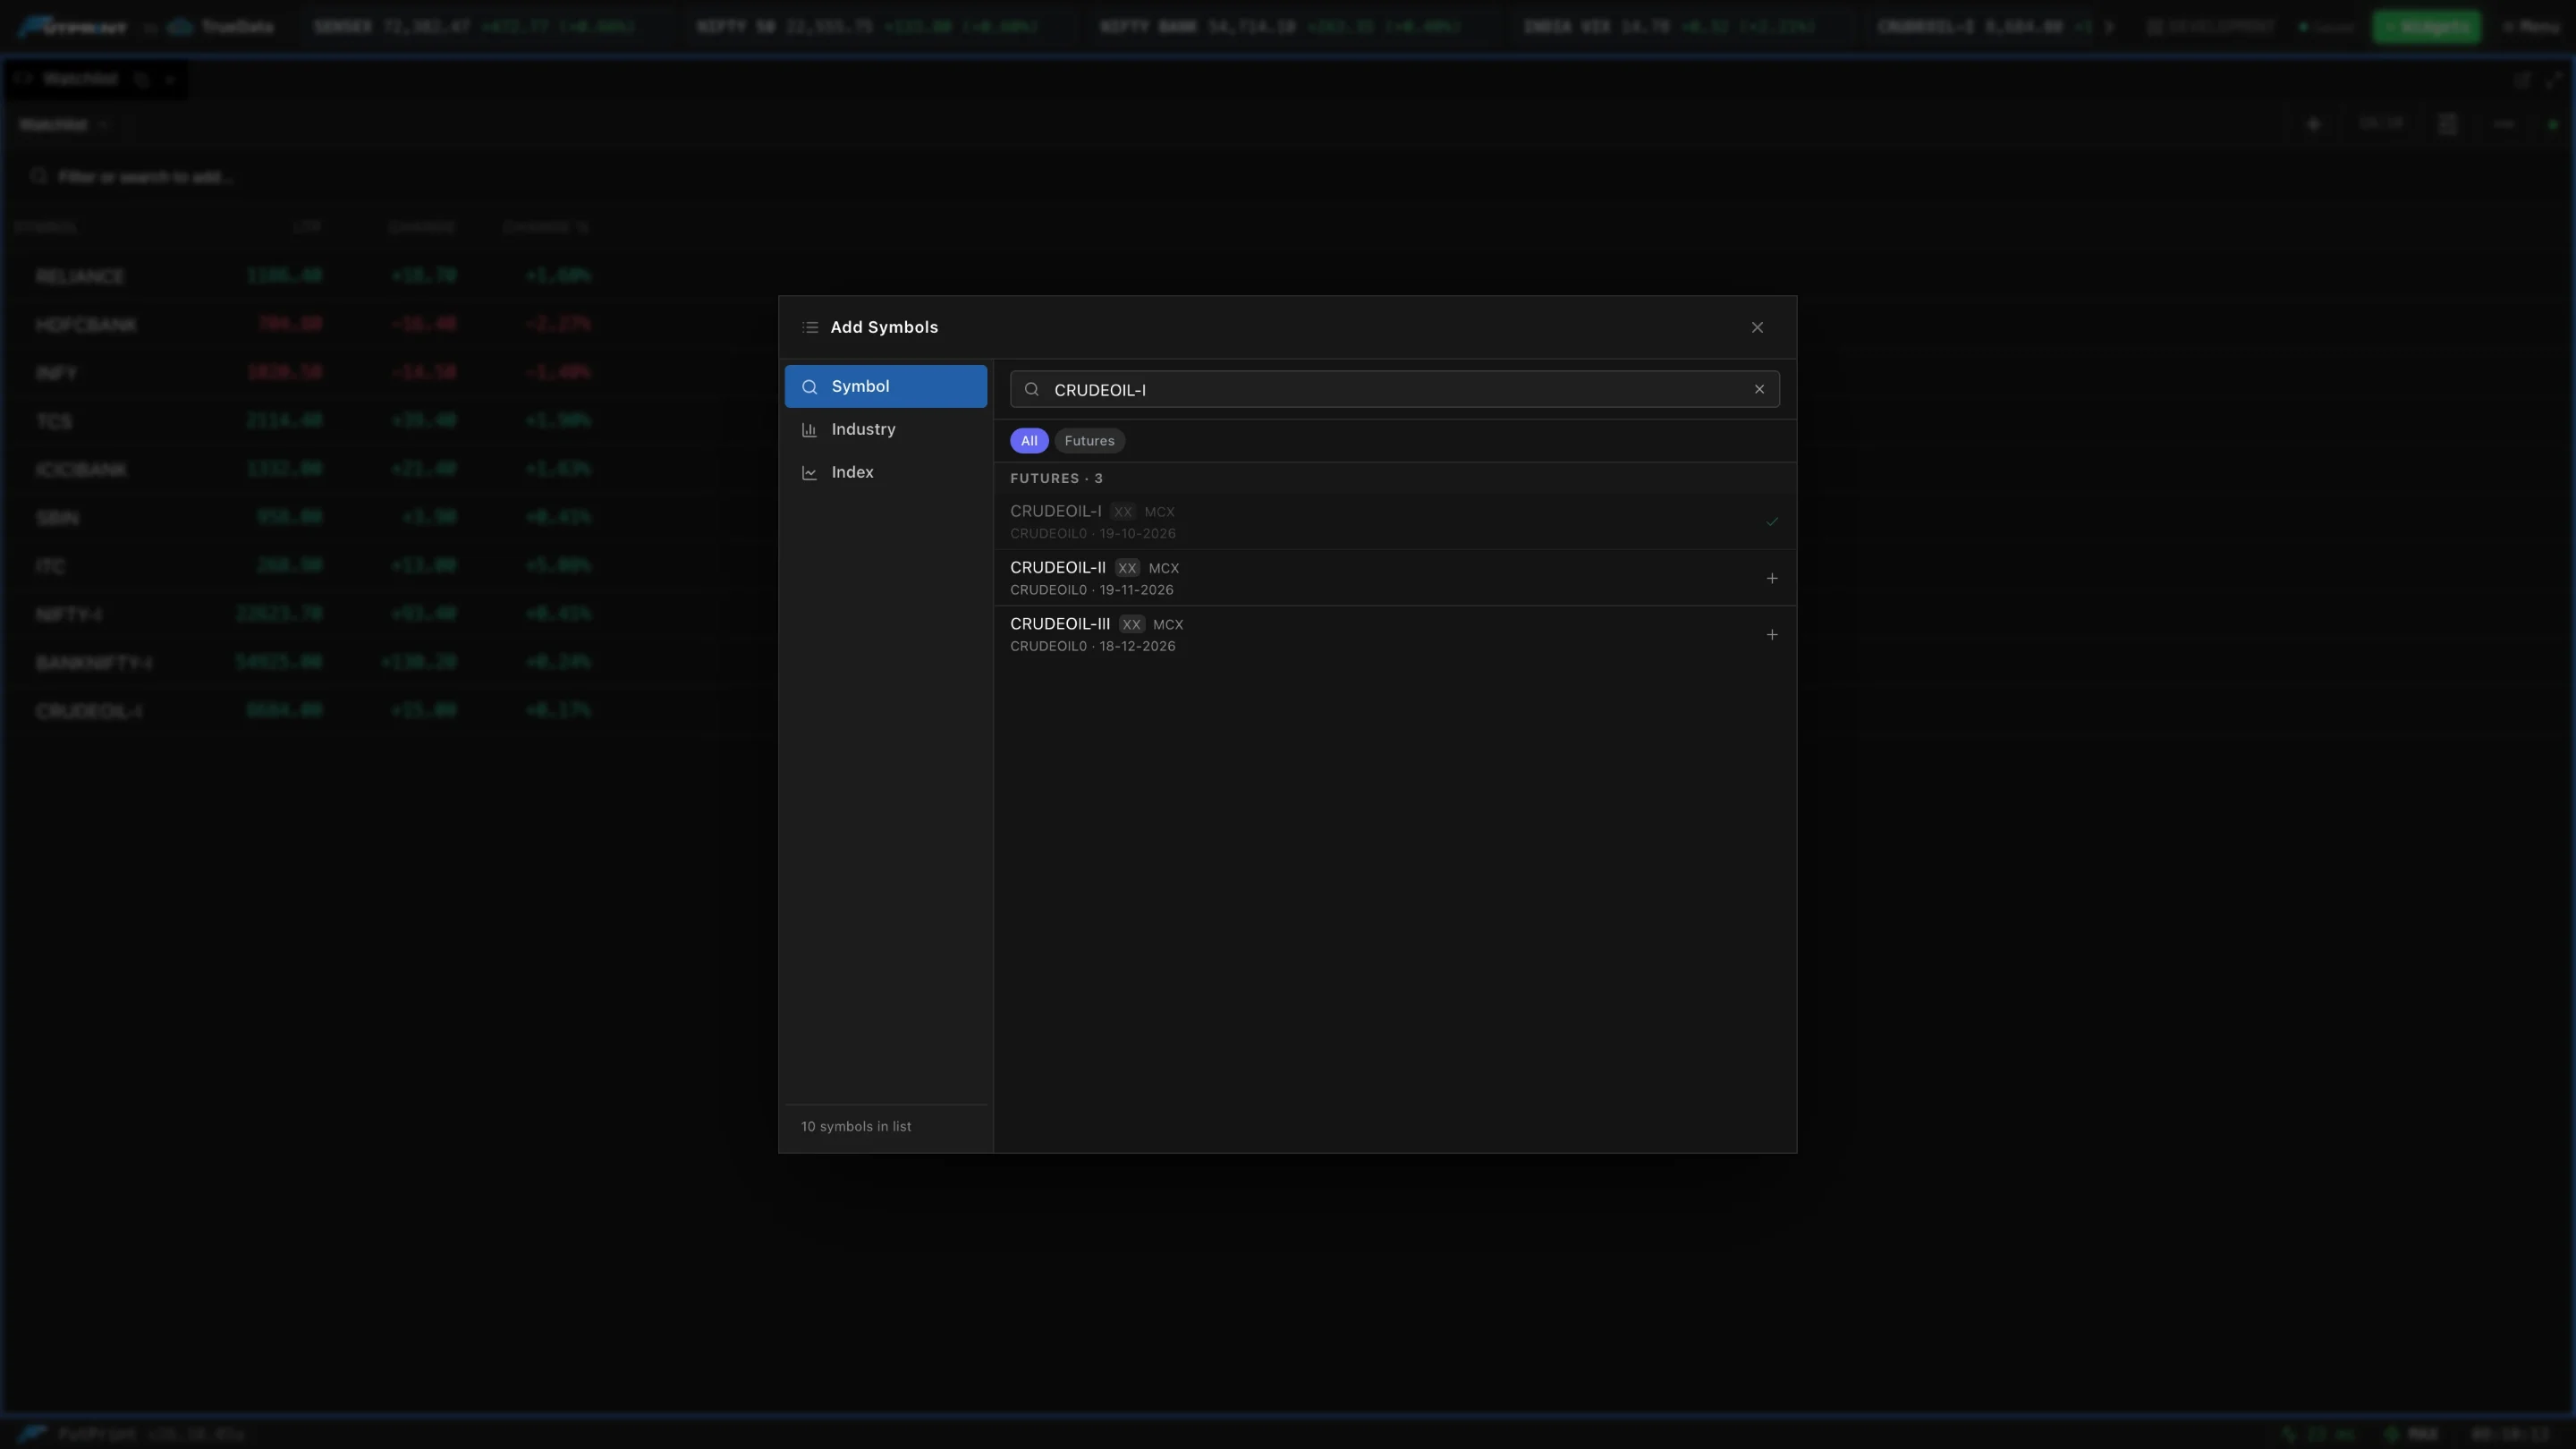
- Add: click +, type in the search box and press the + beside a result. The dialog stays open so you can add several, and shows how many symbols are in the list. Use the All / Spot/Cash / Futures / Options / Others chips to narrow the results, or the Industry and Index tabs to add by group.
- Remove one: hover the row and click Remove.
- Remove all: More watchlist actions ▸ Clear symbols….
Several watchlists
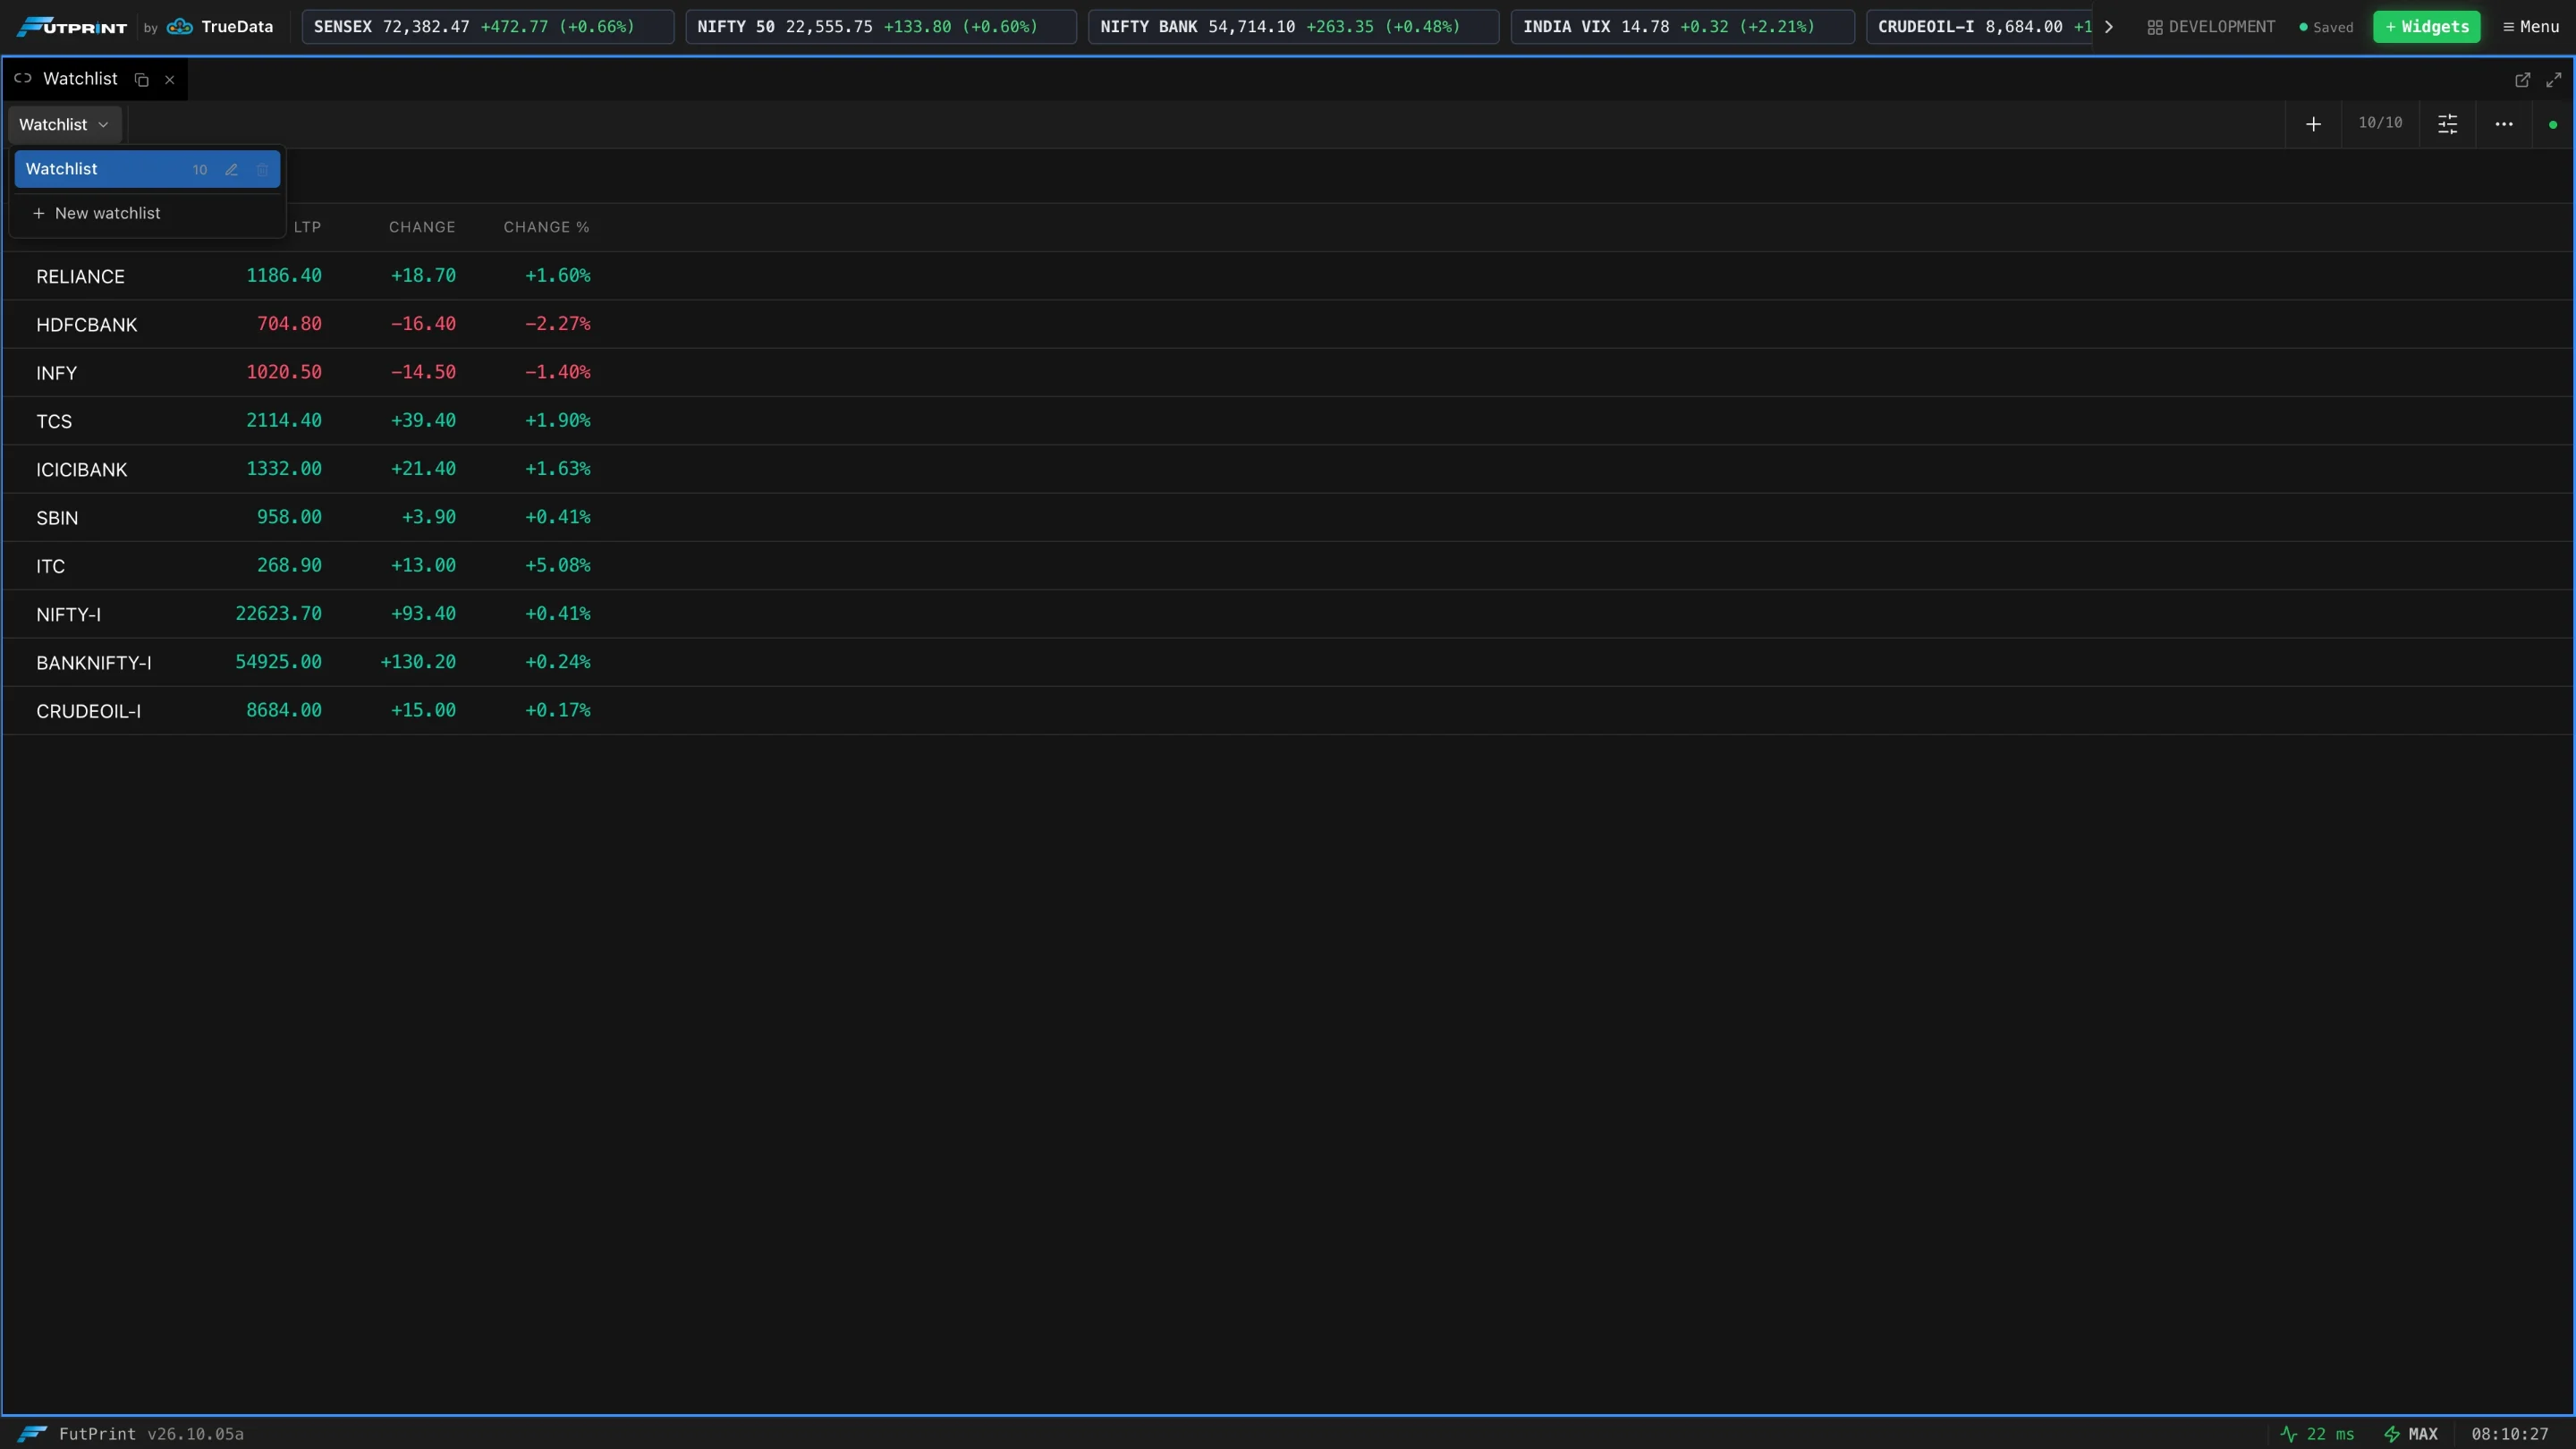
You can keep separate lists for different setups. Switch watchlist (or More watchlist actions ▸ New watchlist) creates another list; the same menu switches between them and shows how many symbols each holds.
Filtering
Once you have symbols, a Filter symbols… box appears under the toolbar. It narrows the visible rows by symbol or name as you type. Clear it with the ✕ on the right. Filtering only changes what's shown — it doesn't remove anything, and the count badge reflects the filtered total.
Choosing columns
Open the Columns menu (sliders icon) to toggle any of these on or off:
| Group | Columns |
|---|---|
| Identity | Symbol, Exchange |
| Visuals | Spark (intraday line), T&S Trend (tick tape) |
| Price | LTP, Change, Change % |
| Quote | Bid, Ask, Spread, Bid Sz, Ask Sz, Last Size |
| Session | Prev Close, Open, High, Low, Volume, OI |
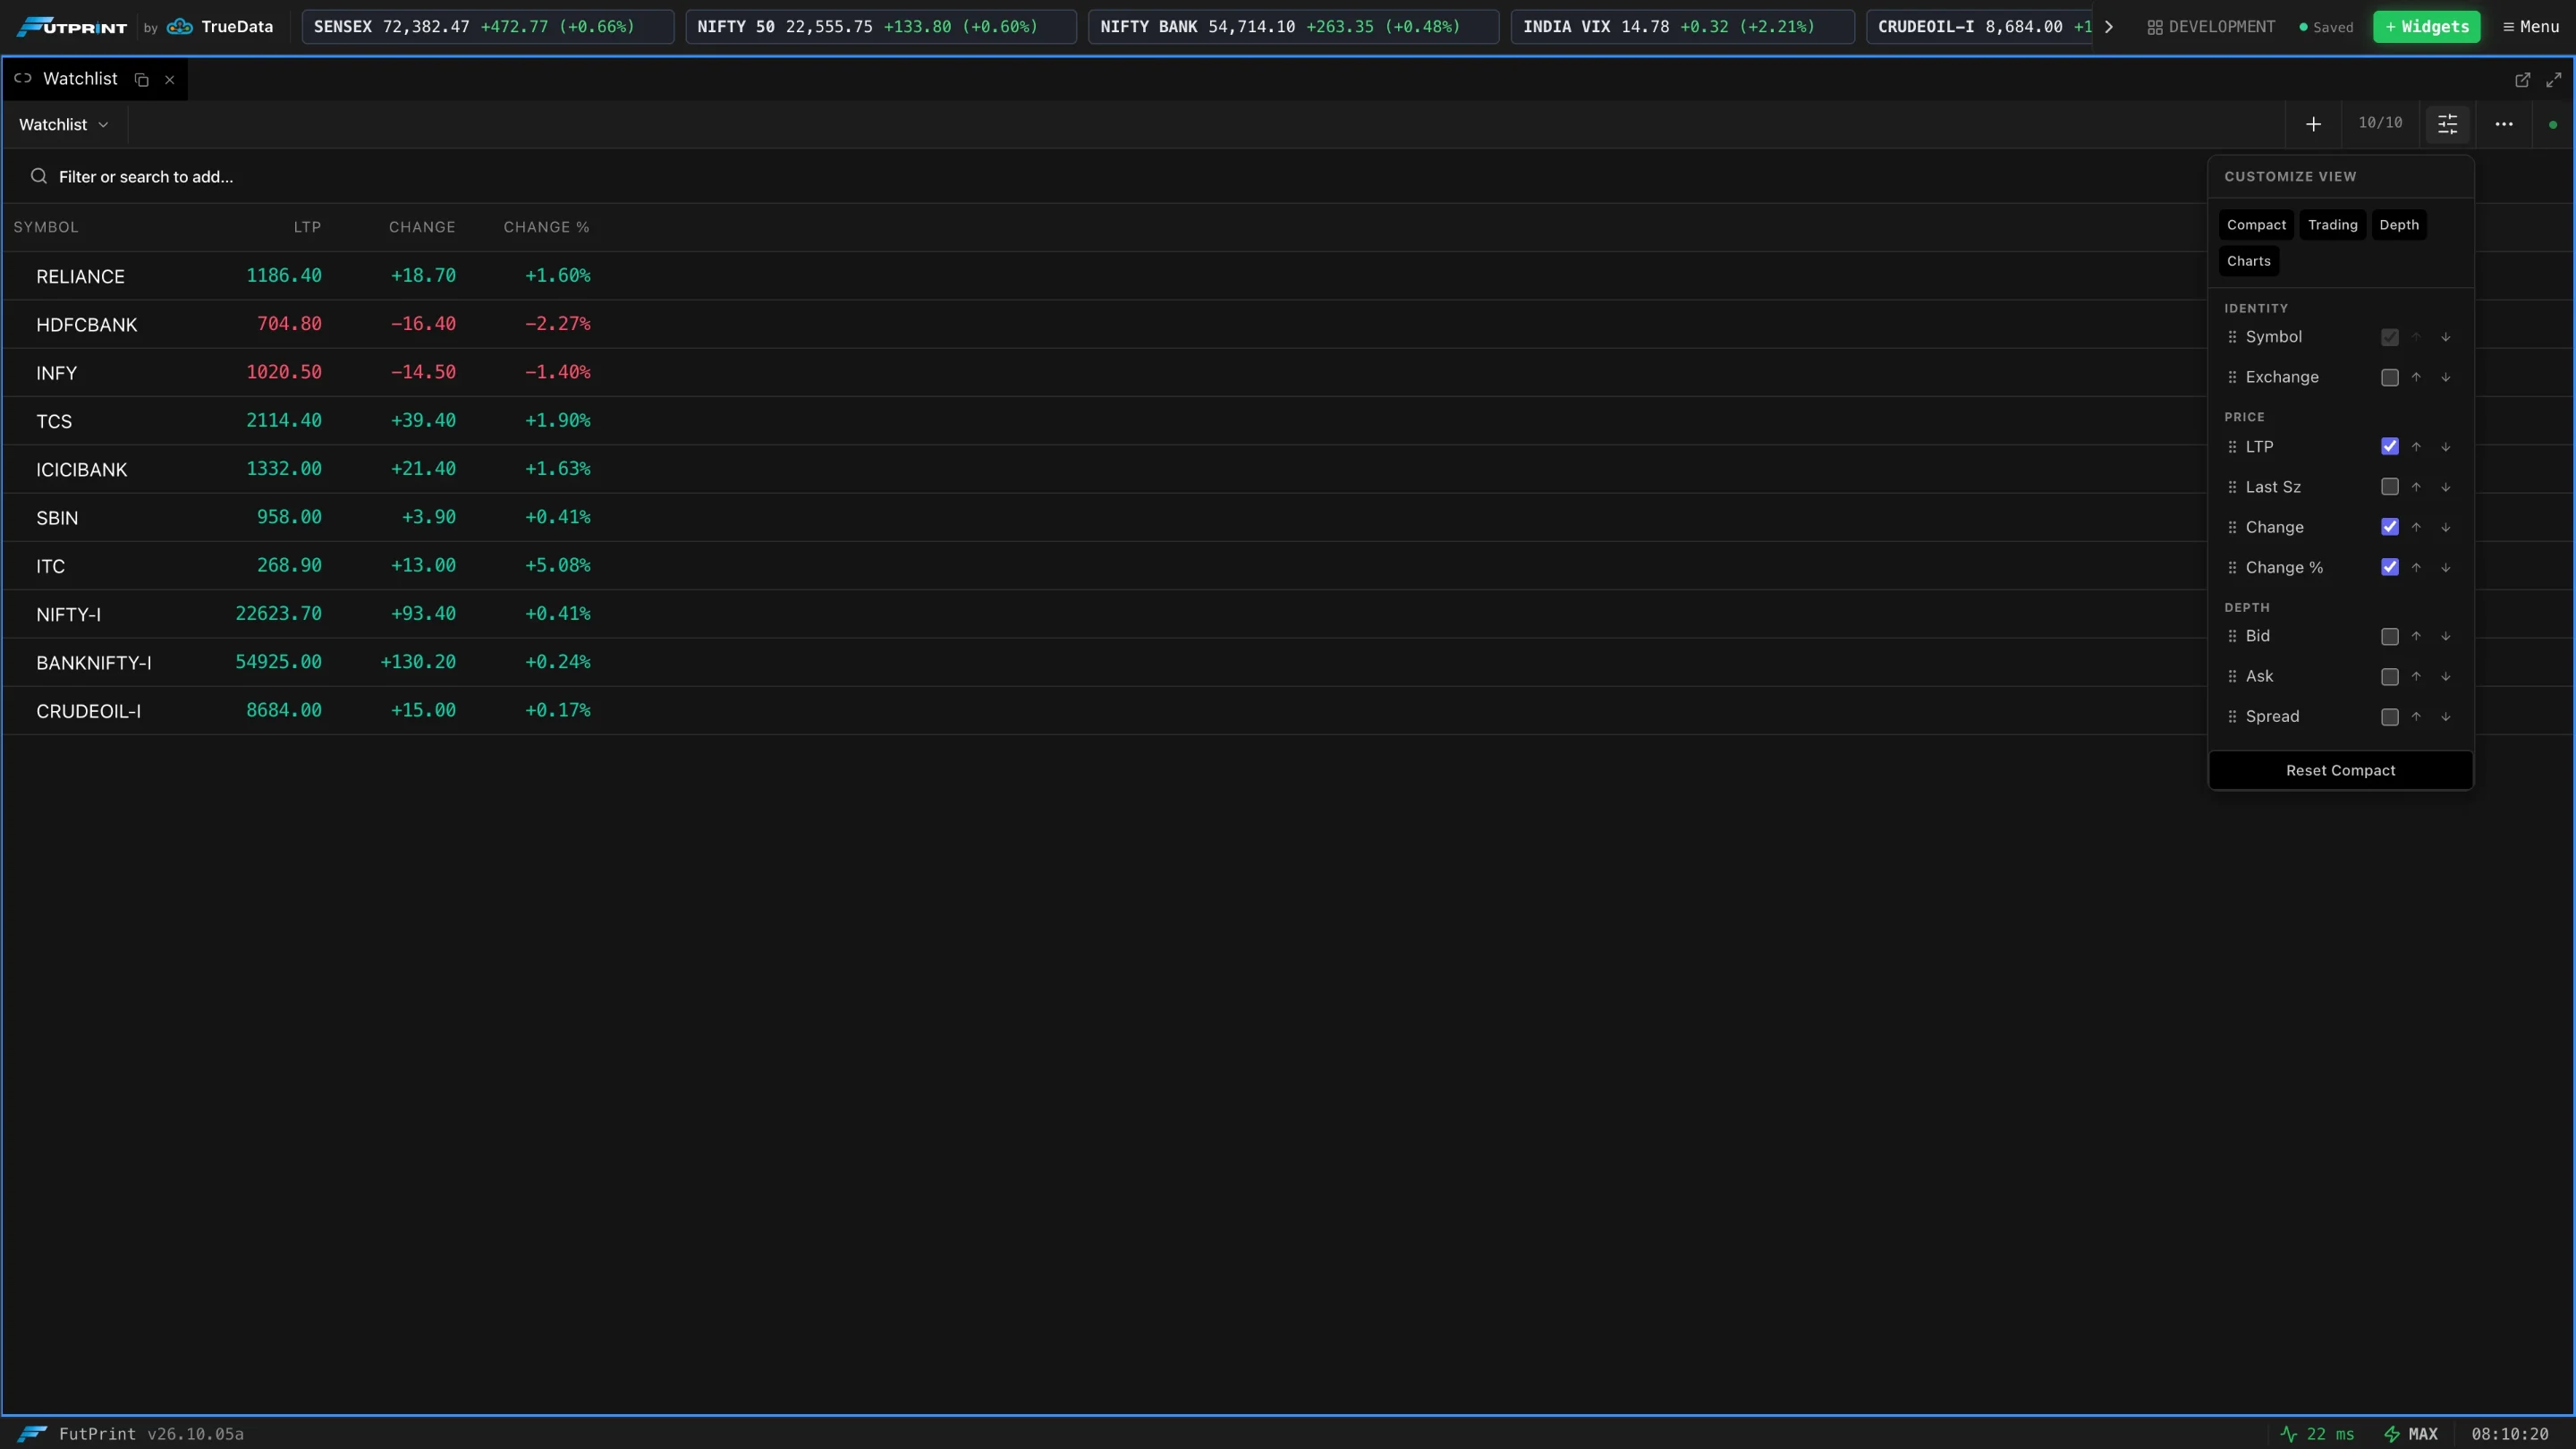
By default only Symbol, LTP, Change and Change % are shown. The Reset button at the bottom of the menu returns to the selected preset's columns. Your column choices are saved with the workspace.
Column presets
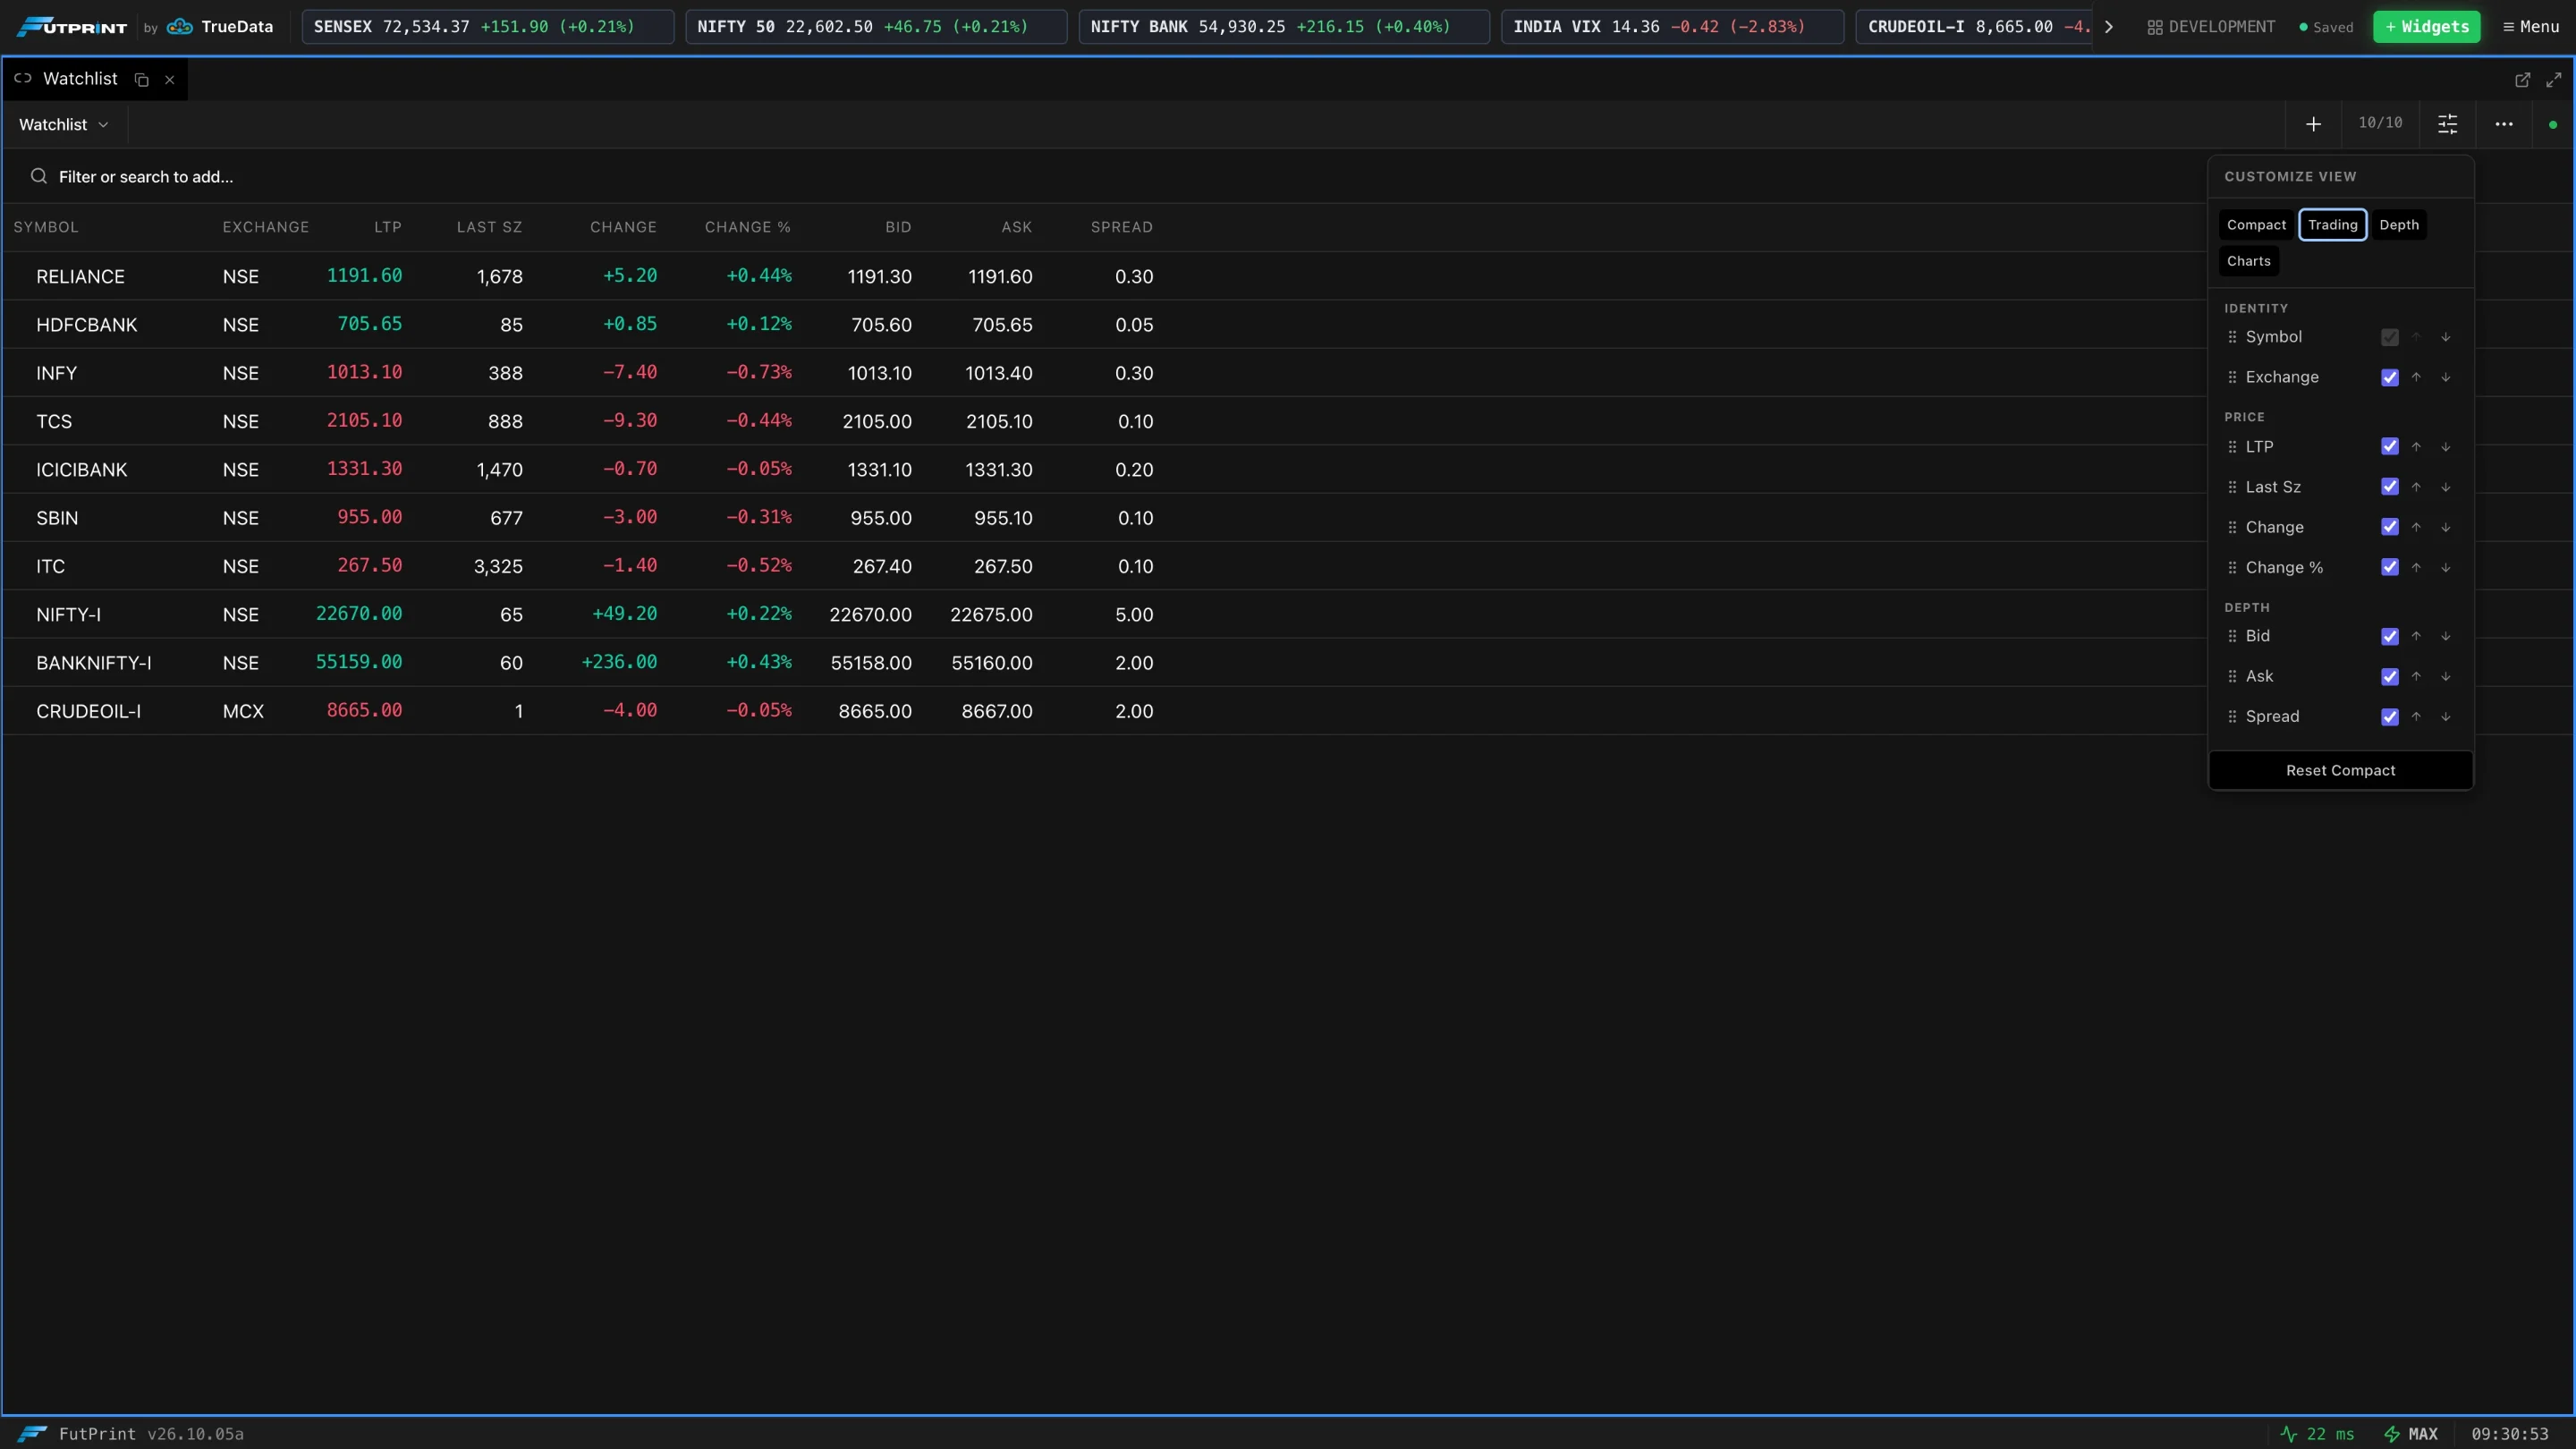
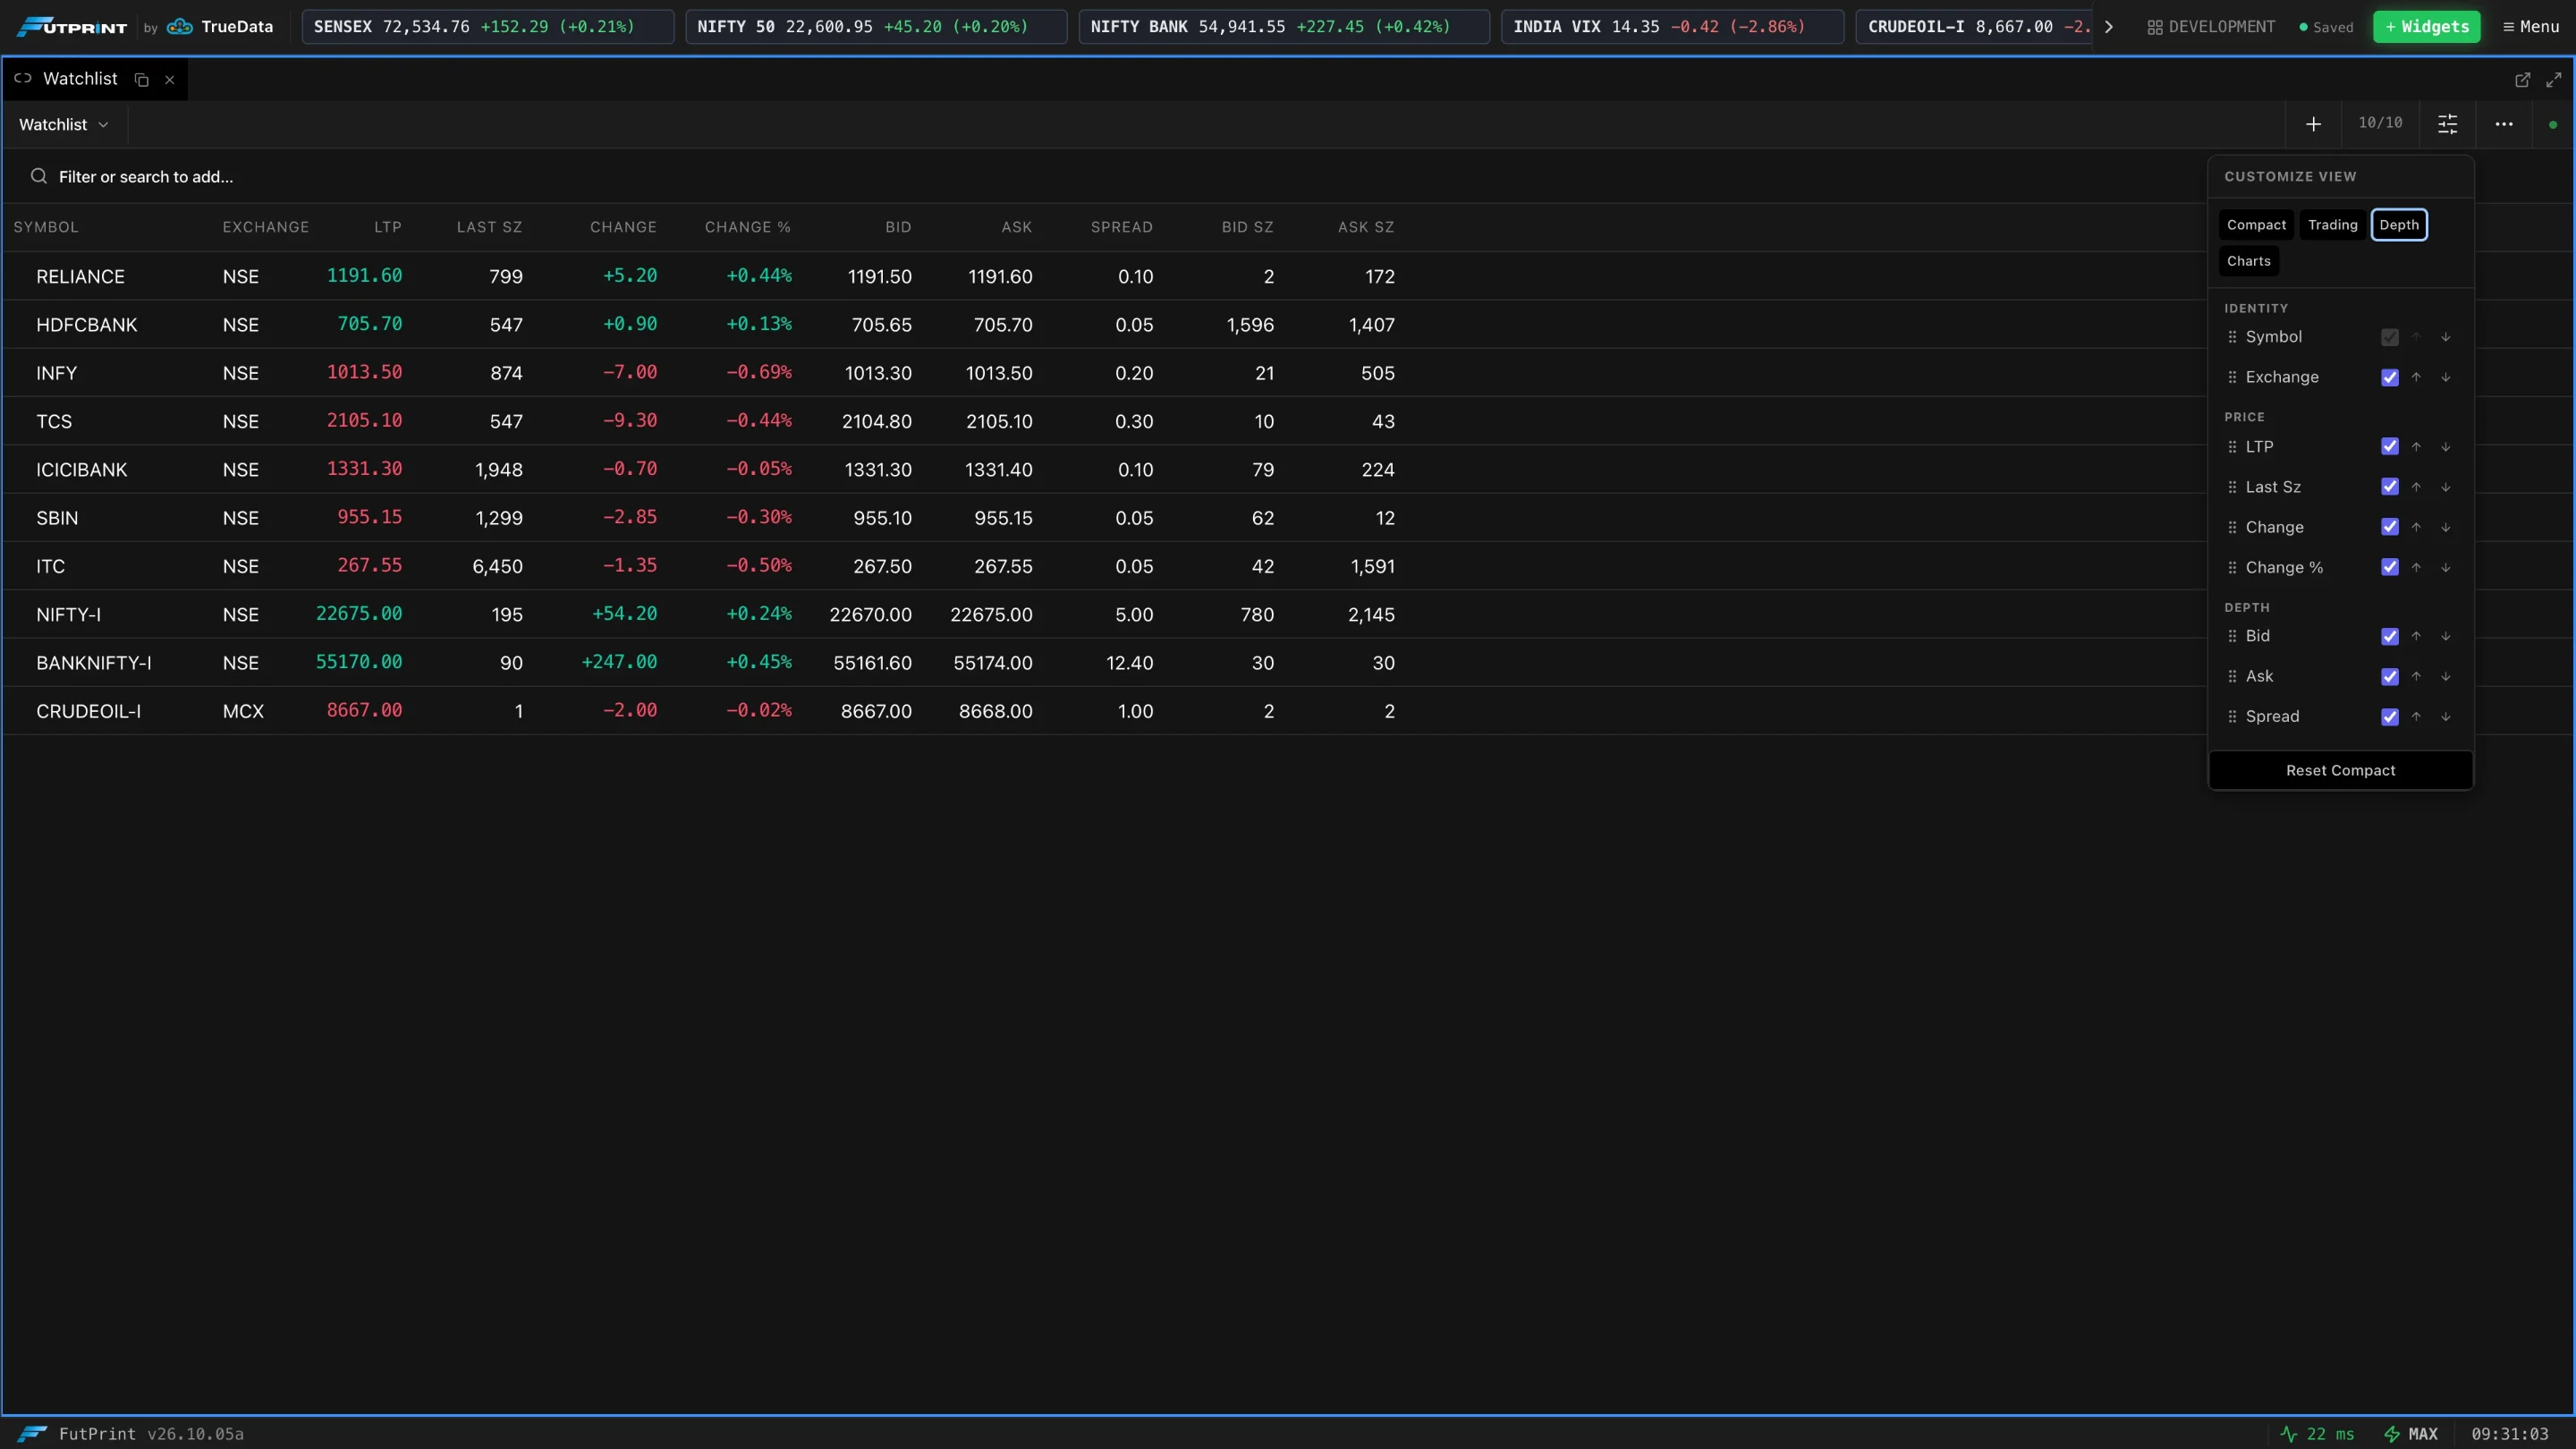
Four buttons at the top of the menu switch to a ready-made set of columns:
| Preset | Columns |
|---|---|
| Compact | Symbol, LTP, Change, Change %. |
| Trading | Adds Exchange, Last Sz, Bid, Ask and Spread. |
| Depth | Trading plus Bid Sz and Ask Sz. |
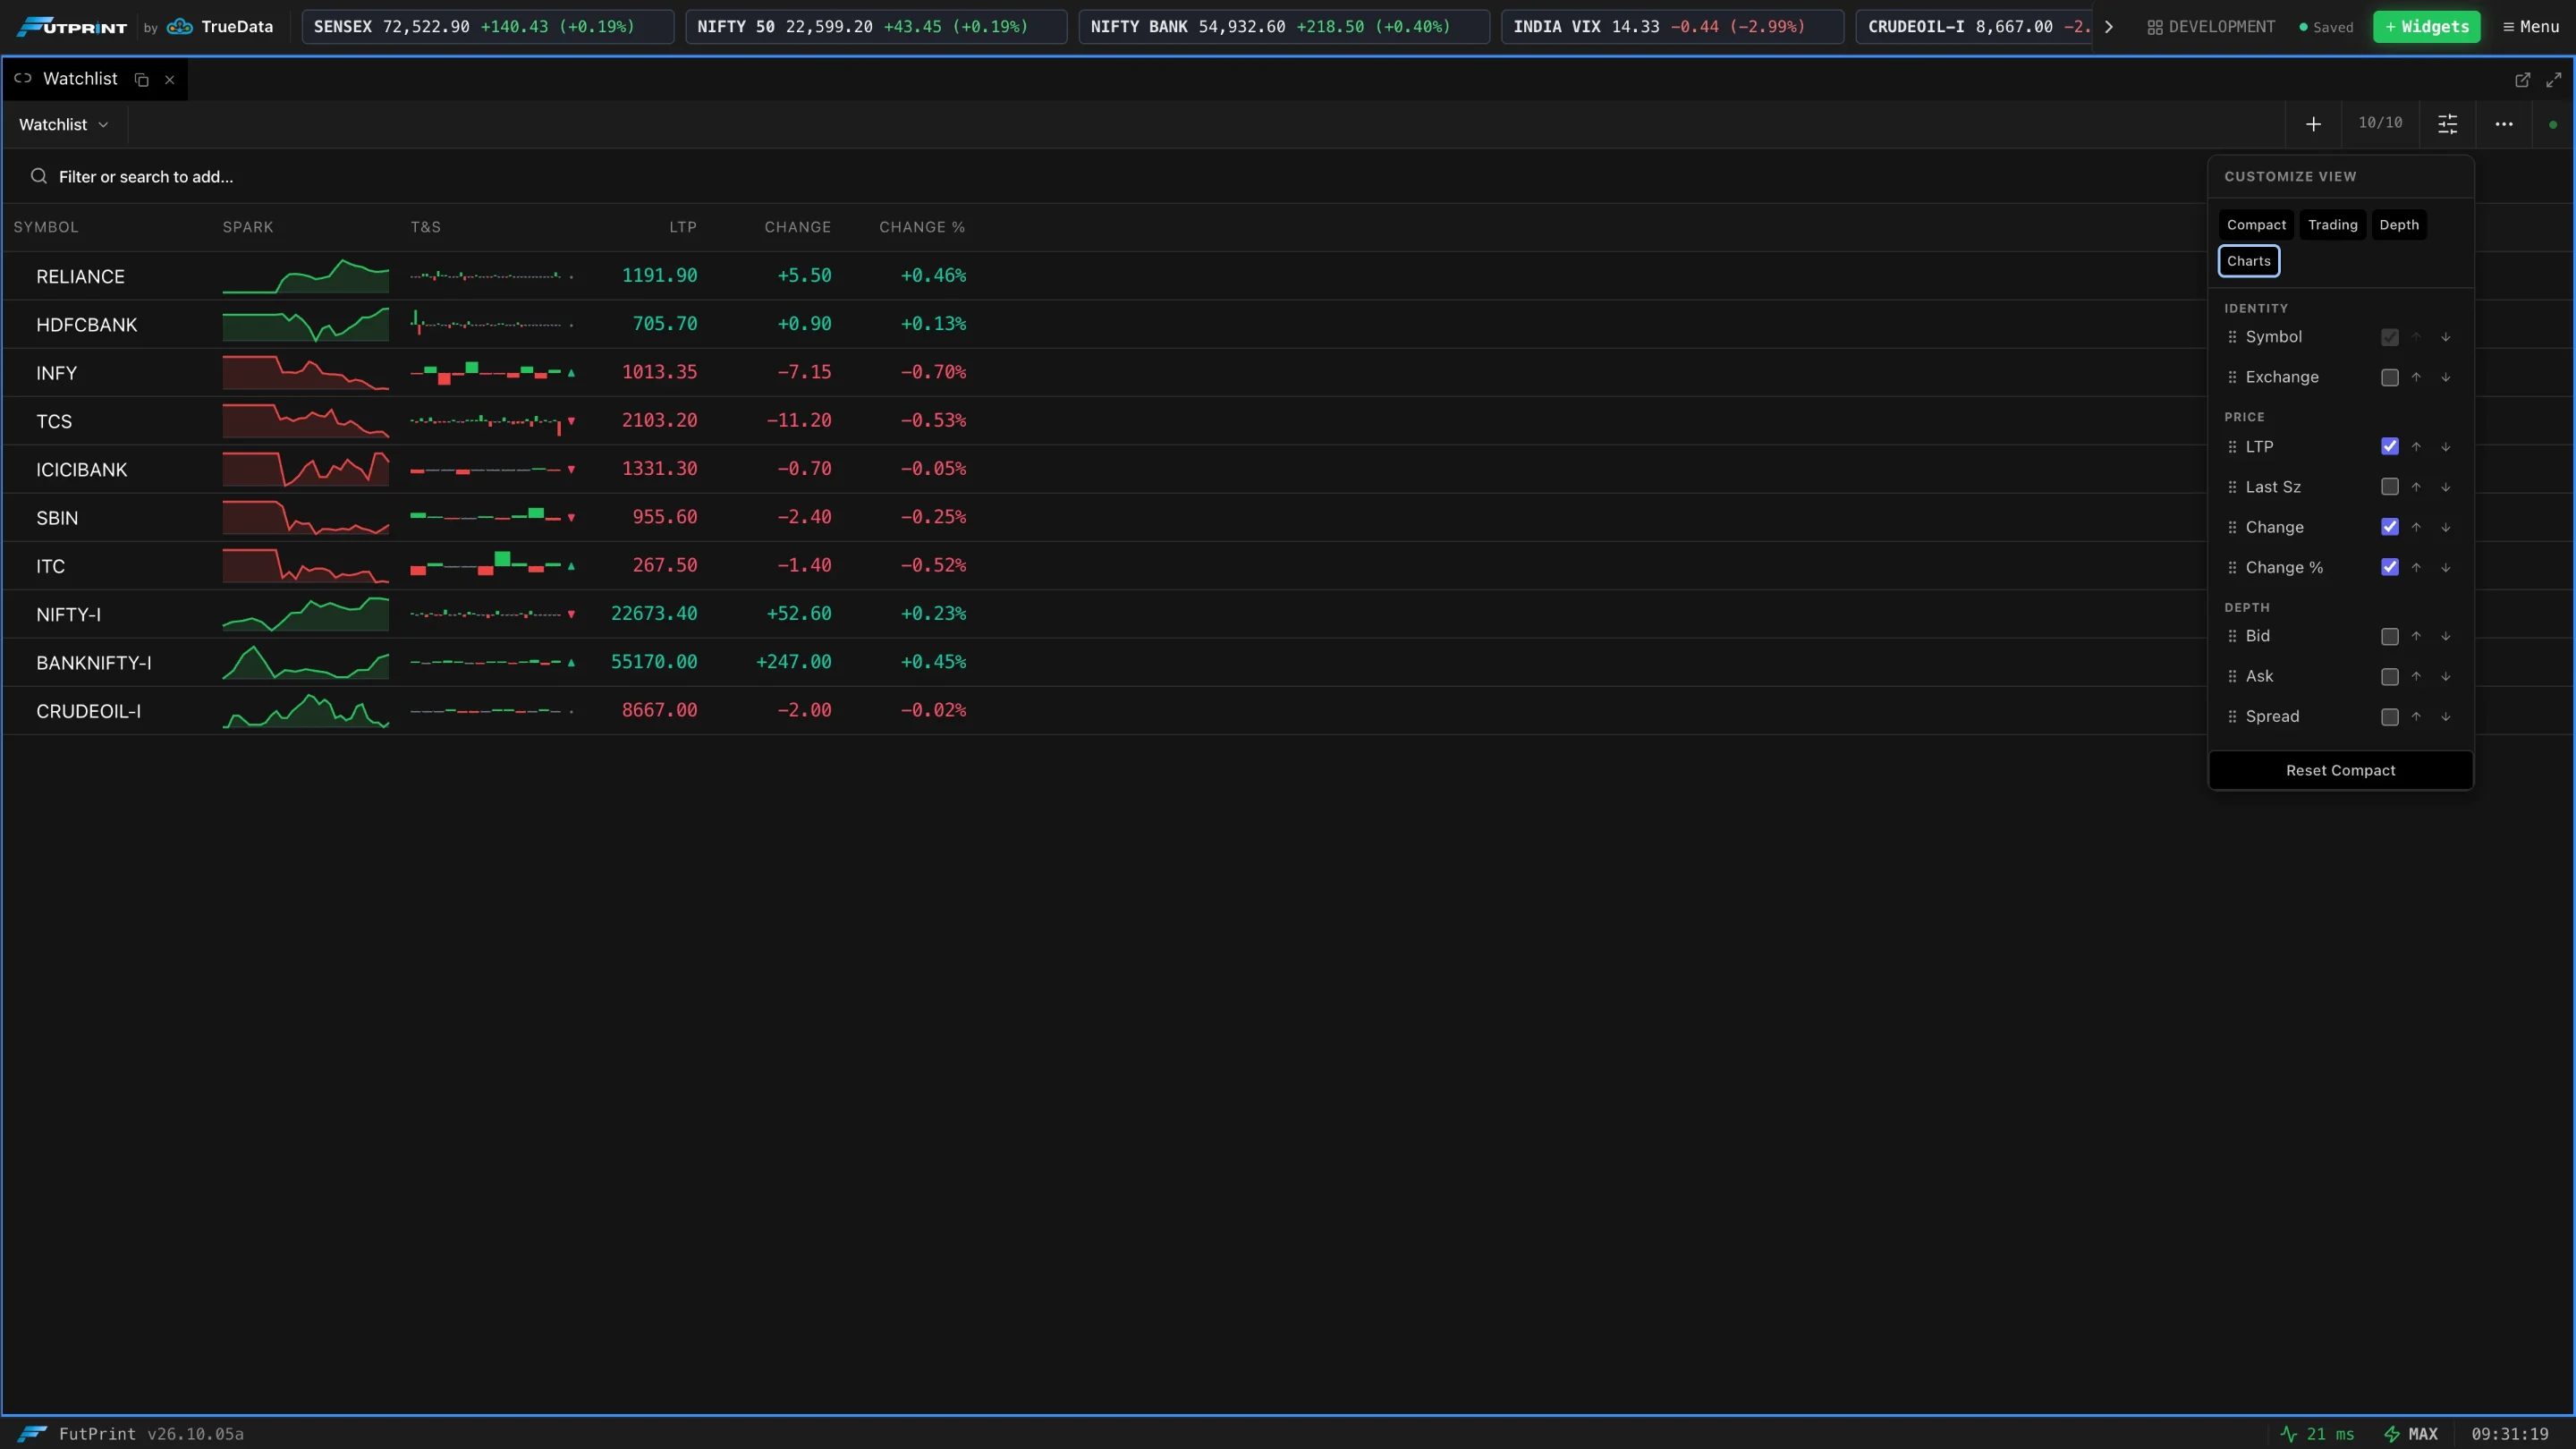
| Charts | Symbol, Spark, T&S Trend, LTP, Change, Change %. |
How the values are coloured
- LTP is green when the last price is above the previous close, red when below.
- Change and Change % are green when positive, red when negative.
The two visual columns
These are what make the Watchlist more than a number grid.
Spark — intraday sparkline
A miniature line of the symbol's price through the current session, with the live price appended at the right edge so it tracks in real time. The intraday history loads the first time a row scrolls into view (extended hours included, so evening MCX sessions like CRUDEOIL aren't cut off).
Hover or drag across it to scrub: a crosshair snaps to the nearest point and a tooltip shows the price and time at that point, the Day change (versus previous close) and Δ1 (the change from the immediately preceding point).
T&S Trend — tick tape
A compact tape of the last ~40 ticks, drawn as bars above and below a centre line: green for up-ticks, red for down-ticks, taller bars for bigger moves. A small ▲ / ▼ / • at the end shows the direction of the most recent tick. It's a quick read on whether buyers or sellers have control right now.
Live high / low highlight
When a symbol prints a new day high or day low, its row briefly tints green (high) or red (low) for about five seconds, so you notice the break even if you weren't watching that row.
Sorting
Click a column header to sort by it: first click ascending, second descending, third clears the sort. The active column shows a ↑ / ↓ arrow. Sortable columns include Symbol, Exchange, LTP, Last Size, Change %, Bid, Ask, Spread, Prev Close, Open, High, Low, Volume, OI, Bid Sz and Ask Sz.
Row actions
- Click a row to select the symbol. If this Watchlist is linked to other panels, they follow the selection (e.g. a linked chart loads it).
- Hover a row for quick buttons: Chart, Option Chain, T&S, Pin (keeps the symbol at the top of the list) and Remove.

- Right-click a row for the same open actions plus Remove from Watchlist.
Saving, exporting and importing
The Watchlist's symbols, visible columns and column widths are stored in your
workspace, so the list is exactly as you left it next time. You can also
export a watchlist to a .json file and import it back later (or into
another workspace) — handy for sharing or backing up a curated list.
Performance notes
The Watchlist subscribes to all its symbols through a single shared connection and batches incoming ticks (a few times per second) so large lists stay smooth. The Spark and T&S Trend columns only fetch and draw for rows that are actually on screen.
Keep heavyweight columns (Spark, T&S Trend) on a short, focused watchlist and use a plain price-only list for a long universe you're just monitoring.