
 by TrueData
Time & Sales: a calmer way to read the tape
Learn how trade size, pace and side combine into a live stream of market information.
FutPrint by TrueData · Published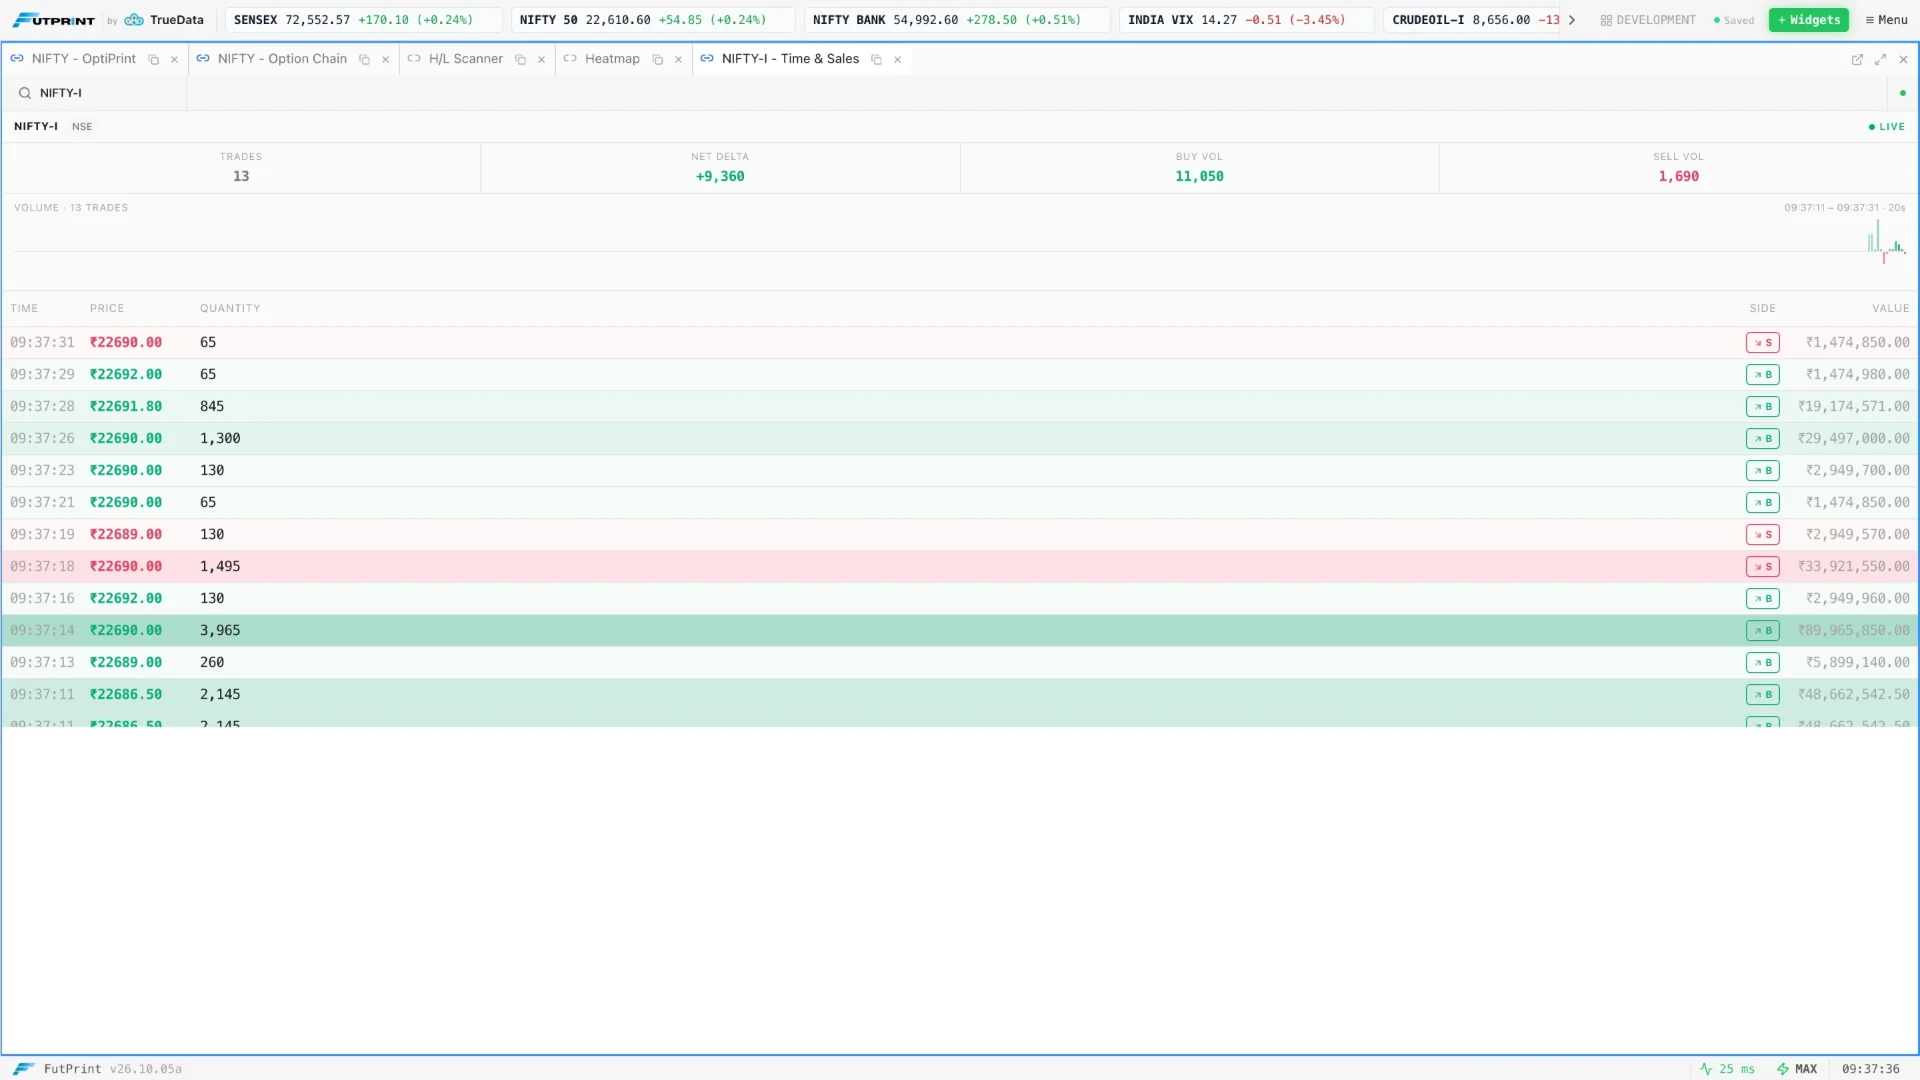
What the tape adds to a chart
Time & Sales is a sequence of reported executions. It usually shows a timestamp, price and size, with a colour or marker that describes a trade classification. Its advantage is sequence: a reader can observe activity arriving, pausing, repeating or moving between prices before a completed candle compresses those events into a summary.
That does not mean every screen row is a complete customer order. An order can execute in several pieces, while a feed or display may combine records. The tape reports what its data source and presentation rules expose. It cannot reliably identify the person behind a trade, the rest of their portfolio, or whether they are initiating or closing a position.
A useful tape-reading process is therefore modest and specific. Choose a location and ask how executions behave there. Does repeated buying advance price? Is activity accelerating? Do large transactions change the available prices? These questions are observable. Claims about hidden intentions require evidence beyond a coloured stream.
Learn the fields before interpreting the colours
The timestamp may represent exchange event time, feed time or a display convention. Precision matters when activity is fast: many trades can share the same visible second. A scrolling list can also appear to pause because of refresh cadence or a connection issue. Check the data-status indicators before deciding that participants have stopped trading.
Price is the reported execution price, and size may be shown in contracts, shares, lots or another unit. A print of 100 cannot be compared meaningfully with another instrument until you understand the units. Notional value can be useful for some comparisons, but it still does not make different instruments identical in risk or liquidity.
Colour deserves particular attention. Some feeds classify the aggressor explicitly. Others infer a side from prevailing quotes or price changes, and some rows remain uncertain. A green row might mean buyer-initiated, an uptick, or simply a platform colour choice. Read the tool's legend rather than importing assumptions from another terminal.
Executed trades and resting orders are different evidence
A depth display describes orders currently available within the feed's coverage. A tape describes transactions that have already occurred. Visible offers may be cancelled, replaced or replenished without all of that activity becoming a tape row. Conversely, an execution proves a trade occurred but does not reveal all the orders that competed around it.
Suppose the offer shows 50 contracts, yet 300 contracts execute at that price over several updates. Possible explanations include replenishment, successive new orders, aggregation conventions or hidden liquidity. The observation is that more size traded over time than one earlier snapshot displayed. It is not proof of a single iceberg order or a particular institution.
Read depth and tape together only when their timing and instrument match. A stale depth snapshot beside a current tape can create misleading interpretations. On a fast market, small differences in update frequency matter. When the sequence is uncertain, preserve that uncertainty in the review instead of inventing a precise narrative.
Tempo needs a baseline
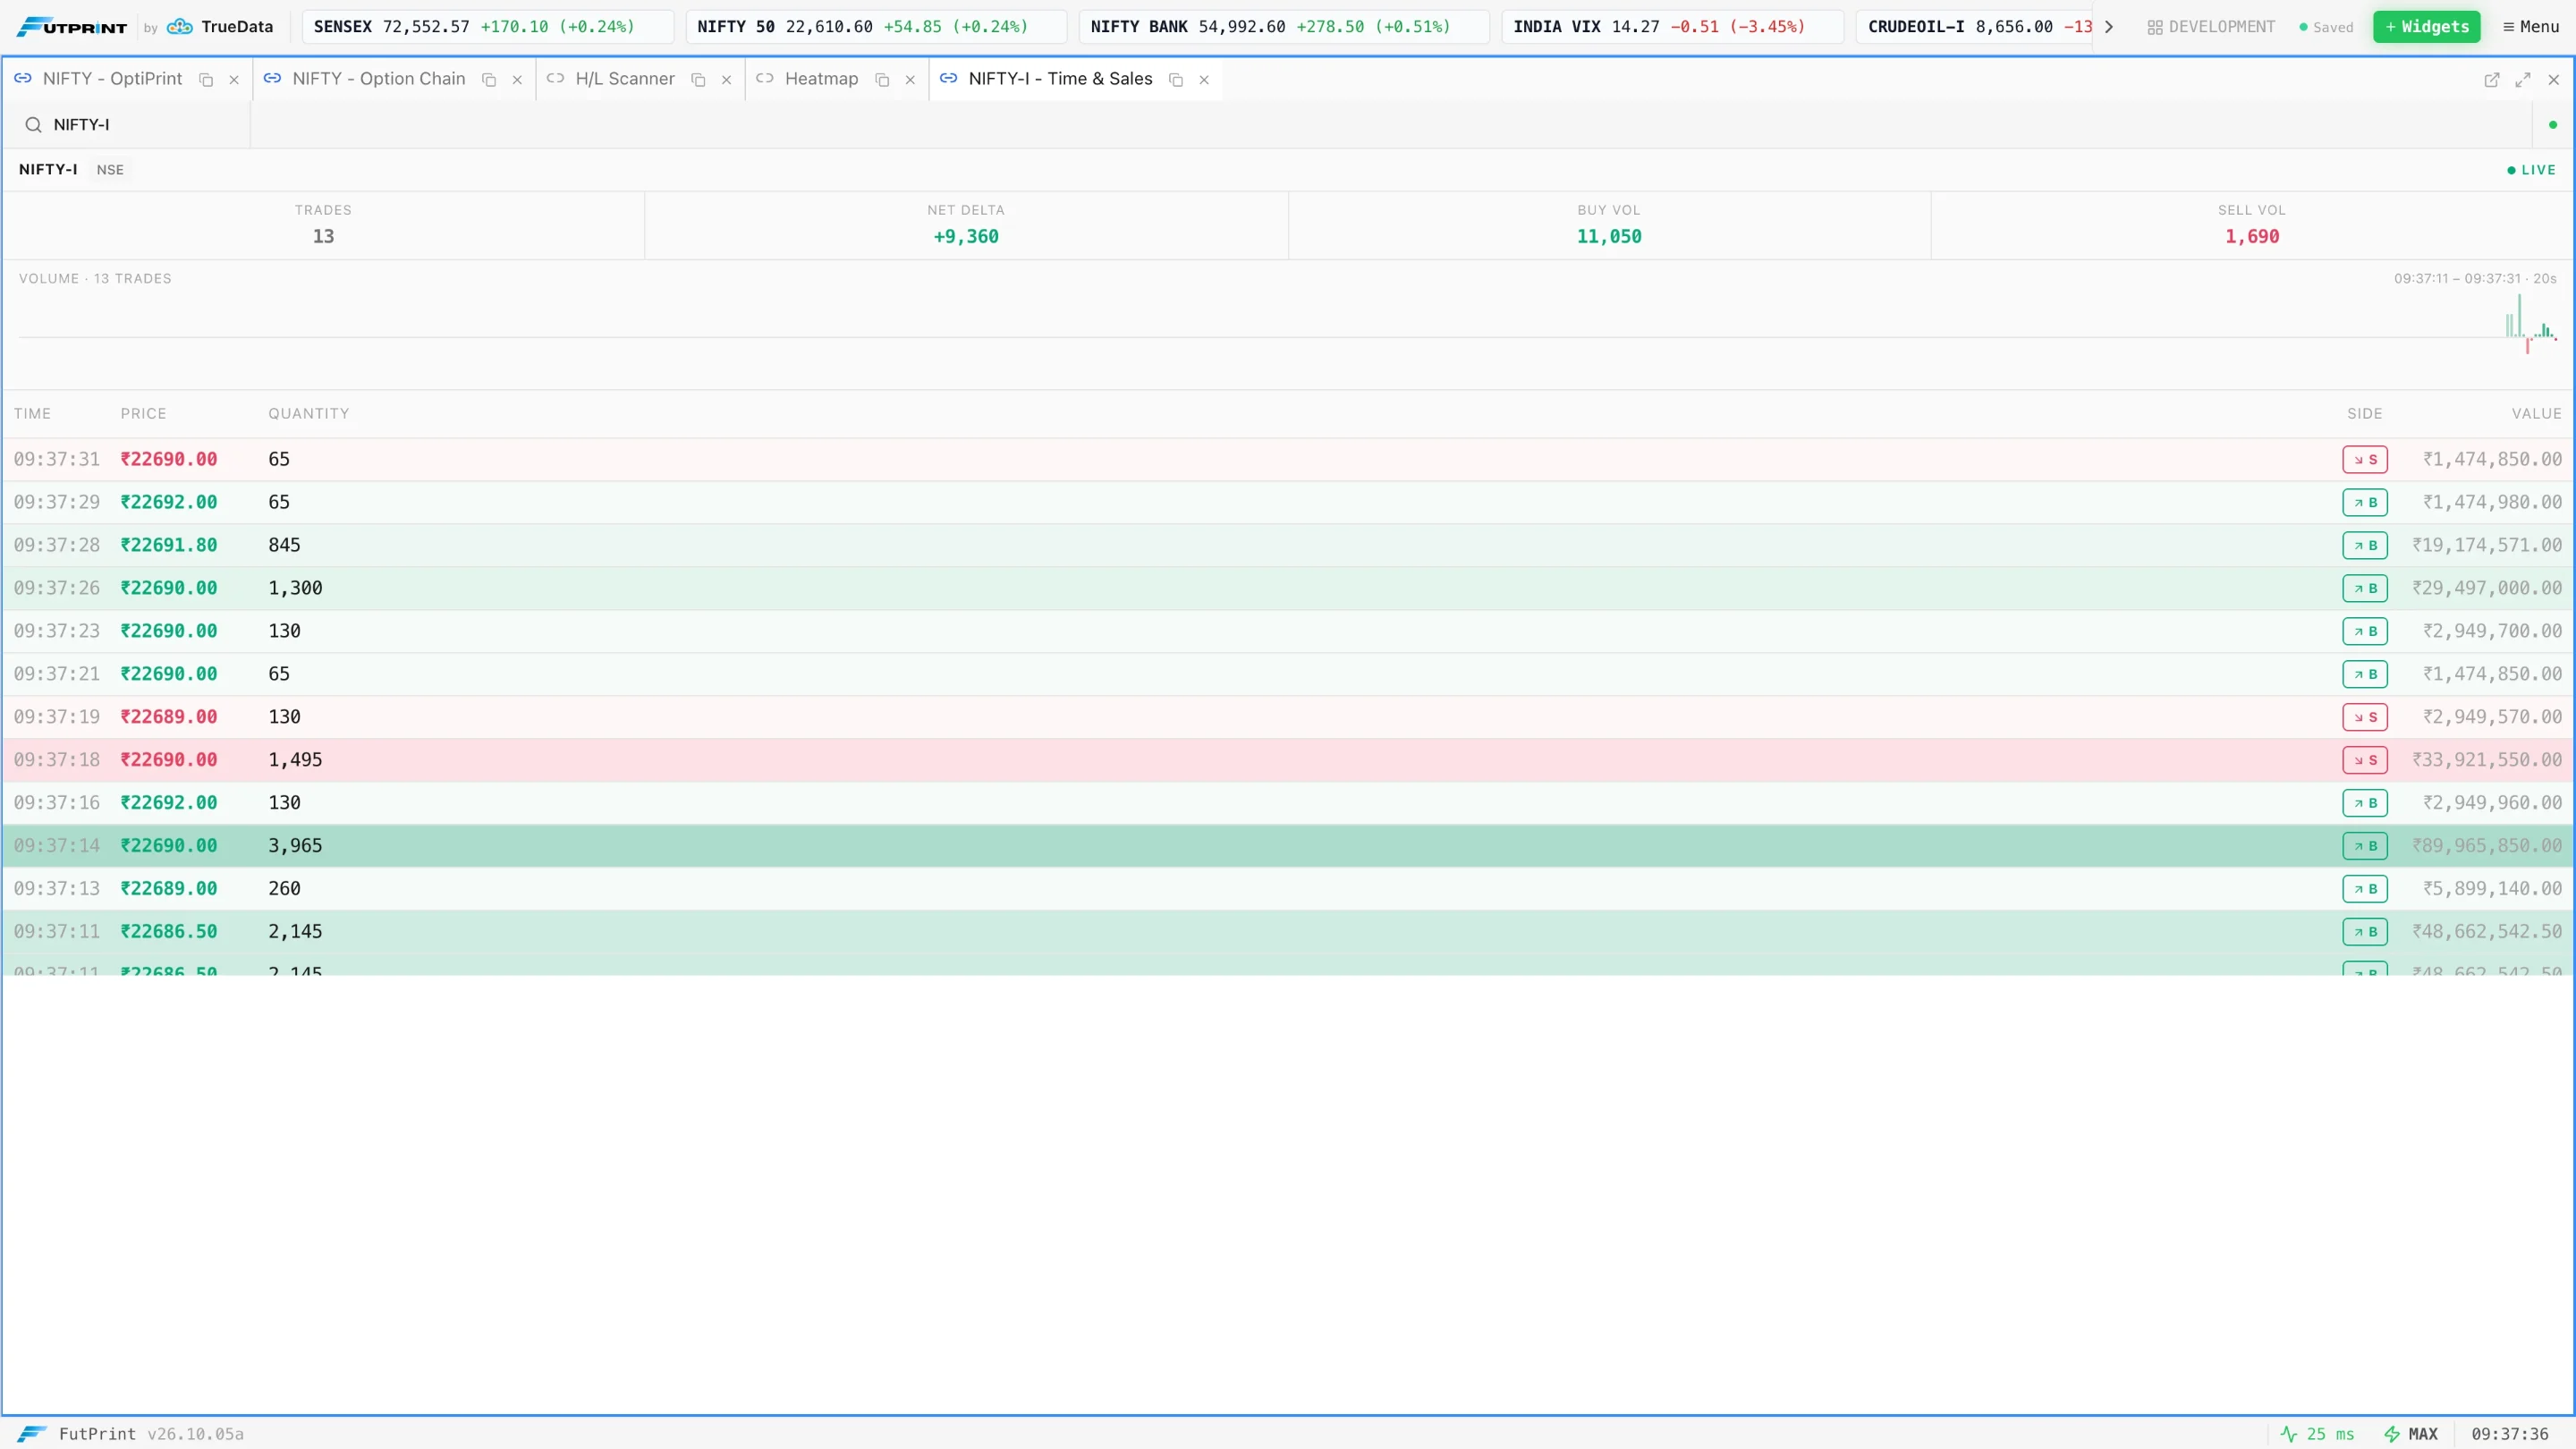
Tempo describes how quickly executions arrive. It is tempting to treat speed as urgency, but the baseline changes across the session. A busy open and a quiet lunch period naturally differ. Event releases, auctions, expiry effects and contract rollover can all change transaction rates without creating the same directional opportunity.
Measure a repeatable quantity if possible: trades per second, contracts per second, or the time taken to transact a fixed amount. These metrics are not interchangeable. Ten trades of one contract and one trade of ten contracts have equal total size but different print counts. A count-based filter highlights different behaviour from a volume-based filter.
For manual observation, use a simple qualitative scale anchored to the preceding period: slower, similar or faster. Write what changed and for how long. "Activity accelerated during the level test, then returned to its earlier rate" is more reproducible than "the tape felt explosive." Precision begins with consistent language.
Size filters make some questions easier and others harder
A minimum-size filter can reduce visual load, but it changes the sample. If you hide small transactions, you cannot judge the full trade count or the overall small-trade rhythm from the remaining list. The display is now a view of selected executions rather than a complete tape.
Consider a hypothetical burst consisting of fifty two-contract prints and one twenty-contract print. A ten-contract filter shows only twenty contracts, hiding most of the 120-contract burst. The filtered tape looks quiet even though the full stream was active. This is not a software error; it is the expected consequence of the setting.
Begin with a readable unfiltered view, then apply a filter for a stated purpose. Record that purpose and threshold in the capture. If a major conclusion depends on a filtered view, compare it with the unfiltered sequence before treating it as representative of the entire market.
Worked example: buying that makes progress
Imagine a market offers at 250.10. Buyer-initiated executions appear there, then the next available offer moves to 250.15 and trades occur at that higher price. The sequence continues through 250.20. This is evidence that the reported transactions are accompanying upward price progression, although changes in quoting also contribute to the movement.
Now watch the first pause. If subsequent selling trades occur mostly above the original level and new purchases resume at higher prices, the local sequence is different from an immediate return to 250.10. The tape becomes useful when you compare the pause and response, not merely when you notice the initial green prints.
Keep the scale in perspective. A progression of a few increments may be meaningful for a short execution study and irrelevant to a daily chart. State the horizon in the journal. Without it, any small counter-move can be incorrectly described as a failure of a much larger thesis.
Worked example: activity without continuation
In a second hypothetical sequence, several hundred contracts execute against an offer near 250.10 but the market does not sustain higher prices. That supports a limited statement: aggressive buying is meeting enough liquidity that the observed upward progress remains small. It does not, by itself, establish a short trade or a completed top.
The next sequence is decisive for interpretation. If buying persists and higher prices eventually transact, the earlier pause may have been temporary. If transactions begin building lower and attempts to recover the offer repeatedly fail, the continuation idea becomes weaker. Both outcomes are possible after the same initial cluster.
Capture the entire sequence, including the lead-in and later response. A cropped clip showing only a dramatic group of prints removes the information needed to evaluate the reading. Good tape examples preserve the clock and the surrounding price chart so that the evidence is not detached from its context.
Use the footprint to slow the tape down
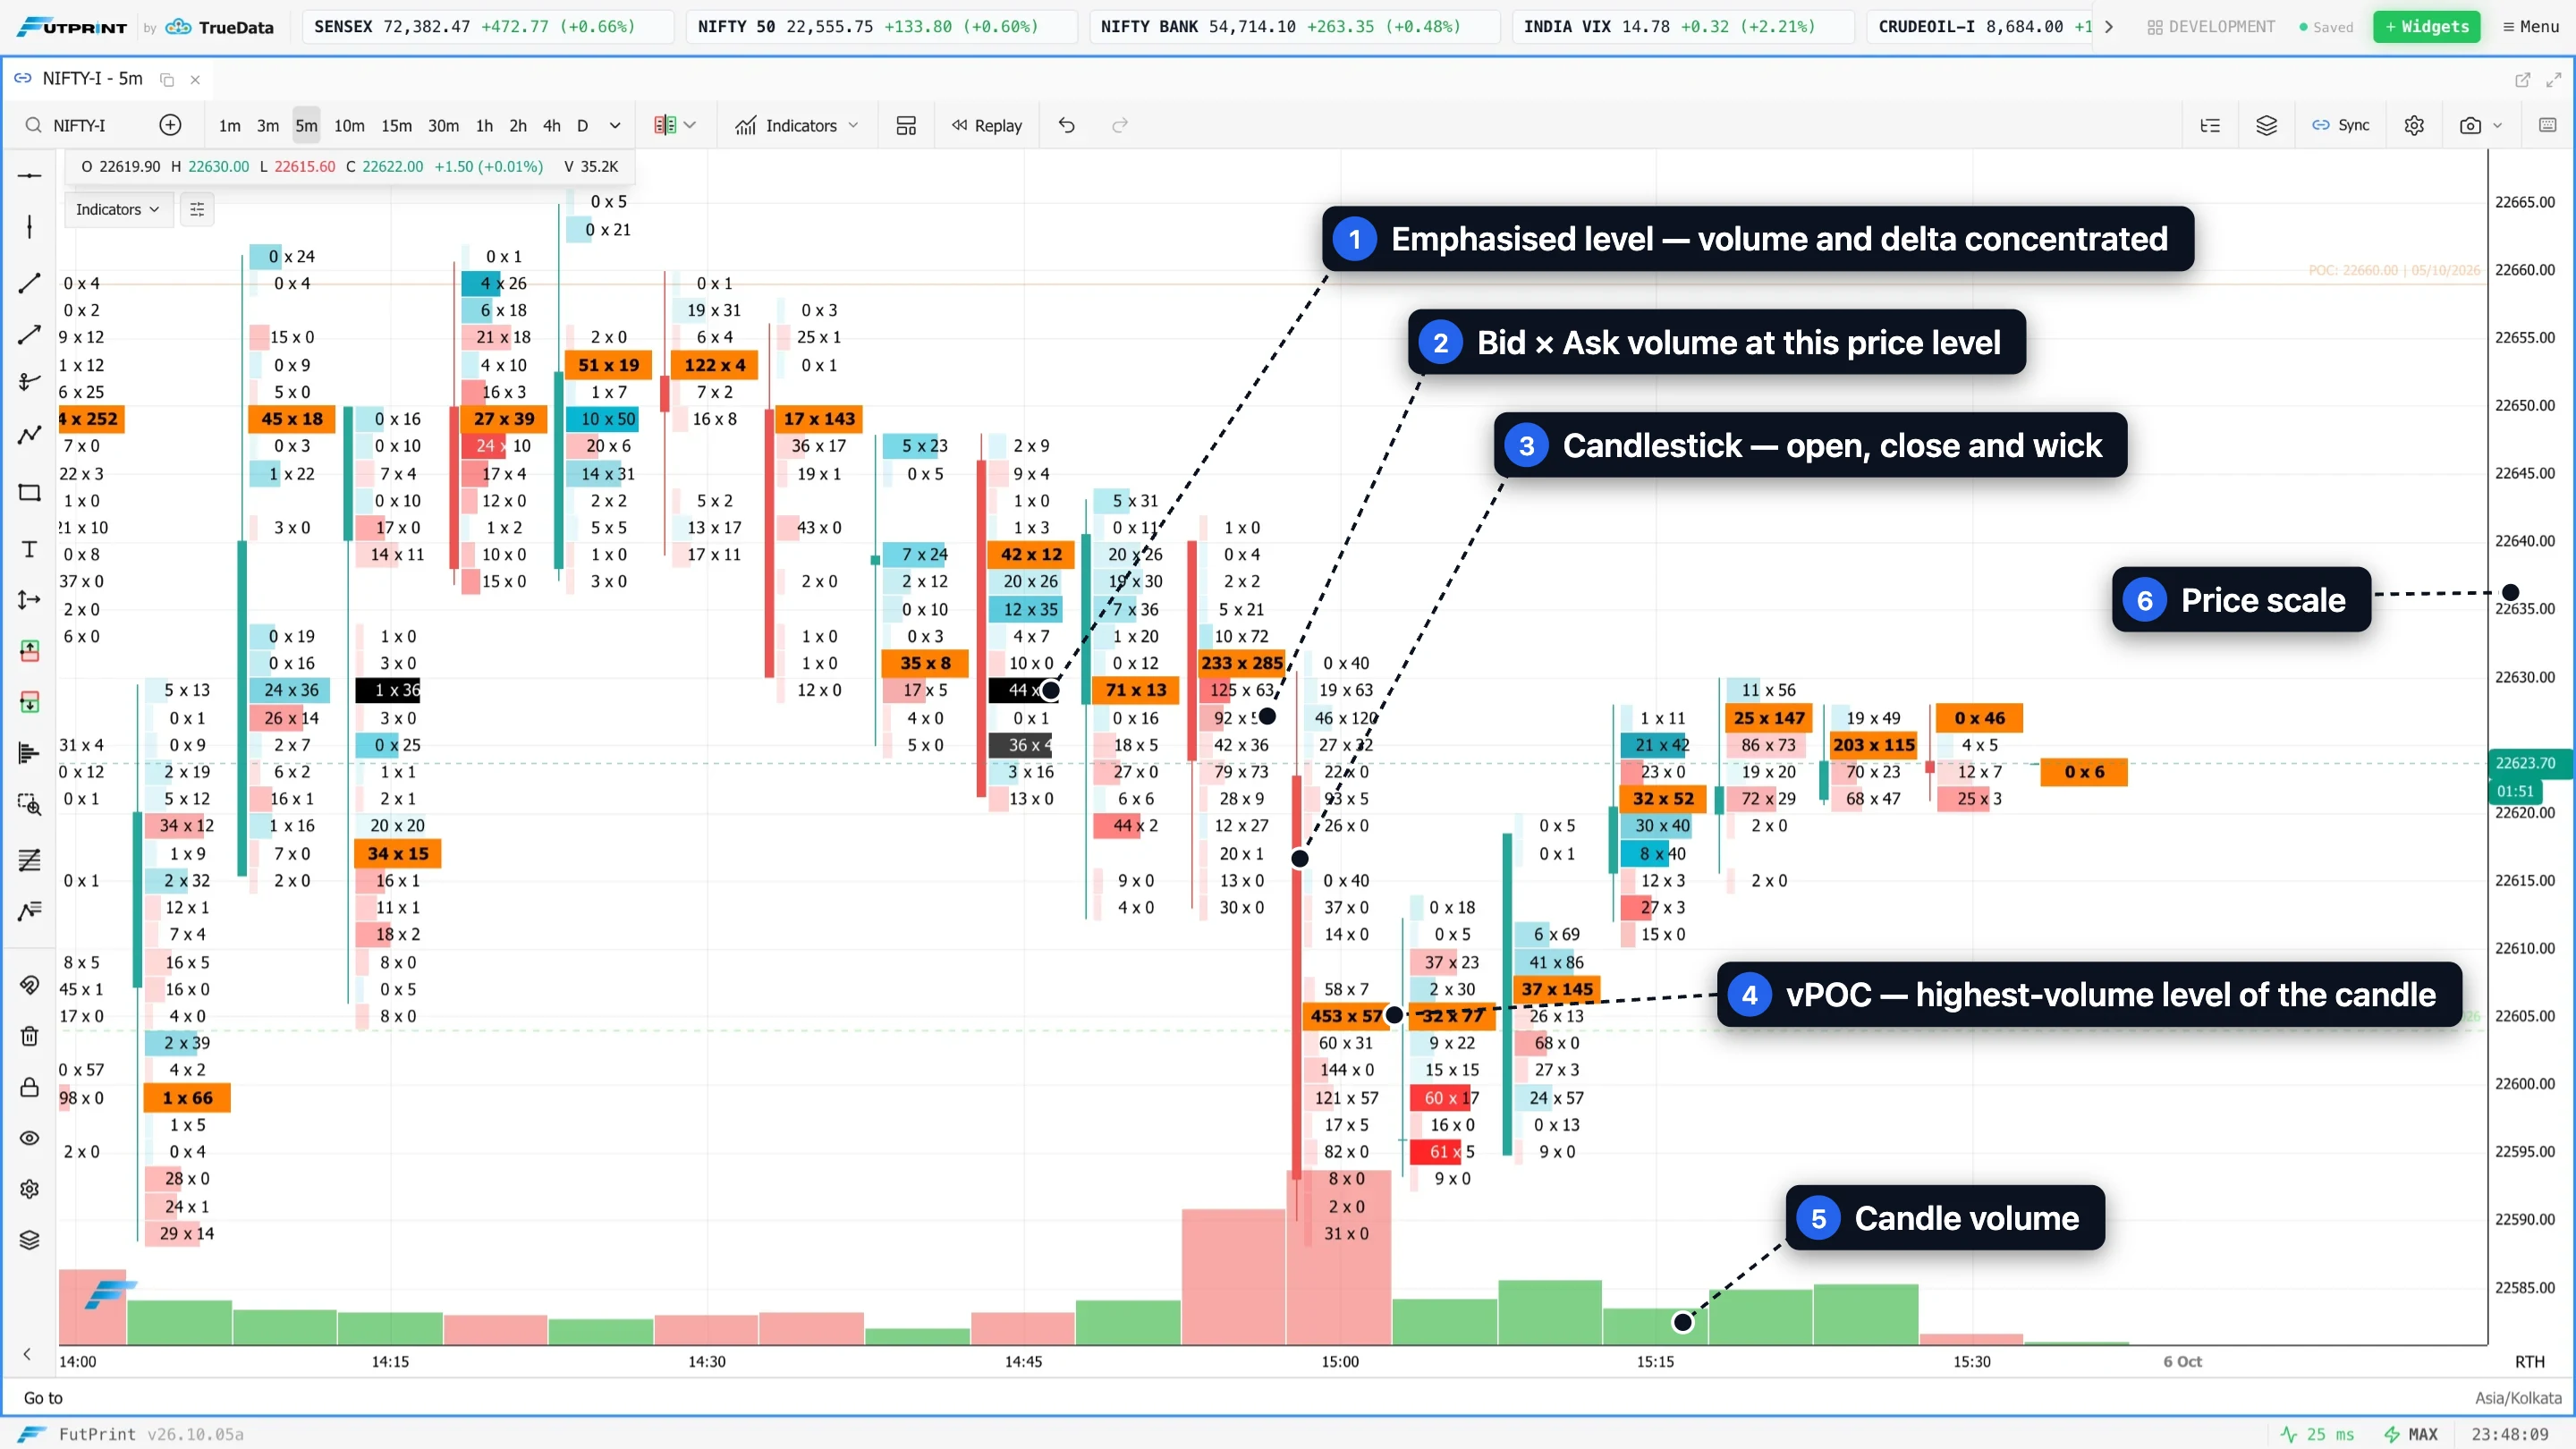
The tape is difficult to review after a busy event because it keeps moving. A footprint provides a more stable summary of where classified volume accumulated within a bar. It can help locate the prices you noticed on the tape, but it does not preserve the exact event order inside that bar.
For example, a footprint row with 400 at the ask and 350 at the bid could arise from alternating transactions or from two separate bursts. A final row total cannot tell you which sequence occurred. The tape and footprint are useful together precisely because each loses information the other retains.
During study, note the relevant timestamp and return to that interval. Compare your live impression with the completed aggregation. If the impression differs from the data, ask whether colour, speed, filtering or attention created the mismatch. This is a concrete way to improve observation without assuming that faster reading is always better.
Indian-market instrument checks
Keep the exact contract visible. Prints in one futures expiry should not be casually interpreted as the activity of the cash index or of every related option. An index option's premium may change because the underlying moved, implied volatility changed, time passed, or the quoted market widened. Its tape describes that option's transactions.
Liquidity varies substantially across strikes and expiries. A pause in an inactive option can be normal, while the same pause in a heavily traded future may deserve a data-status check. Compare an instrument with its own recent behaviour before generalising from raw print frequency.
Check whether access is live or delayed and whether historical replay contains transaction-level information. Bar-level replay cannot reconstruct the true order of every trade from an OHLC candle. If only summaries are available, use them for aggregate study rather than presenting the playback as an exact tape of the original session.
A manageable FutPrint layout
Use a detail chart beside Time & Sales, with enough space to read price, time and size comfortably. Keep a broader context chart available as a separate panel or tab. The tape should support a selected observation, while the context chart prevents a few busy seconds from dominating your interpretation of the session.
FutPrint exposes Time & Sales as a module, with availability and panel counts depending on the plan. Confirm the instrument in every panel before collecting an example. Where linkage is enabled, test that a symbol change affects only the intended panels. A wrong-contract tape can remain superficially plausible beside a related chart.
Avoid unnecessary animation and constant filter changes while studying. Readability is more useful than density. Save the layout and note any settings that are part of the exercise so that a later session can be compared under the same viewing conditions.
Practise observation without chasing every print
Select a five-minute window around one predefined level test. Watch it once at normal playback speed and write a brief account: initial tempo, largest change, direction of price progress and response after the burst. Then watch again at a slower speed, without altering filters, and identify any details missed initially.
On a third pass, compare the tape with the footprint for that interval. Count how often the most memorable prints occurred away from the actual turning point. Large transactions can be visually striking without being the most useful evidence. The exercise trains relevance as much as speed.
Repeat across quiet, balanced and directional sessions. Keep incorrect observations instead of removing them. After several examples, look for systematic errors: mistaking uptick colour for aggressor side, overlooking a stalled connection, confusing trade count with size, or following prints after the meaningful event has already passed.
Frequently asked questions
Does a large buy print guarantee higher prices?
No. It confirms reported execution under the feed's classification, not future continuation. The size may be absorbed, hedged elsewhere or followed by a change in liquidity. Measure what price does during and after the activity. A print becomes more informative when attached to a defined location and comparison period.
Can repeated equal-size prints identify one participant?
They may suggest a pattern worth examining, but they do not reliably establish identity. Order slicing, matching behaviour, common lot sizes and feed aggregation can produce similar appearances. Describe the repeated sizes and their price impact without claiming a specific trader or strategy that the data does not reveal.
Is a filtered tape better for beginners?
A filtered tape can be calmer, but it can also hide the very sequence a beginner needs to understand. Start with a liquid instrument, a short study window and a clear objective. Adjust filtering deliberately, then compare with the complete view so you understand what the display has removed.
Make a short tape observation reproducible
Choose a thirty-second window around a level identified beforehand. Record the instrument, timestamp precision, size unit, filter and any grouping setting. Count displayed executions and their total displayed size separately. If the feed combines several executions into one row, describe these as displayed records rather than assuming they are individual orders. This small distinction prevents false precision in later comparisons.
Then note the highest and lowest traded prices in the window and the price at its end. A large amount of activity confined to a narrow area answers a different question from the same amount distributed over a broad move. Compare a second window of equal duration using the same settings. Only then consider whether pace or price response changed meaningfully.
Save a short recording where permitted, because a still image cannot preserve the sequence in which rows appeared. If no recording is available, write the observation immediately and acknowledge what was not captured. The purpose is not to memorise every print. It is to develop a record that can distinguish an actual change in transactions from an impression created by scrolling speed, display grouping or selective attention.
Further reading
These references provide additional explanations of the concepts covered here. Examples and exercises in this guide are original; platform controls and data conventions may differ.