
 by TrueData
Read the market beyond the candle
A practical starting point for combining price, participation and context without adding noise to your chart.
FutPrint by TrueData · Published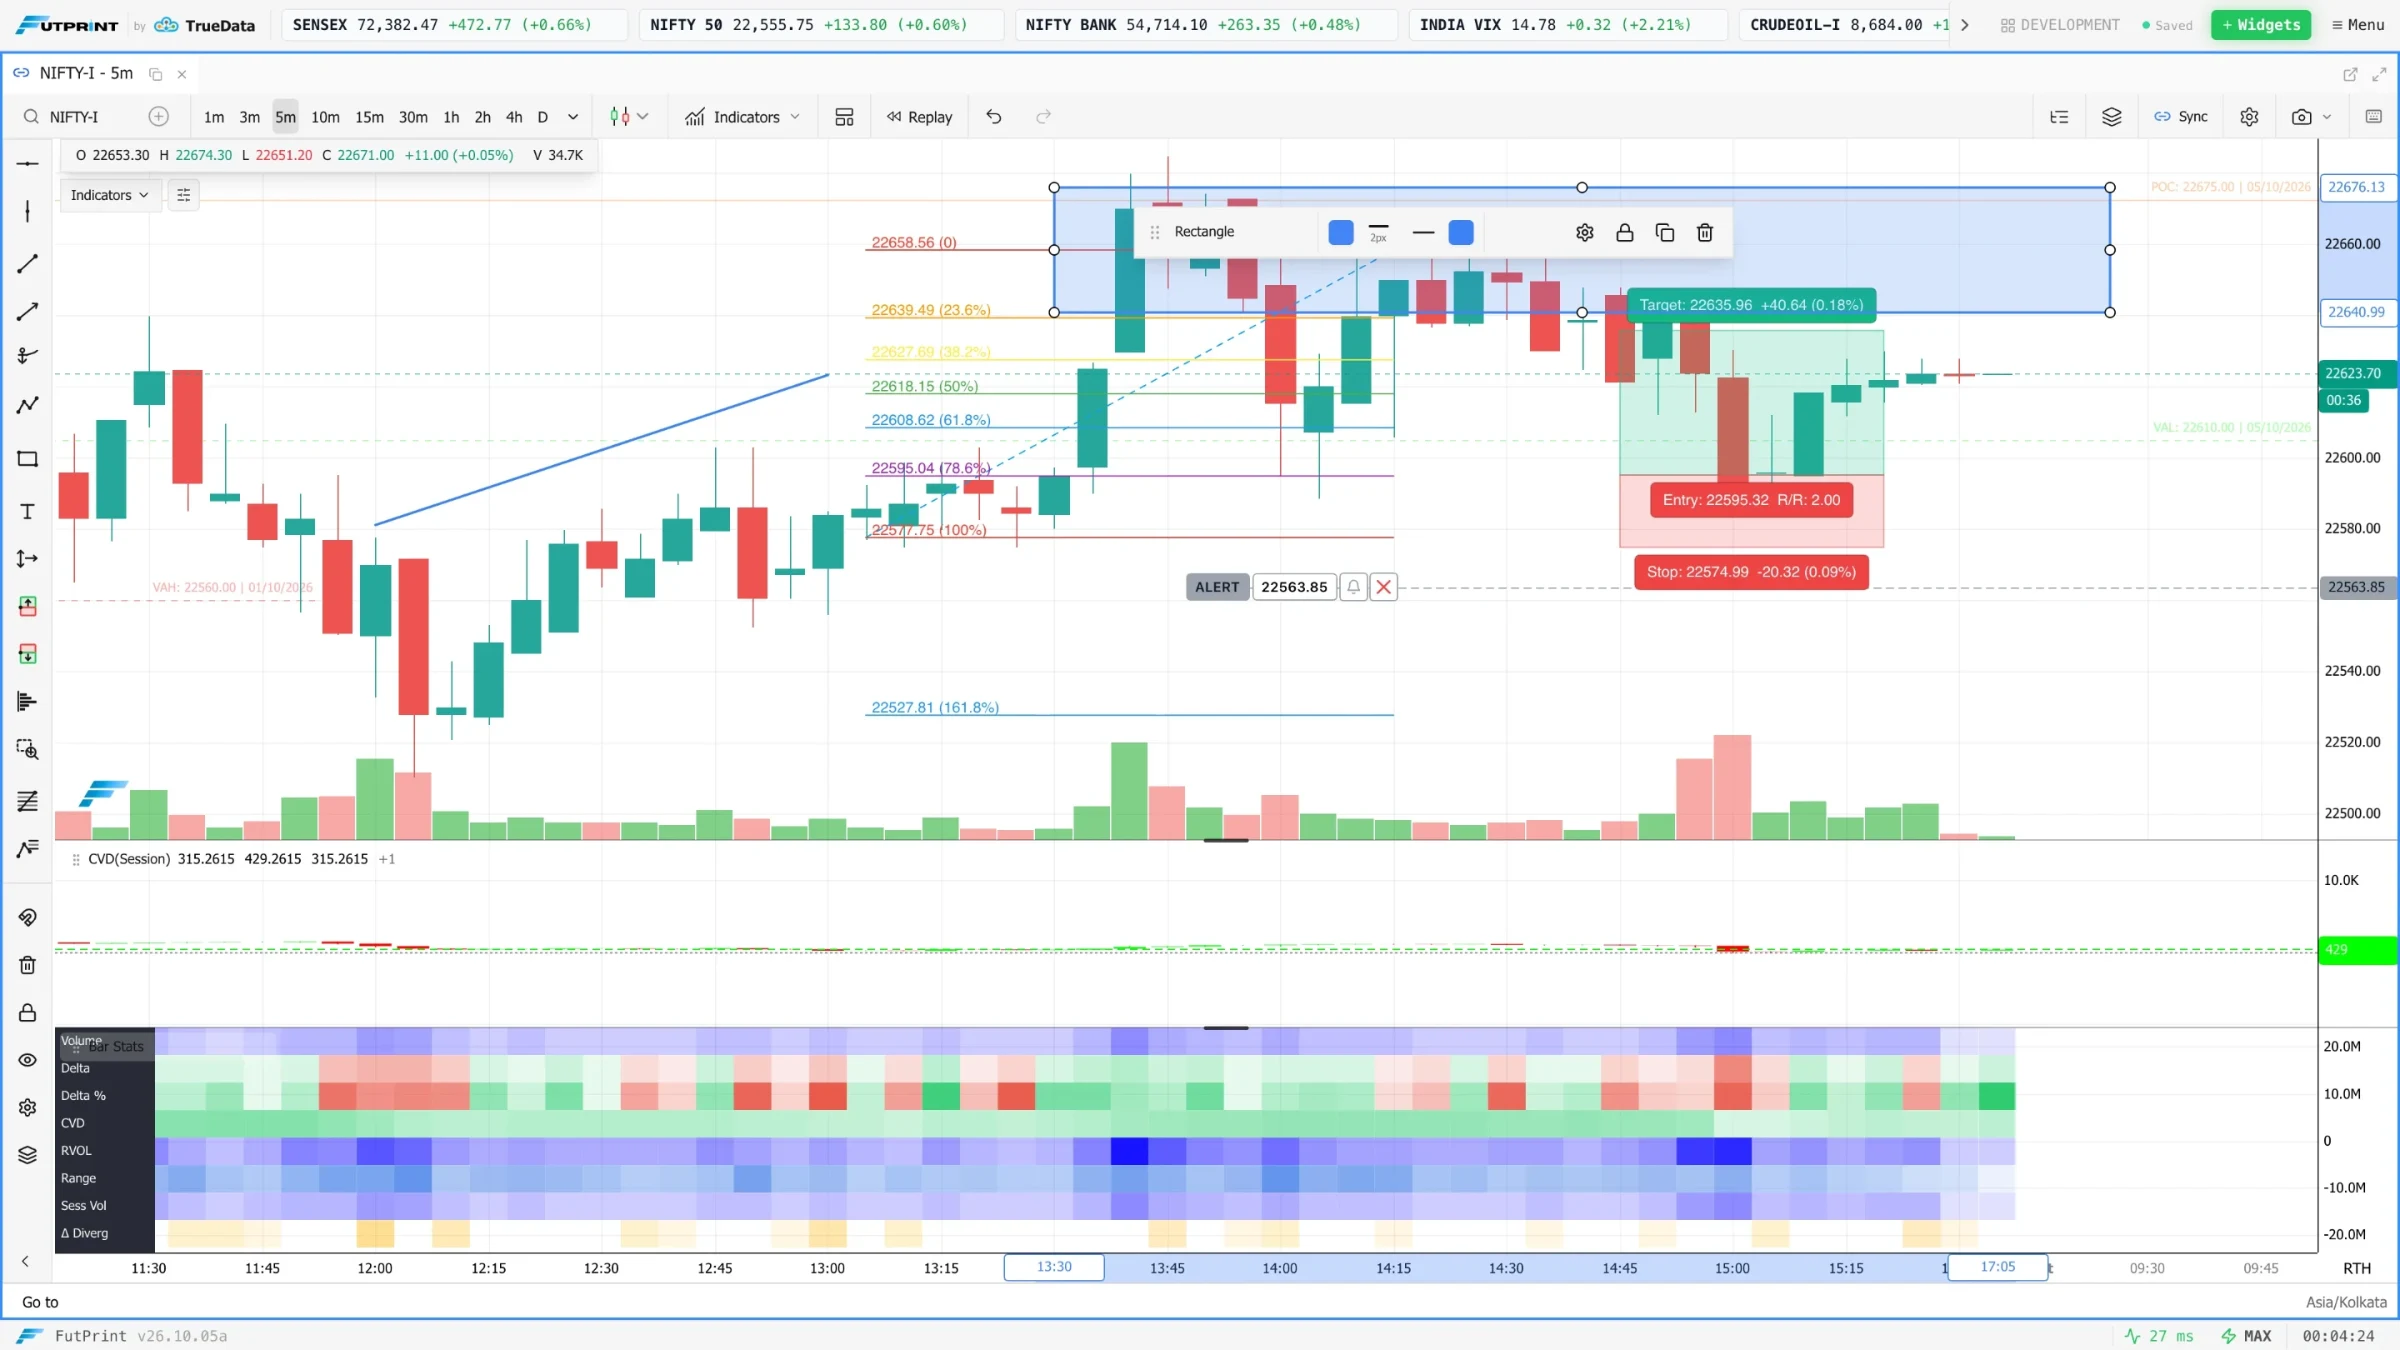
Start with the question a candle cannot answer
A green candle may look convincing because it finished above its opening price. Yet the same shape can come from very different sequences: a steady advance, a sharp fall followed by a recovery, or a late jump through a thin order book. The open, high, low and close describe the boundary of the experience. They do not preserve its chronology. Learning to read beyond the candle begins with recognising what the picture has compressed.
The objective is not to distrust candles. They are an efficient map of price, especially when you need to compare several sessions or instruments. The objective is to know when a second view would answer a question that the first view cannot. If you want to know where an advance slowed, a price chart may be enough. If you want to know whether aggressive buying continued while the advance slowed, you need execution data.
This guide builds an observation process around three things: location, participation and response. Location tells you where the event occurred. Participation describes the activity around it. Response tells you what the market did next. Every example is hypothetical and intended to make that sequence easier to practise.
Separate the market from its measurements
A financial market contains transactions, outstanding orders and changing expectations. A chart is a measurement of some of those events over a selected interval. Change the interval, instrument, session or data feed and the measurement changes. That does not necessarily mean either view is wrong. It means the views answer different questions.
For Indian index analysis, distinguish the cash index from a particular futures contract and from an option on that index. A cash index is a calculated reference; it does not have the same directly traded volume as a futures contract. An option premium also responds to volatility, remaining time and its sensitivity to the underlying. Its candle should not be treated as a miniature version of the index candle.
Before interpreting an unusual print, read the symbol, exchange, expiry and timestamp. A continuous futures chart can be useful for broad history, while a specific contract is more appropriate for studying actual executions. Around contract rollover, changes in participation can reflect activity moving between expiries. A sound reading starts by identifying what the data represents.
Understand the auction behind a transaction
Every executed trade has a buyer and a seller. Price does not rise because buyers exist and sellers disappear. It rises through the interaction of executable orders, available liquidity and subsequent quoting. An aggressive buyer accepts an available offer; a passive seller supplies that offer. Both participate in the same transaction, with different demands for immediacy.
The words buying pressure and selling pressure usually describe aggressor-side activity. They should not be interpreted as a count of bullish and bearish people. An aggressive buyer could be opening a long, closing a short, hedging another instrument or executing one slice of a larger instruction. Public trade data usually cannot identify that intention.
This distinction prevents a common mistake: assuming that a large amount of aggressive buying must cause a lasting advance. Buyers may find enough offered liquidity to trade considerable size without moving far. Conversely, a relatively small amount of buying may move price quickly if the available offers are sparse. Activity and price impact need to be read together.
Establish location before adding detail
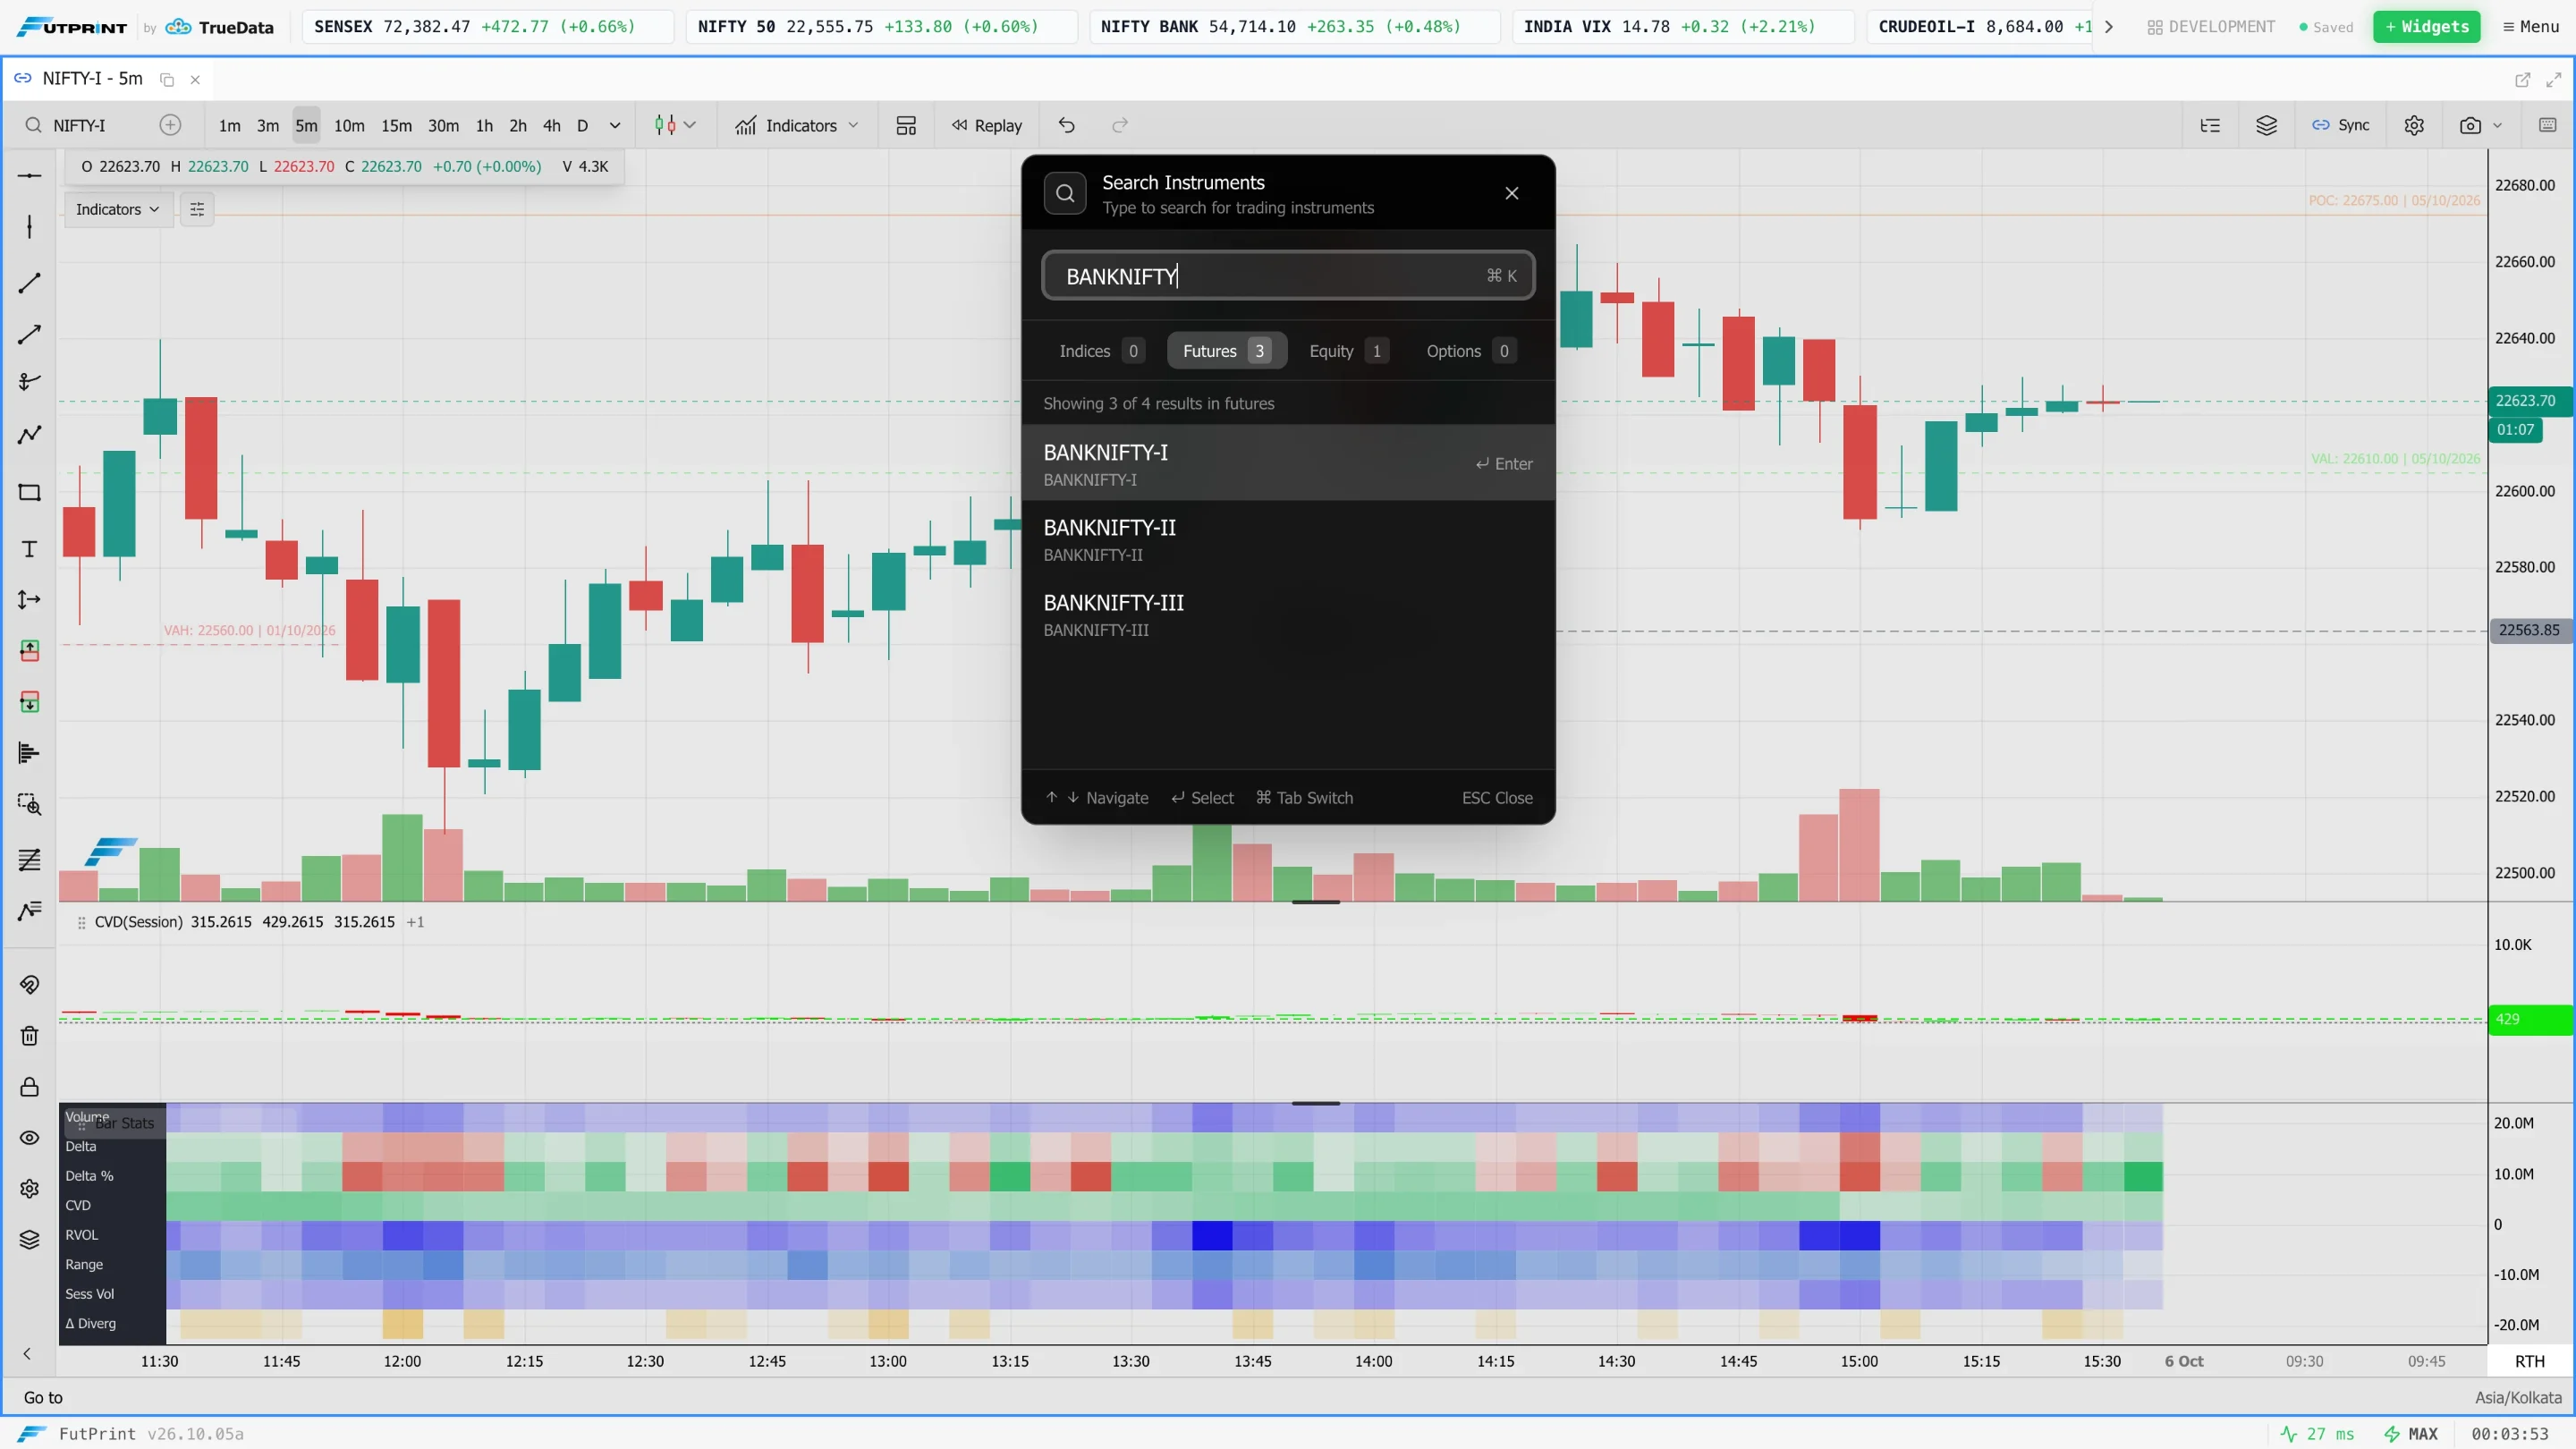
Location gives a transaction sequence relevance. Consider a burst of buying in the centre of a familiar range and an identical burst as price tests the range high. The first may be routine rotation. The second may help answer whether the market is moving beyond a boundary that previously contained it. The numbers can be similar while the questions are different.
Mark a limited set of references before the session: prior extremes, an important swing, the opening area and any profile levels you consistently study. Explain why each reference belongs on the chart. A line without a reason becomes an invitation to tell a story after price touches it. Too many lines make almost every move look significant.
Also decide your observation horizon. A five-minute rejection can occur within a broader daily advance. Neither cancels the other. Write whether the current question concerns the next few transactions, the next rotation or the session as a whole. This reduces the temptation to change timeframes until a preferred conclusion appears.
Give volume a meaningful comparison
Volume is easiest to interpret relative to an appropriate baseline. A busy opening interval and a quiet midday interval are not naturally comparable. Neither are the same nominal quantities in instruments with different contract sizes. Compare like periods, understand the unit displayed, and pay attention to whether the dataset is complete.
Suppose one five-minute candle trades 1,200 contracts and moves twelve points, while another trades 3,600 contracts and moves only three points. The second has more activity but less net progress. That is a useful observation, not yet a reversal signal. It could reflect two-sided exchange near an important reference, temporary absorption or an event that attracted both aggressive buyers and sellers.
The next question is whether price remains in that area or leaves it. Volume identifies participation; it does not assign the correct interpretation automatically. A descriptive note such as "volume increased while upward progress slowed" is more useful than "institutions are selling," because the former is visible and can be tested against subsequent behaviour.
Choose the next view deliberately
A footprint organises executed activity by price within a bar. A volume profile aggregates activity by price across a selected range. A TPO profile records price visits within time brackets. A tape preserves the sequence of reported trades. A depth display shows available orders within the depth supplied by the feed. These are complementary measurements, not interchangeable pictures.
Ask one question before opening another panel. "Where did this session transact most?" suggests a profile. "Did repeated buying advance the offer?" suggests the tape or a footprint. "How much displayed liquidity is currently ahead of price?" suggests depth, with the understanding that orders can change before execution.
Adding four views that all derive from the same transaction stream does not give four independent confirmations. A delta histogram, a delta-coloured footprint and CVD may all reflect the same underlying imbalance. Their different presentations are helpful, but count the underlying evidence once when assessing confidence.
A useful chart note distinguishes what happened, what you infer, and what would change that inference.
Worked example: a test above a range
Imagine a futures contract has repeatedly rotated between 22,100 and 22,140. Before the next test you mark 22,140 as an observation area, not an automatic entry. Price trades to 22,145, volume rises and the candle closes at 22,144. A price-only description is straightforward: the market traded beyond the range and finished above it.
Now examine two possible continuations. In the first, a pullback spends little time below 22,140, subsequent trading builds above it, and further buying produces new highs. Those observations support the idea that the auction is establishing a higher area. In the second, repeated purchases near 22,145 produce no additional progress, price returns below 22,140 and activity builds inside the old range.
The initial breakout candle is identical in both scenarios. The difference emerges through the response. The second sequence weakens the continuation hypothesis; it does not prove a large decline must follow. Price might simply resume rotation. Your next decision should reflect the new evidence rather than loyalty to the first candle.
Turn observations into conditional scenarios
A scenario connects a condition with an expected response and an invalidation. "If price remains above the prior range and participation develops there, I will study continuation" is testable. "The market looks strong" is not. Good scenarios also include a neutral outcome, because many tests resolve into indecision rather than a clean move.
Write the alternative before the event. In the range example, an alternative might be a return inside the range followed by unsuccessful attempts to recover the boundary. A third possibility is several small crossings with no sustained activity on either side. That last condition may call for continued observation rather than repeated attempts.
Keep interpretation separate from execution. A plausible continuation scenario does not determine suitable position size, order type or acceptable loss. Those decisions require a separate risk process. The purpose of better market reading is to make the evidence clearer, not to create certainty where the market provides none.
Avoid the hindsight trap
After a large move, earlier details appear more obvious than they were in real time. The small pause becomes "clear absorption" and the ordinary candle becomes "the trigger." To counter this, save a note or screenshot before revealing the next part of the chart. Record at least one competing explanation.
Include unremarkable examples in your review. Studying only spectacular reversals creates a distorted picture of how often similar observations lead nowhere. Select sessions by a rule, such as consecutive trading days or every first test of a predefined level. That makes the sample less dependent on memorable outcomes.
Record ambiguous events as ambiguous. If your method cannot distinguish a successful test from a failed one before the outcome, that is useful information about the method. Renaming the pattern after the result hides the limitation and prevents improvement. A journal should make uncertainty visible instead of editing it away.
Build a compact FutPrint study layout
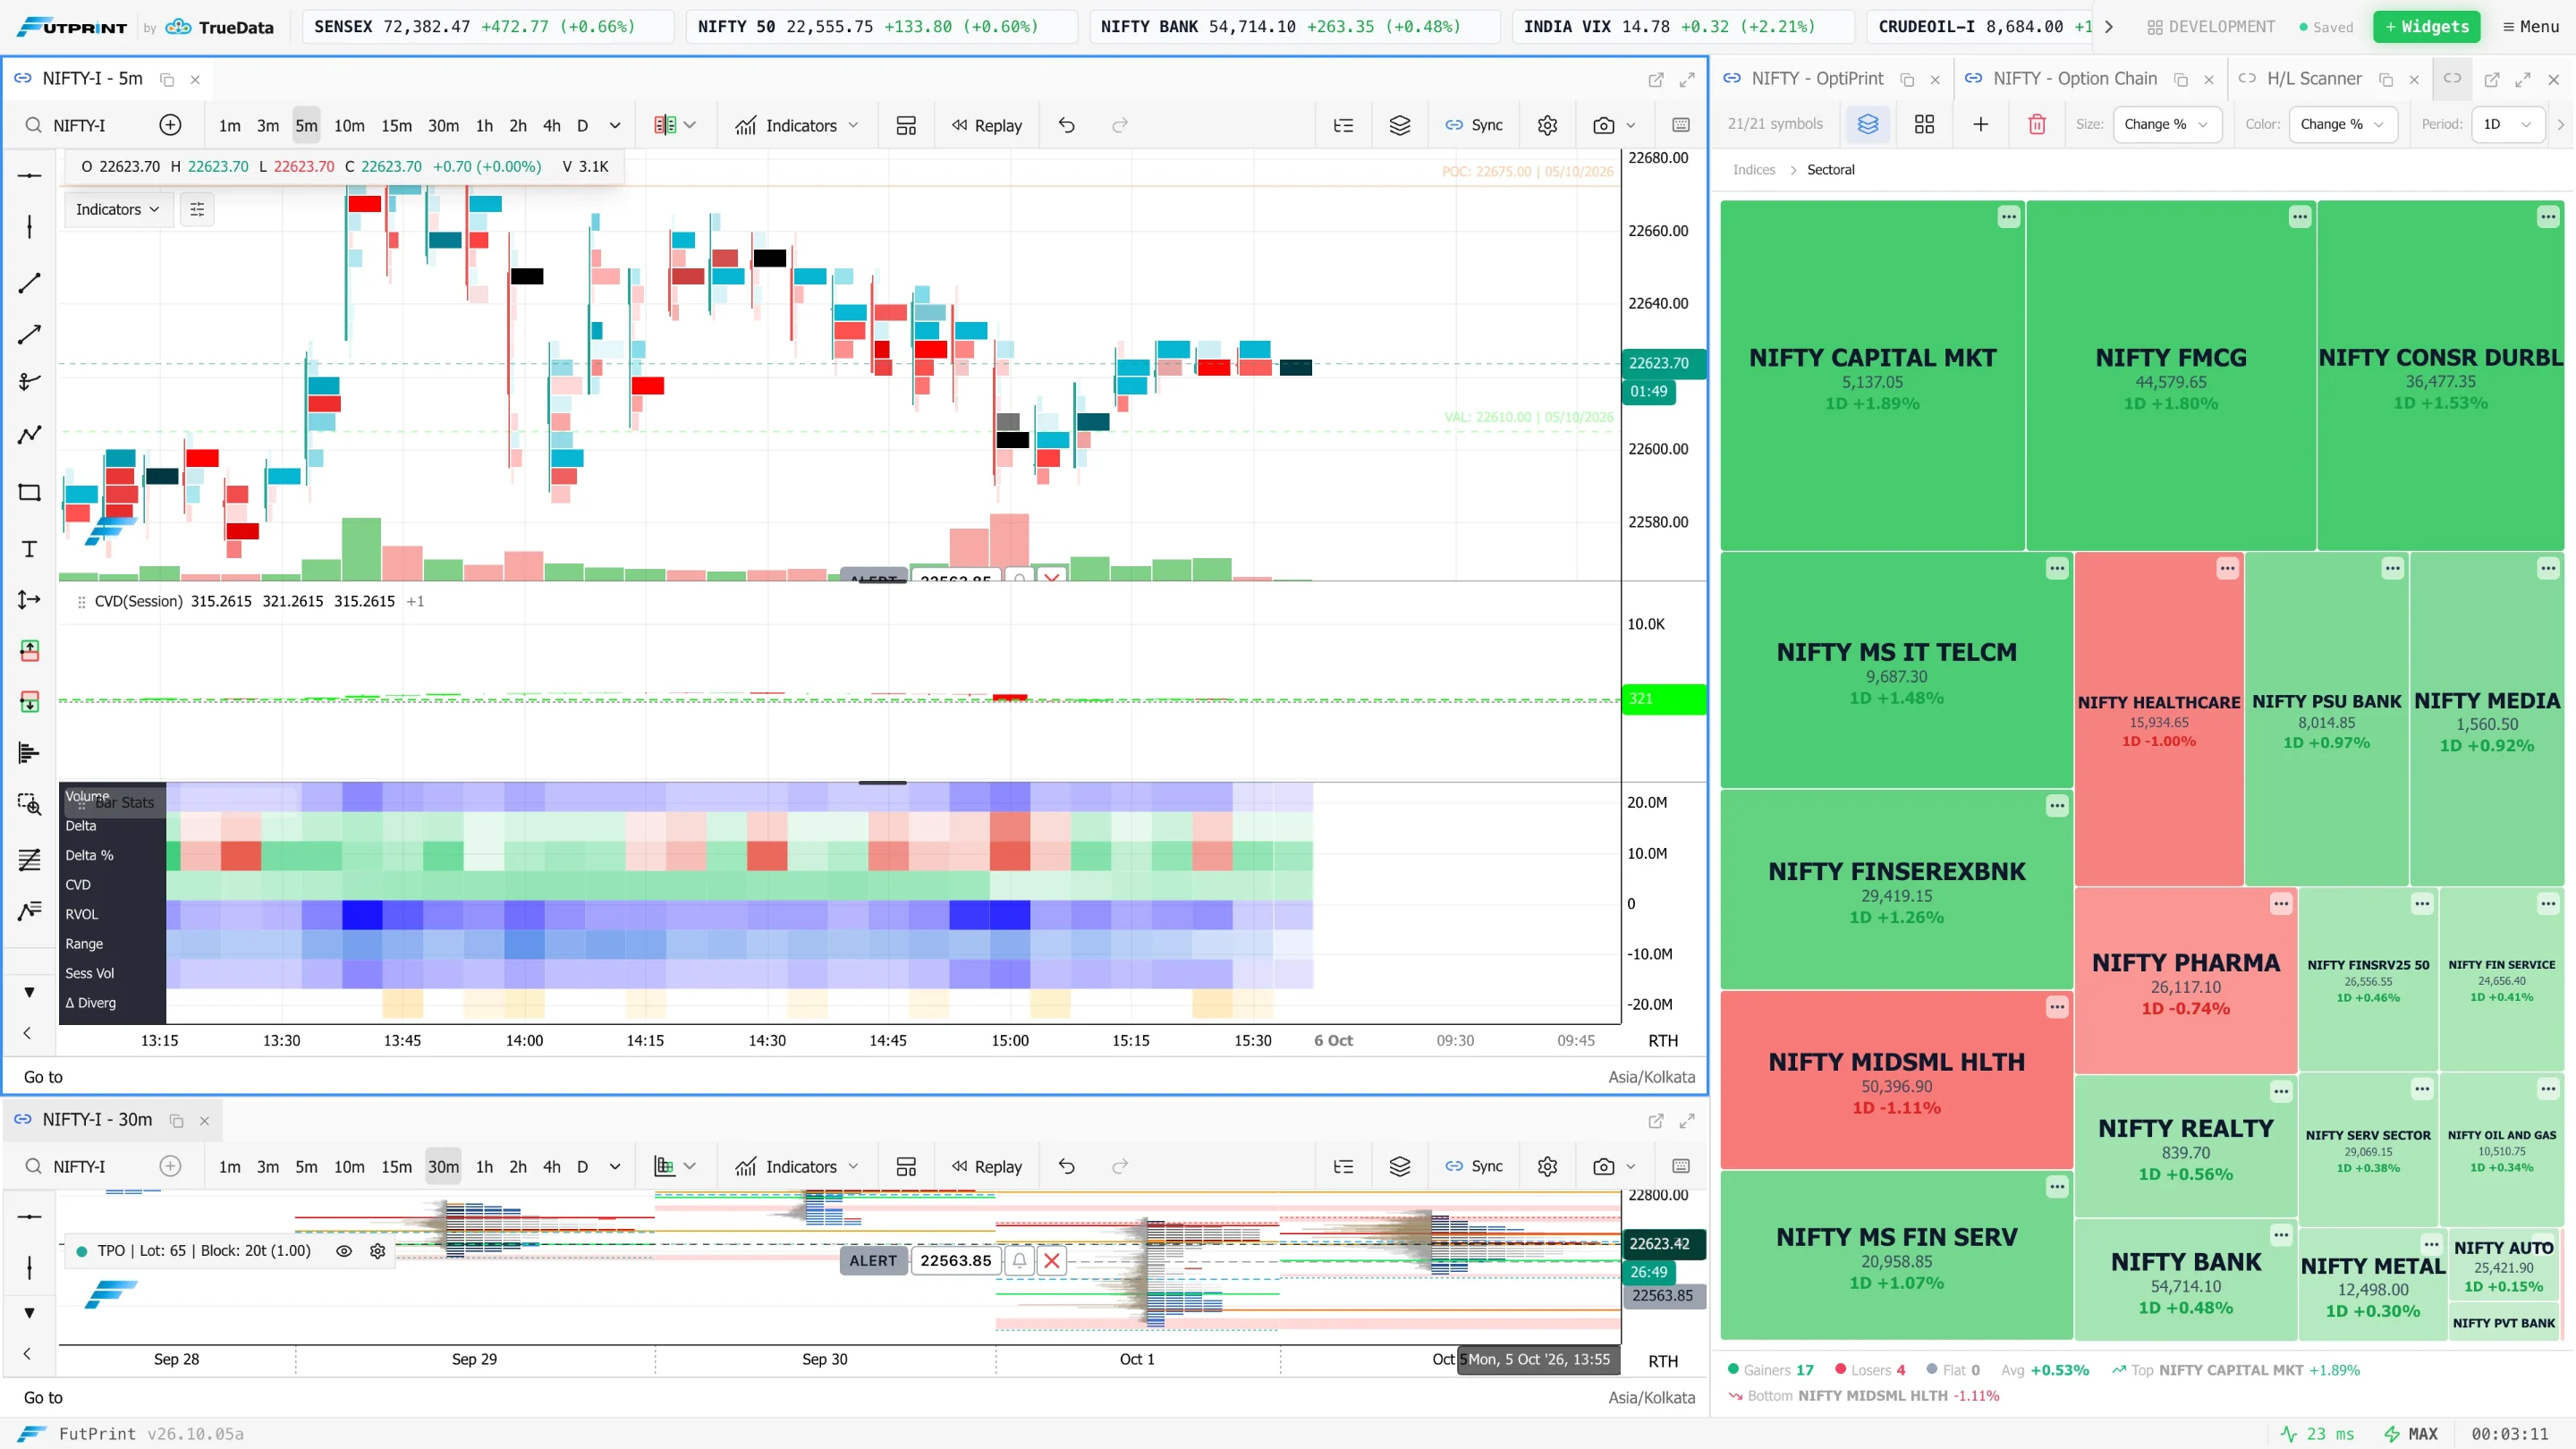
Start with a context chart and a detail chart rather than a wall of panels. Use the context chart to retain the broader session. Use the detail chart to inspect a selected location, changing its mode only when needed. A watchlist can help you maintain awareness of the other instruments you actually follow.
FutPrint's chart modes include conventional price views, footprint and TPO views, plus Tick Number and Tick Range modes where the plan and data support them. Panel availability and counts vary by plan. Select the view based on the measurement you need; do not assume a historical dataset supports every intrabar interpretation.
Save a workspace once the instruments, layouts and settings are deliberate. Before studying a new session, check that the symbol and relevant settings have loaded as expected. A saved layout is convenient, but it is not a substitute for verifying the contract, interval and data timing on the screen.
A practical exercise for the next five sessions
Choose one liquid instrument and one repeatable event, such as the first test of the previous session's high. Keep the chart settings stable. At the test, write three sentences: where the event is occurring, what activity changed, and what response would strengthen or weaken your interpretation. Do this before examining the eventual result.
After the session, add the outcome and one missing piece of information. Perhaps the test failed because participation never developed outside the range. Perhaps the move continued despite an unattractive candle. Resist modifying the rule after every example; collect the full set first so the comparison remains meaningful.
Then assess whether the additional view improved the quality of your observation. Did it clarify a distinction you could not see on price alone? Did it merely make the same story more colourful? Keep tools that answer a concrete question and remove those that consistently interrupt the process without adding useful evidence.
Questions to ask before trusting a conclusion
- Am I observing the correct instrument, expiry, session and data timing?
- Is the level meaningful before the outcome, or only after I have seen it?
- Have I compared activity with a sensible baseline and consistent units?
- Am I counting several displays of the same data as separate evidence?
- What observation would make me change my interpretation?
- Can I explain the event without claiming to know another trader's identity or intention?
The aim is a record that another person could follow from the same data. Clear observations are reusable even when the initial hypothesis fails. Over time, the strongest improvement may be knowing which situations deserve closer investigation and which ones do not yet provide enough information to justify a conclusion.
Further reading
These references provide additional explanations of the concepts covered here. Examples and exercises in this guide are original; platform controls and data conventions may differ.