
 by TrueData
Absorption and imbalance: reading effort against result
A field guide to the moments when aggressive trading meets passive liquidity and price stops behaving normally.
FutPrint by TrueData · Published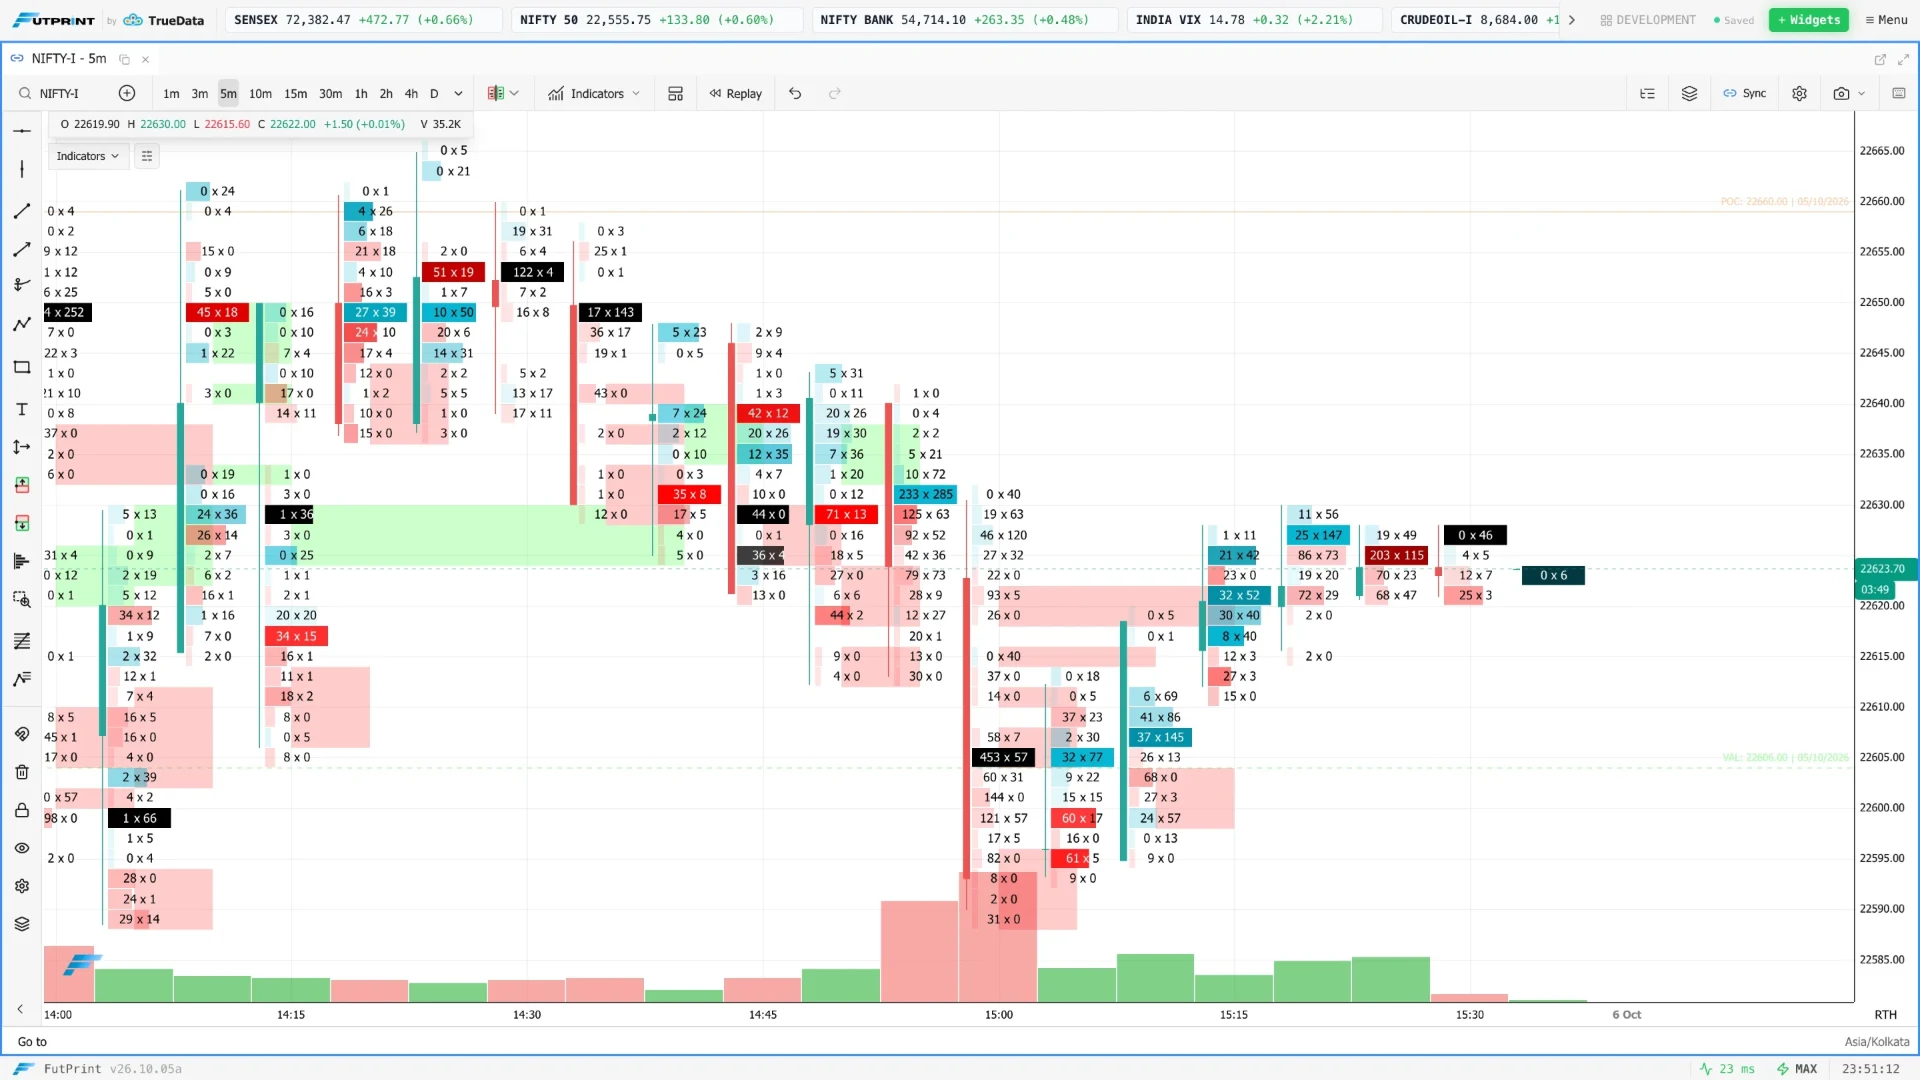
Begin with effort and price response
Absorption is a way of interpreting substantial aggressive execution that produces limited price progress. It suggests that available opposing liquidity is accommodating that activity. The word describes an inference from a sequence; a footprint cell alone does not identify who supplied the liquidity or prove that the sequence must reverse.
An imbalance is a measurement rule applied to classified volume, often comparing quantities at neighbouring prices. Absorption and imbalance can appear together, but they are not synonyms. An imbalance describes a ratio or difference. Absorption describes the relationship between activity and its apparent price impact over a selected interval.
This distinction is the foundation of a careful workflow. First identify what the data directly shows. Then state the interpretation and the observation that could disprove it. The goal is to make a complicated-looking footprint readable without turning its colours into instructions.
Every aggressive trade meets a counterparty
A buyer-initiated transaction executes against an available sell order. A seller-initiated transaction executes against an available buy order. There is no completed trade with only one side participating. High aggressive buying volume therefore does not mean there was no selling; it means the buyer demanded immediacy under the classification used by the feed.
If repeated buying trades at a similar price, sufficient offered liquidity is being supplied over that interval. That liquidity could come from one participant, several participants or orders that are being replenished. Public trade records generally cannot establish which explanation is correct.
Avoid claims such as "a bank is defending this level" unless separate evidence supports them. A more useful note is "1,800 contracts traded on the ask within this band while the local high advanced by only one increment." The second description can be checked, compared and revised.
Define the observation window
The impression of absorption depends on how you frame time and price. A brief stall inside a continuing advance is different from sustained activity at a session extreme followed by a move away. Decide whether the observation concerns one bar, several bars, or a specific event window on the tape.
Also define what counts as limited progress. Is it small relative to the preceding burst, to the usual range for that interval, or to the quantity traded? Without a comparison, a claim that price "did not move" can be subjective. A few increments might be substantial in one instrument and negligible in another.
Use an explicit baseline during review. Compare similar periods of the session and avoid mixing contract sizes. The ratio of traded quantity to price movement can be a useful descriptive aid, but it is not a universal absorption score that transfers unchanged across markets.
How diagonal imbalance comparisons work
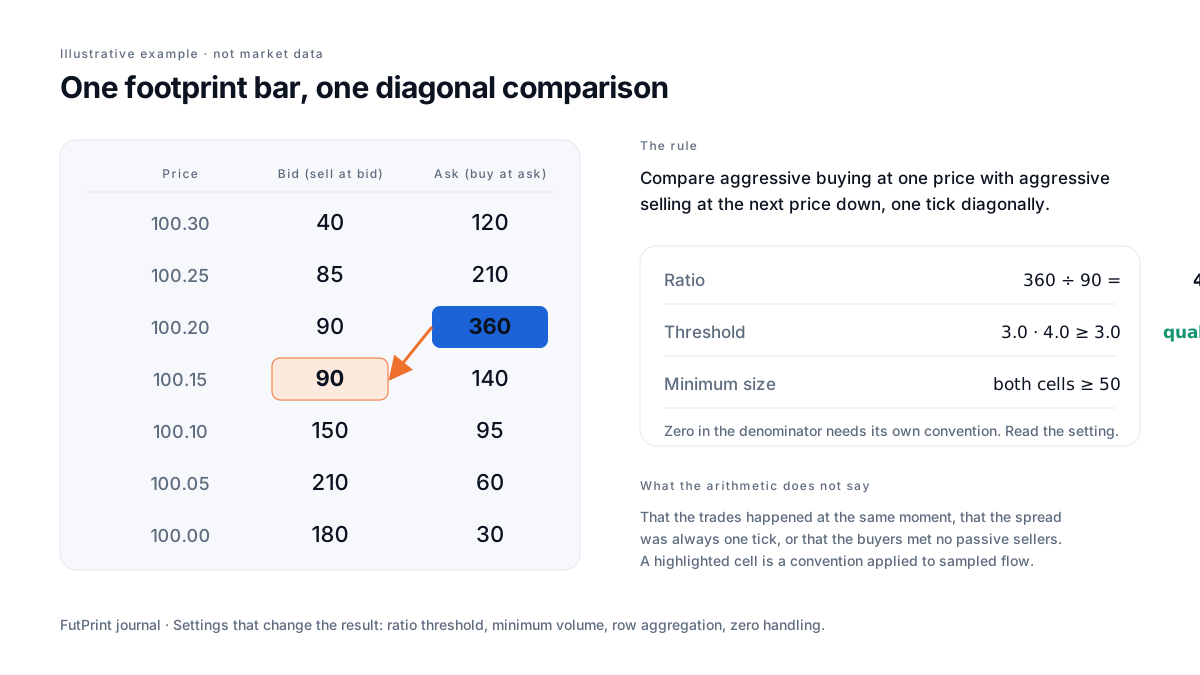
A common footprint rule compares aggressive buying at one price with aggressive selling at a neighbouring lower price. The opposite comparison can identify selling dominance. Platforms differ in thresholds, zero handling and aggregation, so verify the actual rule before interpreting the highlight.
For a hypothetical example, an ask-side quantity of 360 compared with a neighbouring bid-side quantity of 90 produces a ratio of four. If the configured threshold is three and all other conditions are met, that comparison may be highlighted. The calculation says one classified quantity is four times the other within the selected construction.
It does not prove that the transactions occurred simultaneously, that the spread was always one increment, or that aggressive buyers had no passive counterparties. Diagonal comparisons are an analytical convention. Their usefulness must be judged in context rather than inferred from the precision of the arithmetic.
Thresholds and zero handling change the story
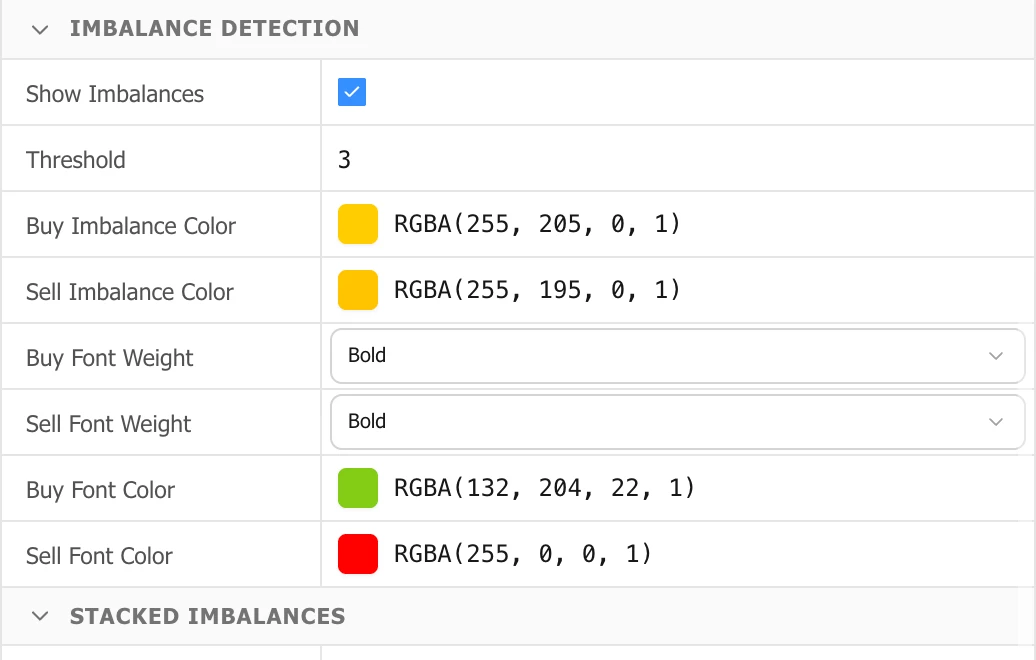
A large ratio can arise from a small denominator. Six contracts compared with one creates the same ratio as six hundred compared with one hundred, but the absolute participation is different. A minimum-volume condition helps distinguish these cases, although the appropriate threshold depends on the instrument and observation scale.
Zero denominators require a convention. A platform may skip them, apply a replacement value or highlight them under a separate rule. Read the setting rather than assuming a zero means exceptional institutional activity. Missing data or a naturally sparse extreme can also produce small or empty cells.
Record ratio, minimum size, row aggregation and zero handling with every study. If the same event is highlighted on one screenshot and not another, configuration may explain the difference. A setting-sensitive signal should not be presented as an objective feature of the market without describing those settings.
Stacked imbalances are a pattern, not an obligation
A stack is a run of qualifying comparisons in adjacent rows under the selected rule. It can help draw attention to concentrated aggressive activity across several prices. The definition depends on how many rows must qualify and whether the algorithm permits interruptions.
An extended stack can be a useful reference when price returns, but the market has no obligation to react there or "finish" a transaction. Every recorded execution already had a counterparty. The zone is a historical feature of the sampled flow, not an unfilled contractual requirement.
On a revisit, compare the response with the original event. Does price cross the zone quickly, accumulate activity inside it, or move away after a brief test? That new evidence determines whether the old pattern remains useful. Do not assume the first touch validates the zone simply because some small reaction occurs.
Worked example: a possible buying-absorption sequence
Imagine a contract approaches a previously marked high at 18,250. During a short observation window, aggressive buying increases near 18,250–18,252, yet repeated attempts above 18,252 do not sustain. The direct evidence is elevated buying activity with limited progress near a prior reference. "Possible absorption" is a reasonable hypothesis, not a completed conclusion.
Next, price rotates to 18,246. If a later attempt to recover the high again stalls and trading develops lower, the original continuation idea has weakened. If instead new buying clears the high and activity establishes above it, the earlier stall may simply have been a pause before liquidity was consumed or withdrawn.
Both outcomes need to remain in the sample. An absorption study that collects only dramatic reversals will exaggerate the usefulness of the initial clue. Save the first observation, the alternative hypothesis and the later response. The sequence is more informative than a single screenshot of the busiest row.
Absorption, exhaustion and an ordinary pause
Absorption suggests activity met enough liquidity to limit progress. Exhaustion usually describes a reduction in aggressive participation after a move. They can coexist, but the evidence differs. One emphasises activity without proportional movement; the other emphasises activity fading. A simple pause may show neither clearly.
Consider two hypothetical highs. At the first, transaction size and frequency remain elevated while price stalls. At the second, both become quieter after the advance. Calling both absorption loses a meaningful distinction. The later response may still be similar, but the process leading to it was not.
Do not infer exhaustion solely from the last completed footprint row at an extreme. A bar boundary, a filter or incomplete data can create a thin appearance. Compare the surrounding sequence and confirm the dataset is current before assigning the interpretation.
Why row size and candle boundaries matter
Combining several price increments into a row changes the numerator and denominator of an imbalance calculation. A stack visible at one increment per row may disappear when four increments are grouped together. The latter display has not disproved the former; it has asked a different aggregation question.
Bar boundaries also partition the sequence. A burst that straddles the end of a one-minute candle appears across two bars, while a longer candle may contain it within one. If your observation depends on one particular boundary, inspect the tape or a different aggregation to understand what actually occurred.
Use sensitivity checks deliberately during research, then keep the operational setting stable. It is reasonable to compare two scales to understand an event. It is less reasonable to keep switching until a desired signal appears and then forget the other views.
Use supporting views for distinct questions
A context chart identifies the meaningful location. The footprint shows classified activity by price within the bars. CVD can summarise net classified activity over a broader interval. The tape preserves event sequence, and depth describes displayed liquidity within its own coverage. Each view contributes something different when used carefully.
However, footprint delta and CVD derive from related data. Seeing them agree is not the same as independent confirmation from an unrelated source. Count the evidence according to its origin, and pay attention to feed and reset differences that can explain an apparent disagreement.
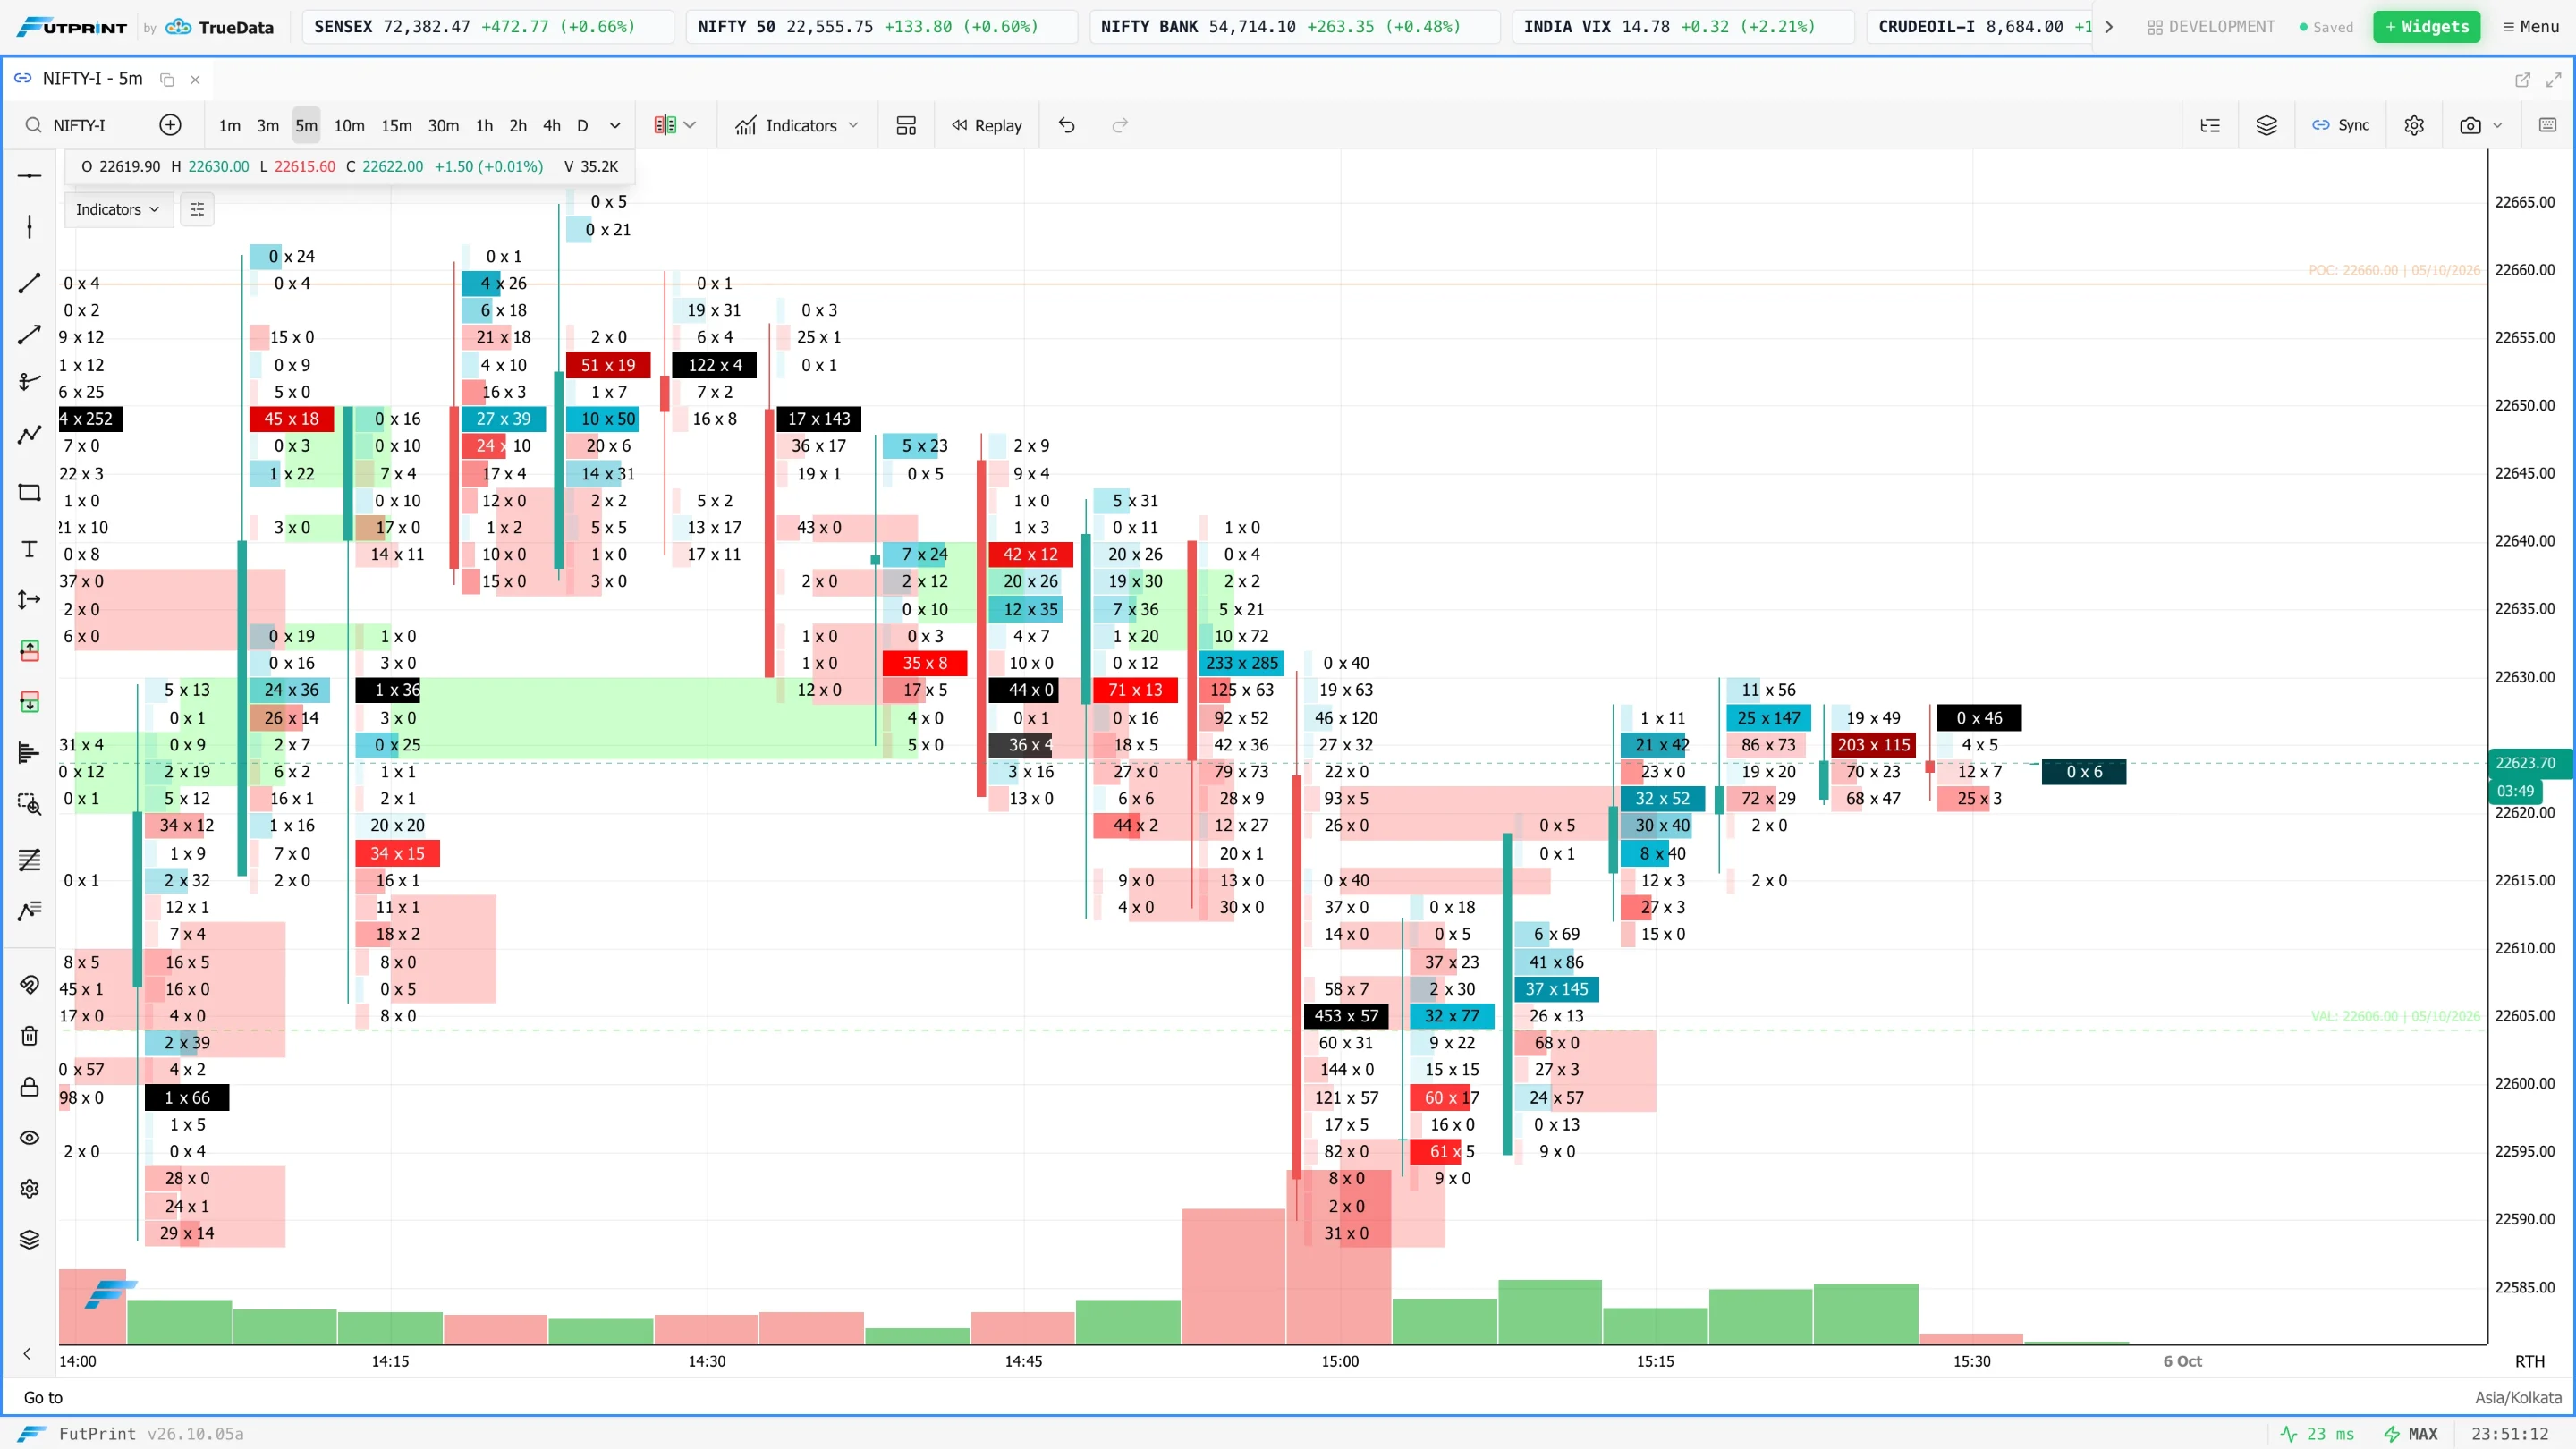
Inside FutPrint, use footprint settings documented in the chart controls and verify that the relevant mode and history are available under the plan. Keep green and red meanings explicit, and use imbalance highlighting as an emphasis layer. A bright colour should direct attention, not replace interpretation.
An event log for absorption research
Build a small event log with timestamp, instrument, level, observation window, total activity, price progress, settings and subsequent response. Include an entry for the competing explanation. This structure turns a subjective impression into something you can compare across sessions.
For example, record twenty consecutive tests of a predefined reference rather than twenty examples you already know reversed. Mark each as continuation, relocation, rotation or unresolved according to rules chosen before reviewing the outcomes. Keep unresolved events in the denominator when summarising the sample.
Then ask which distinctions helped. Was the location relevant? Did duration matter? Did a stack add useful information beyond high activity and limited progress? The aim is not to discover a magical ratio. It is to learn which observations are reliable enough to include in your own process.
Questions that prevent overinterpretation
Does an imbalance reveal an institution?
No. A ratio describes classified activity, not participant identity. Large firms can split orders, small participants can collectively produce large activity, and one strategy can trade in both directions for reasons invisible on the chart. Describe what is measured rather than assigning an actor to it.
Does absorption mean reversal?
Not necessarily. Opposing liquidity can eventually be consumed, withdrawn or replaced at another price. The market may continue, rotate or reverse after a stall. A useful analysis specifies what follow-through would support each interpretation and recognises when the evidence remains inconclusive.
Should every highlighted zone be extended?
Only if doing so serves a defined study. Extending every zone creates clutter and increases the chance of finding accidental reactions. Select references by a consistent rule and keep a record of zones that price crosses without a meaningful response. Those failures are part of evaluating the method.
Compare an apparent success with a counterexample
Take two events at similar locations using the same instrument and footprint settings. In the first, aggressive buying appears near a boundary, price stalls and then moves lower. In the second, buying also appears near the boundary, price stalls briefly and then continues higher. Both contain the initial observation of effort with limited immediate progress. Only the later response distinguishes the completed paths.
Place the captures side by side at the moment before the outcomes diverged. Ask what information was actually different then. Perhaps the preceding context, duration of the pause or distribution of volume differed. Perhaps nothing in your chosen measurements distinguished them reliably. The second answer is useful: it identifies a limit in the observation rather than forcing an explanation onto the losing example.
Now define a follow-up measurement before studying additional cases. You might record whether the next fixed time window trades beyond the boundary and where it finishes. Keep that window constant and include ambiguous outcomes. Do not extend it until each case eventually produces the response you expected; doing so changes the question from immediate behaviour to whether a level was ever revisited.
This paired exercise is especially valuable for visually striking imbalances. Bright highlights are easy to remember, while ordinary highlighted bars that lead nowhere are easy to forget. A counterexample collection restores balance to the study and makes your vocabulary more precise. You can then say what the footprint showed, what followed and which part remains an interpretation, without claiming access to the intentions of the participants involved.
Further reading
These references provide additional explanations of the concepts covered here. Examples and exercises in this guide are original; platform controls and data conventions may differ.