
 by TrueData
Market structure, VWAP and the context around a move
Combine swing structure with a volume-weighted reference to keep intraday decisions anchored.
FutPrint by TrueData · Published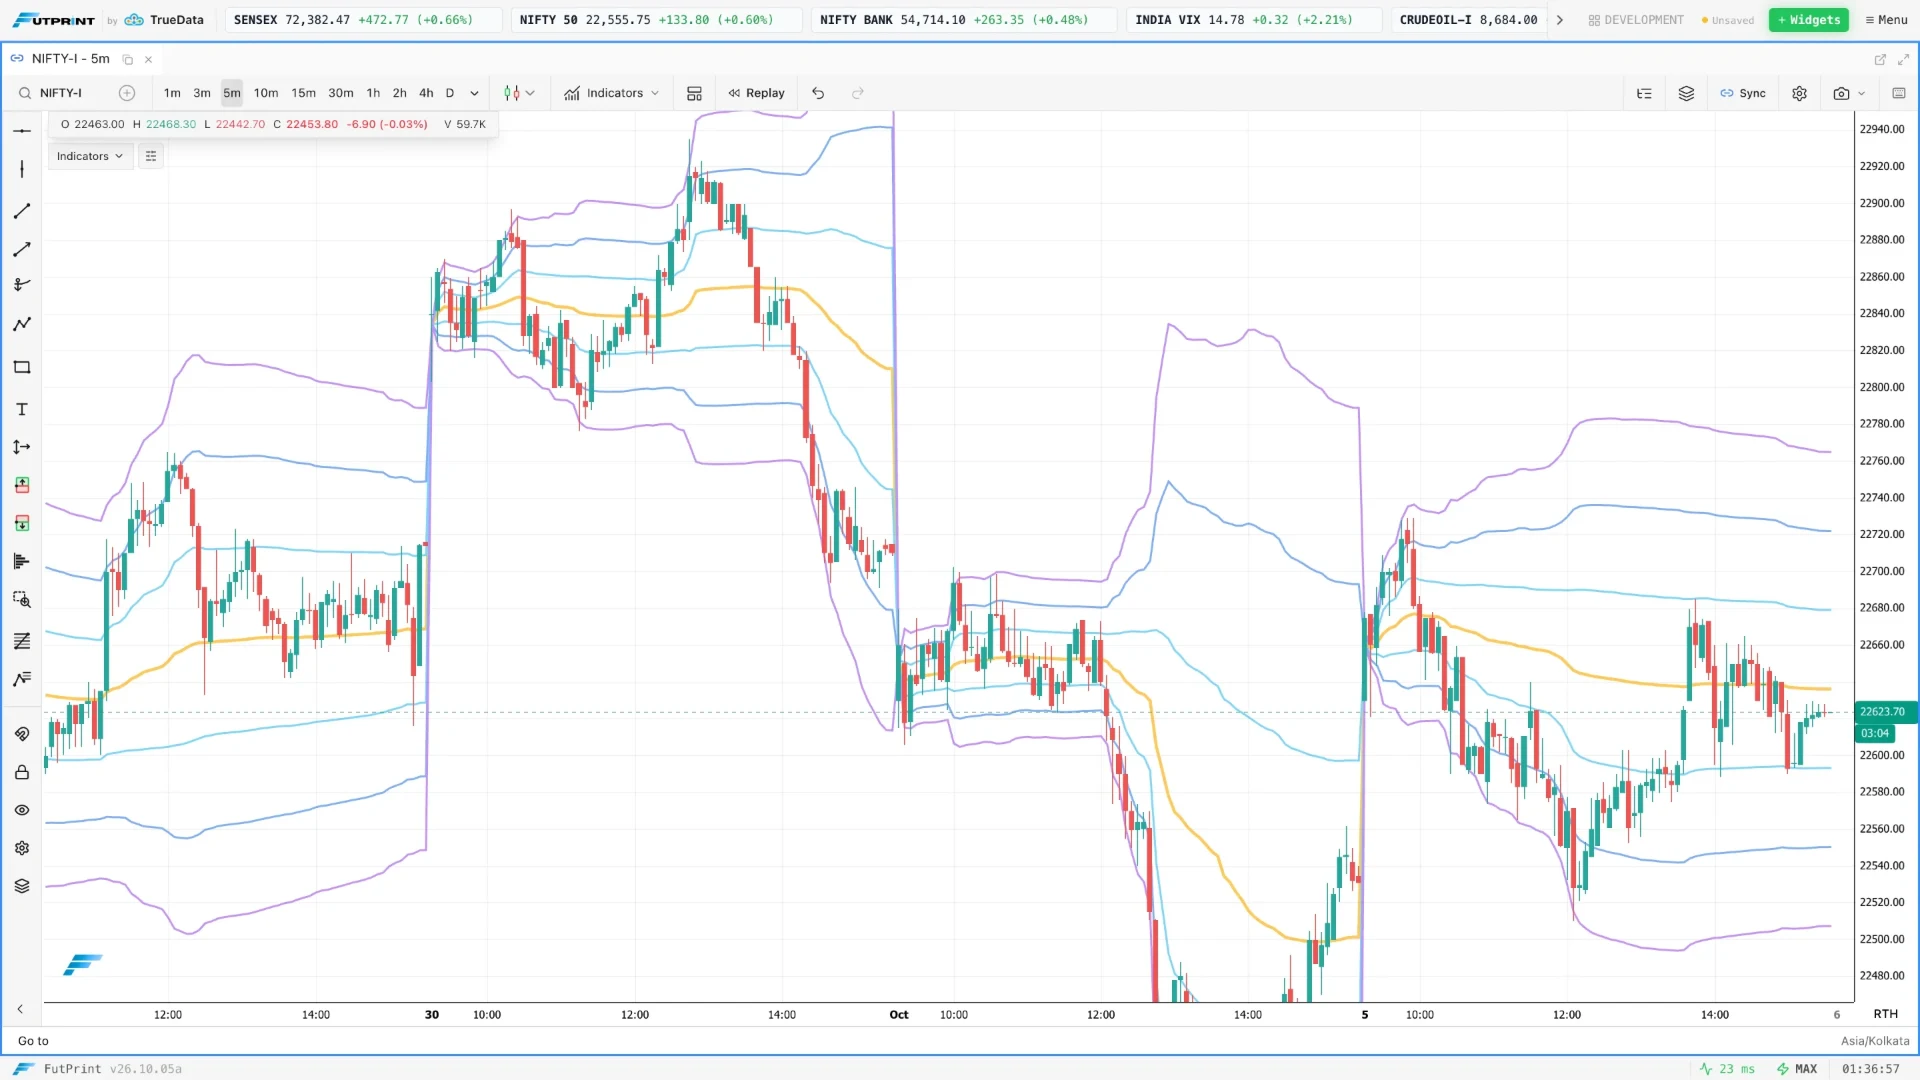
Give price a sequence and a reference
Market structure describes the sequence of price movements you choose to observe. VWAP describes a volume-weighted average over a selected measurement period. Used together, they can help distinguish where the market has travelled from where activity has been concentrated on average. They do not eliminate the need to define the instrument, timeframe and decision horizon.
A useful starting question is not whether price is above or below a line. It is whether the current movement is extending an established sequence, interrupting it, or remaining inside a broader balance. VWAP then provides another reference for describing that movement. A crossing means price changed sides relative to the average; its significance depends on the surrounding auction.
This guide uses hypothetical prices and volumes to explain the calculations and the reasoning. The exercises are designed to build consistent observation, not to prescribe entries from a single indicator condition.
Make your definition of structure explicit
Different traders identify swings differently. One may require several bars on either side of a high. Another may use a minimum price movement. A third may simply mark visually obvious turns. These methods can produce different structures on the same history. Write your method down before comparing examples.
Also separate a local swing from a broader one. A short pullback can make a lower high on a one-minute chart while remaining inside an intact hourly advance. Saying "structure broke" without naming the scale leaves too much room for interpretation. State which swing was crossed and why it was significant to the current question.
A clear record might read: "Price traded below the last fifteen-minute pullback low, then failed to recover it during the next rotation." That description is observable. A label such as bearish shift may be convenient shorthand, but it should not replace the actual sequence in your notes.
Understand the VWAP calculation
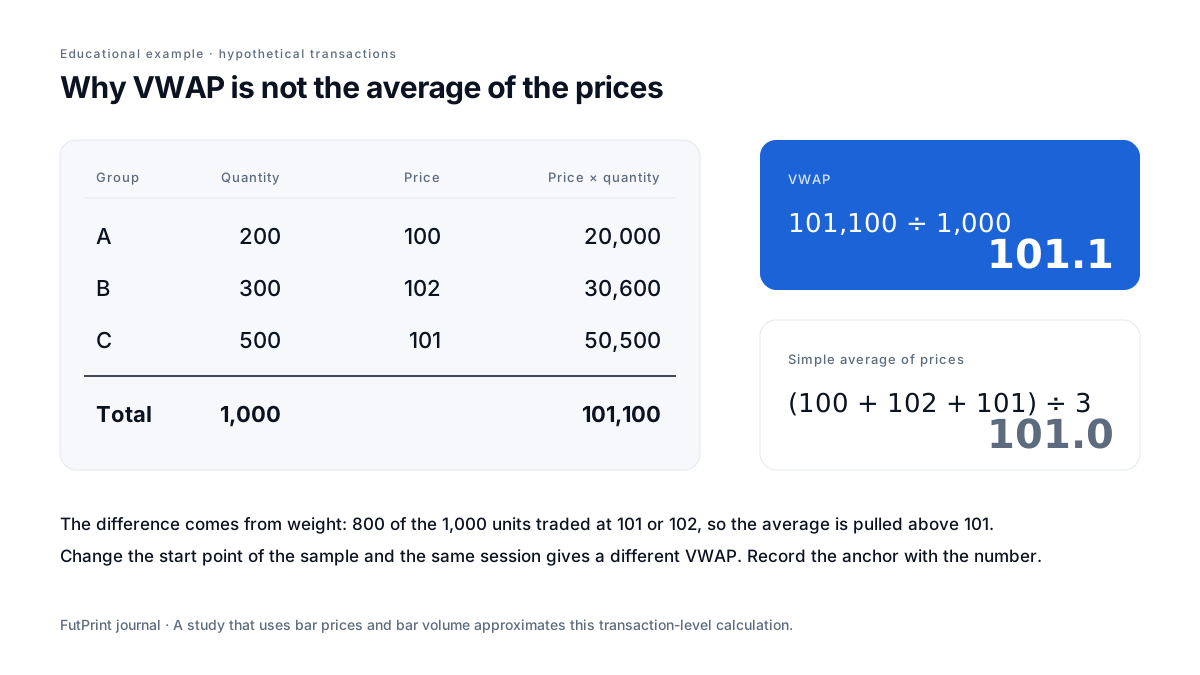
At transaction-level resolution, VWAP is the sum of execution price multiplied by execution size, divided by total size over the chosen period. The start point is part of the definition. A session VWAP and an anchored VWAP beginning later in the day can both be correct while showing different values.
Consider three simplified groups of transactions: 200 units at 100, 300 at 102 and 500 at 101. Total quantity is 1,000. The weighted sum is 101,100, producing a VWAP of 101.1. A simple average of the three quoted prices is 101. The difference arises because the transactions at 102 and 101 carry more weight than those at 100.
Some chart studies approximate the calculation using bar prices and volume rather than individual transactions. The selected price source and data resolution then matter. Two studies called VWAP can differ if their inputs or session definitions differ. Check the settings before deciding that one line is incorrect.
Why the average becomes harder to move
A cumulative average incorporates more history as the period progresses. Early in the session, a modest amount of new activity can move VWAP noticeably. Later, the same quantity has less influence because it is being combined with a larger accumulated base. This is arithmetic, not evidence that participants suddenly care more or less about the line.
Continuing the example, add 100 units at 105. The weighted sum becomes 111,600 and total quantity becomes 1,100, giving a VWAP of approximately 101.45. Price reached 105, but the average remains much lower because the earlier 1,000 units still dominate the calculation.
This helps explain why a strong late move can remain far from session VWAP. Distance alone does not prove price must reverse. It says the latest transactions differ from the cumulative average. Whether they establish a new trading area requires observation of current activity and subsequent price behaviour.
Session boundaries and anchors
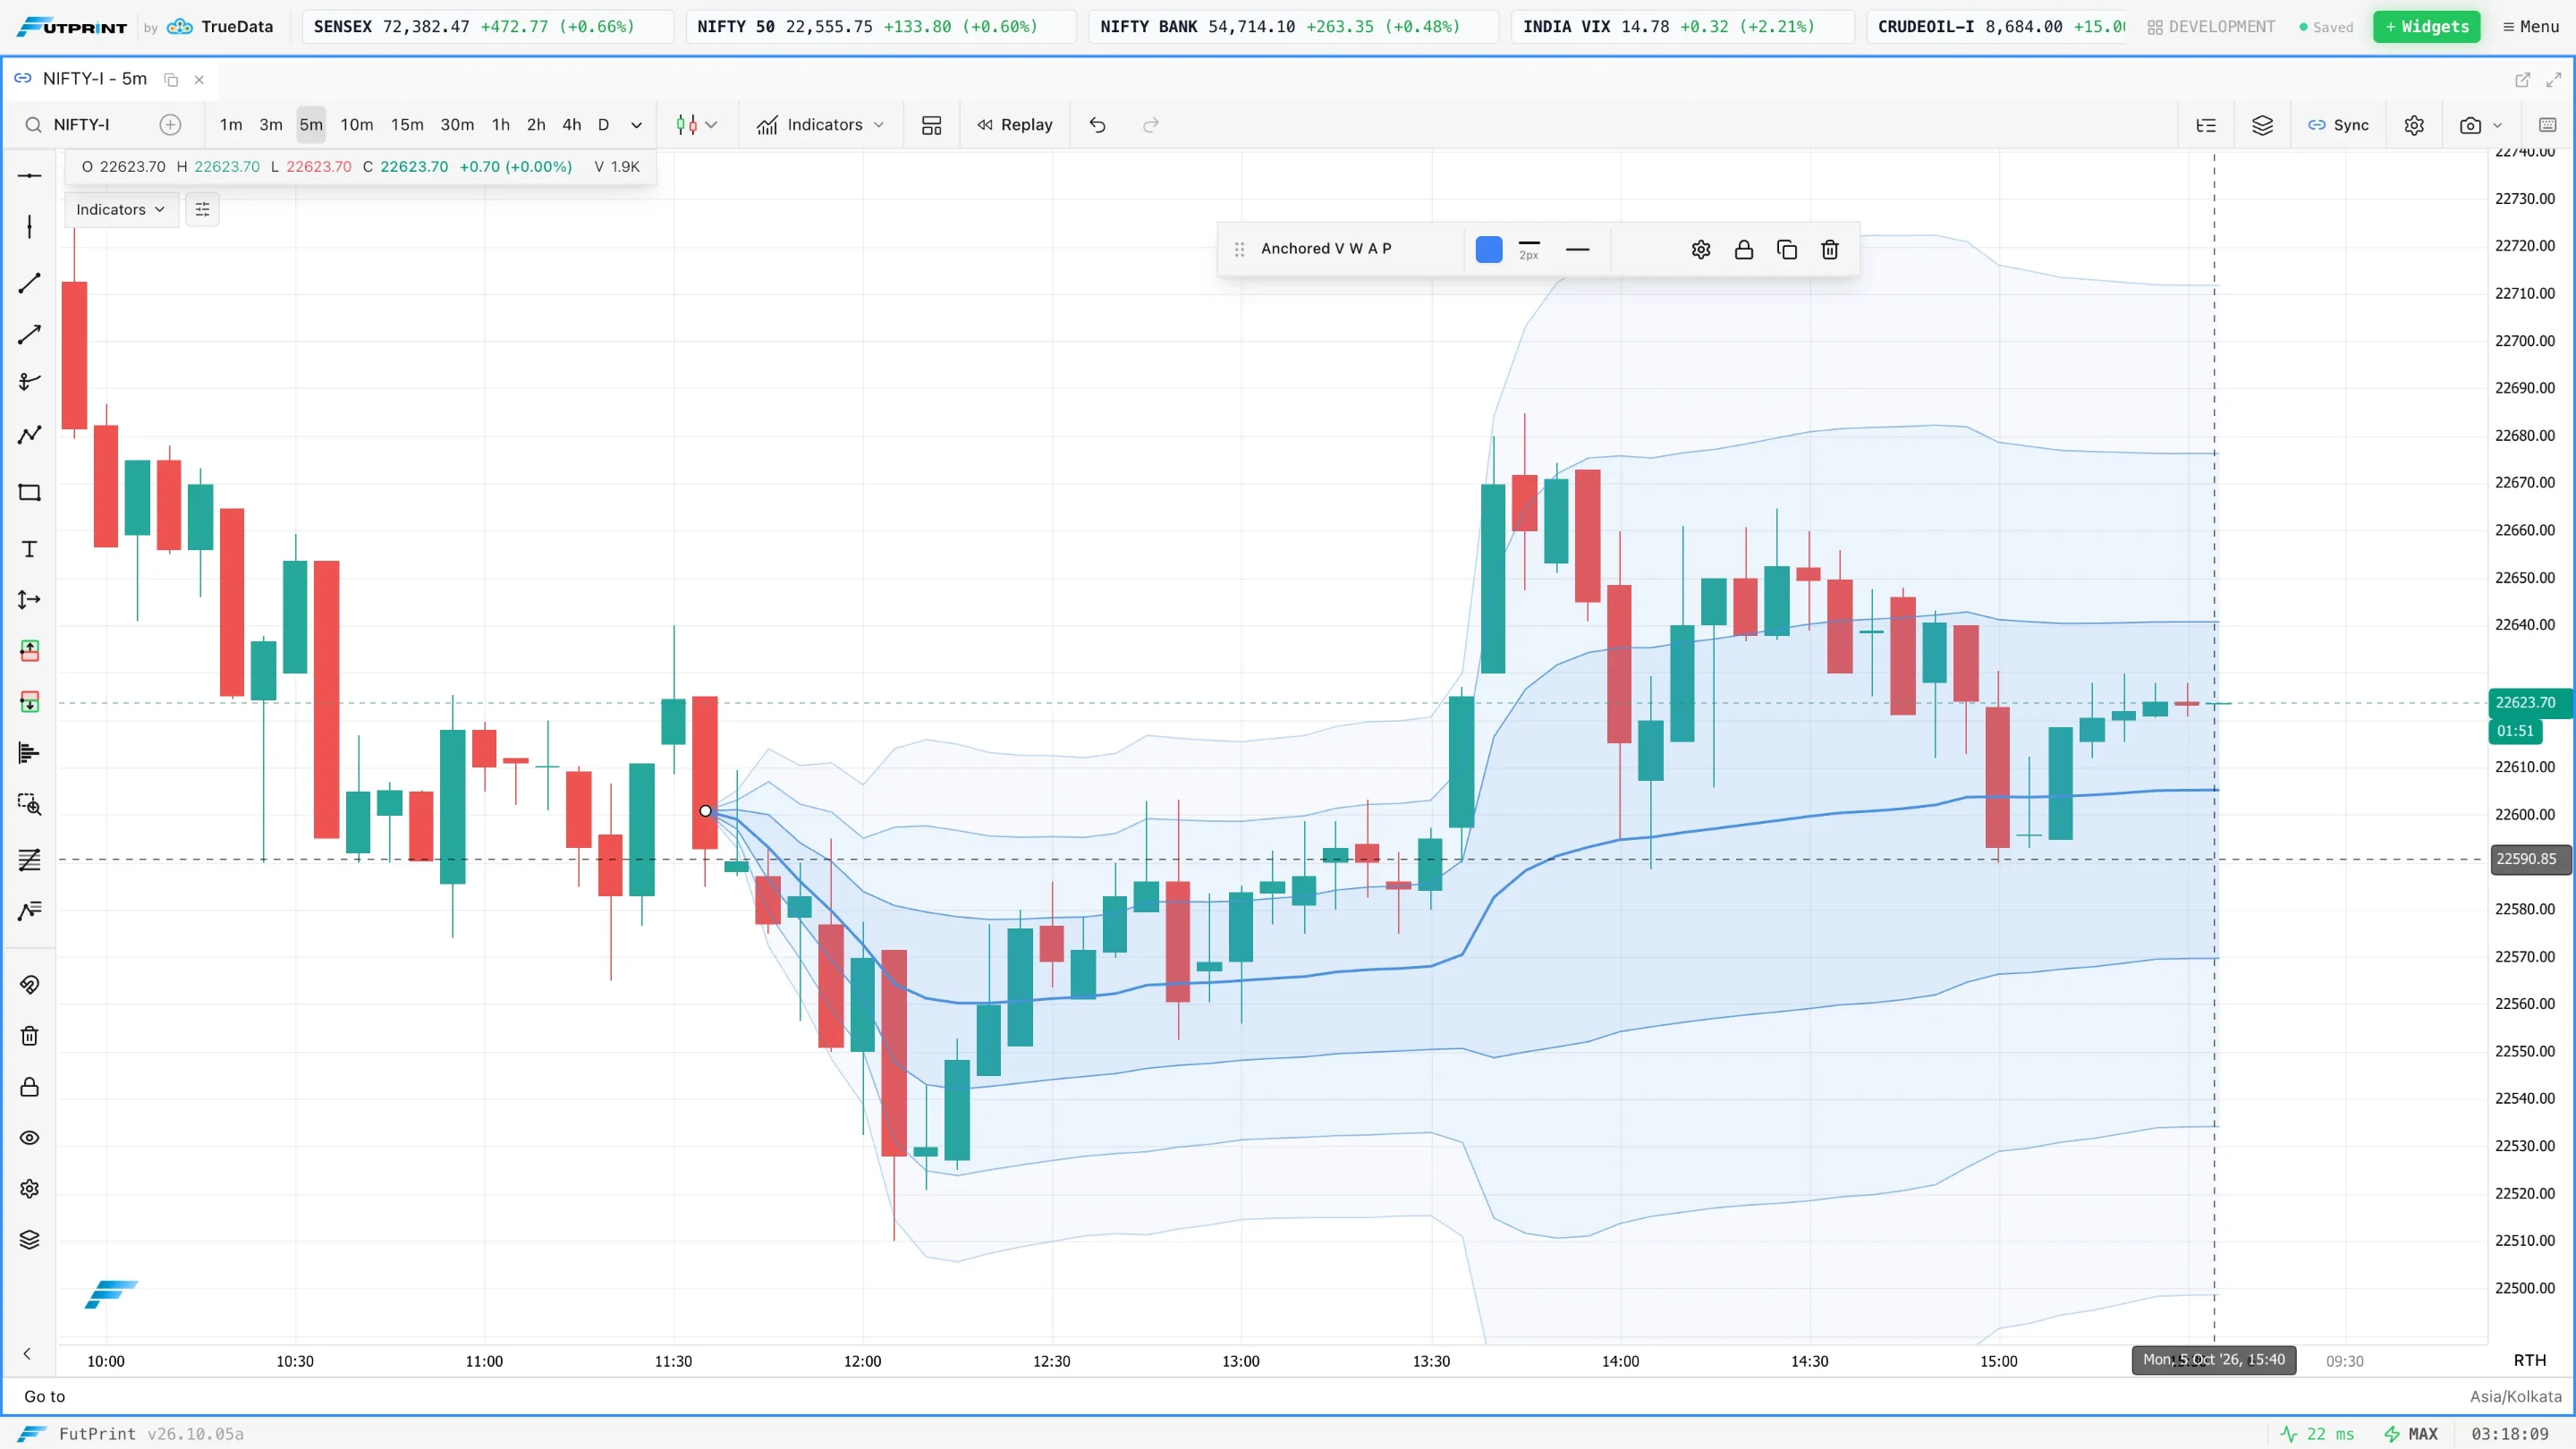
For a session-based study, check the timezone, trading session and treatment of any pre-open or extended activity. A different starting boundary changes the included transactions. For an anchored study, document the event that justified the anchor: a session open, a known announcement or a predefined swing.
Avoid moving an anchor after each outcome until the line appears to explain the chart. That creates a flexible drawing tool rather than a testable reference. You can explore different anchors during research, but an example used to evaluate a rule should retain the anchor selected before the outcome.
When comparing days, keep the convention stable. If one day's VWAP includes a different session segment, the difference may reflect configuration rather than a meaningful change in behaviour. A useful screenshot includes the anchor or session definition so another reader can reconstruct the measurement.
A trend does not require constant contact with VWAP
During a directional session, price may remain on one side of VWAP for a long period. The average is still catching up with the new transactions. Repeatedly anticipating a return simply because price looks distant can turn a descriptive indicator into an unsupported prediction.
Instead, compare the movement's sequence. Are pullbacks becoming deeper? Are prior local highs being recovered? Is new activity developing near the recent prices? These observations can change while price remains above VWAP. Conversely, a brief crossing below the average may occur without ending a broader advance.
Use language that preserves the distinction. "The latest pullback crossed session VWAP" is a fact. "The session has reversed" is an interpretation requiring a definition and additional evidence. Keeping those separate makes it easier to revise the interpretation when the next rotation contradicts it.
Worked example: a reclaim with two outcomes
Imagine a market opens at 1,000, declines to 990 and later returns to a VWAP near 997. At 10:20 it trades above the average. This hypothetical reclaim is the start of a question: will transactions develop above the reference, or will price return to the lower area?
In one continuation, a pullback finds trade near 997, the next rotation exceeds the earlier local high and activity builds around 1,001. That sequence supports a more constructive local interpretation than the original crossing alone. In another, price briefly reaches 999, falls through 997 and later fails to recover it.
The indicator event was similar; the following structures differed. A journal should record both. If your study labels the first crossing as a signal, it must include every qualifying crossing under the same rule, not only those followed by a clean continuation. Otherwise the apparent reliability is created by selection.
Bands describe dispersion, with implementation limits
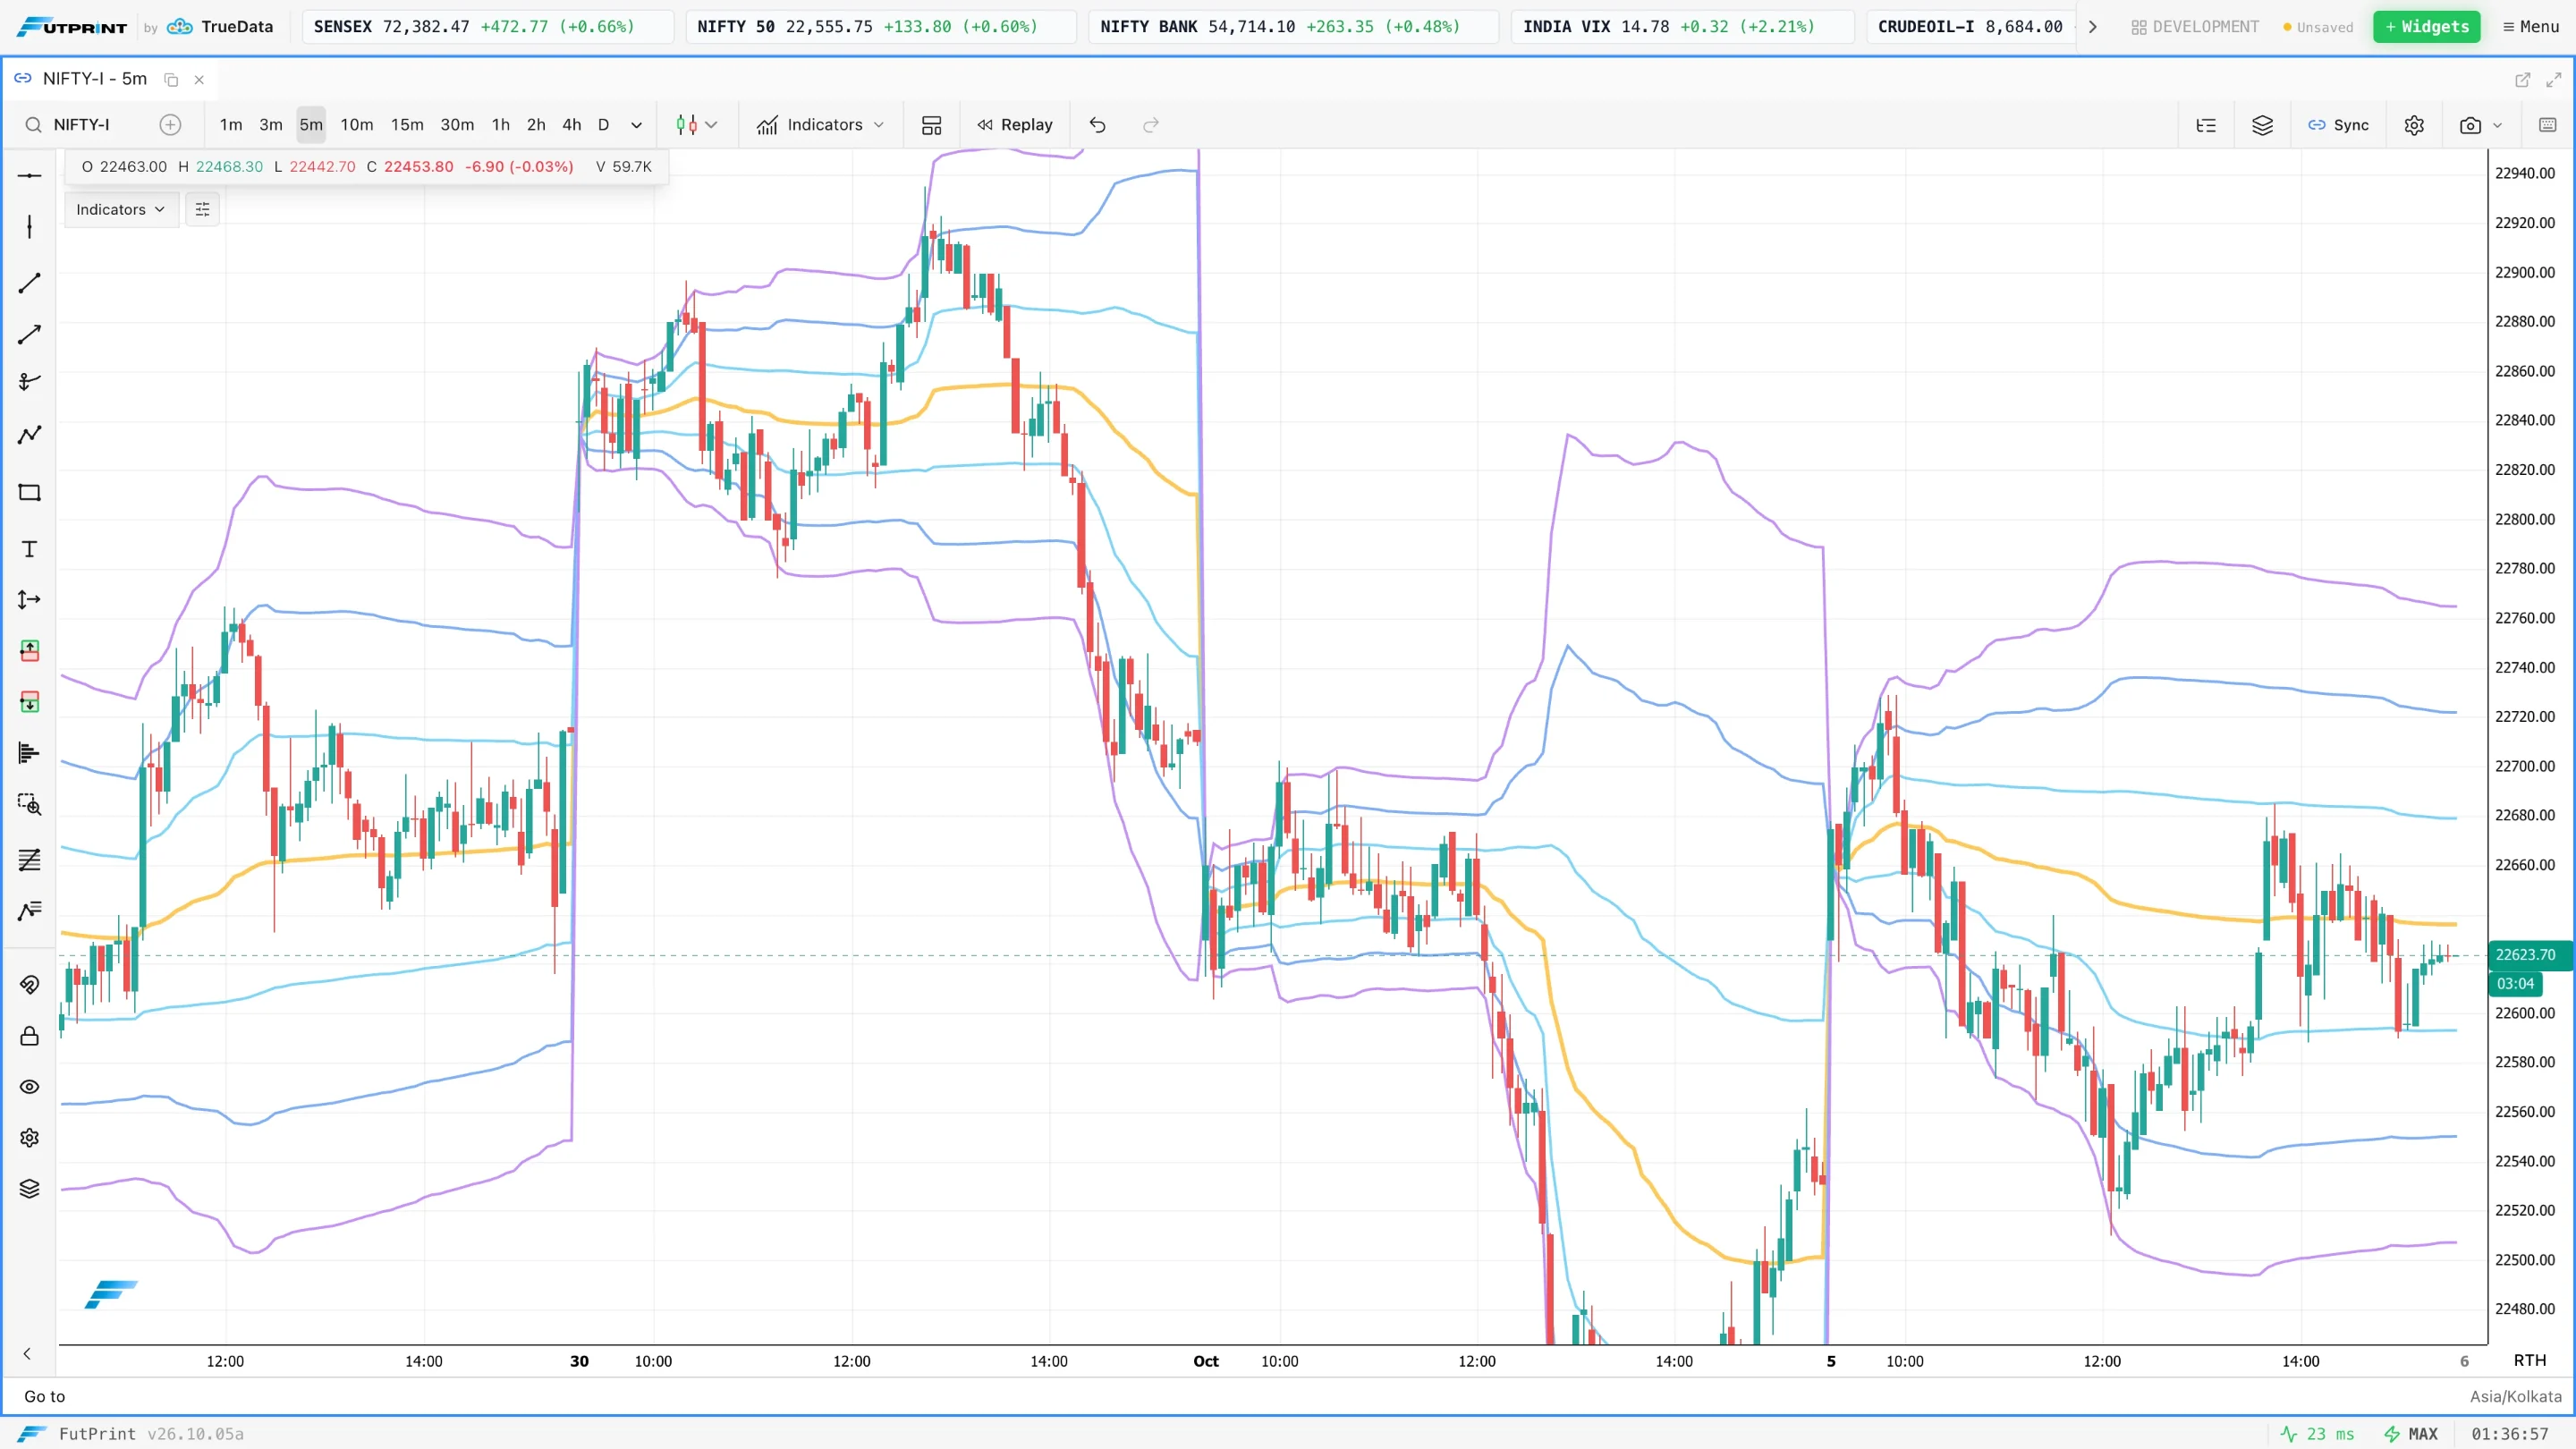
VWAP bands may be based on standard deviation, fixed percentages or other calculations. Their meaning depends on the chosen method and inputs. A line labelled one deviation is not automatically a probability boundary for future price, especially in a non-stationary intraday market.
Think of a band as another descriptive distance scale. A touch can identify an observation area, but it cannot establish that price is statistically required to return. Persistent directional activity can keep price near an outer band or carry it beyond that band while the calculation adapts.
Before using bands in a review, record the calculation, multipliers and session. If you cannot reproduce them, omit probability language. It is more accurate to say that price reached a selected dispersion reference than to attach a confidence percentage that the study does not justify.
VWAP and profile answer different questions
VWAP is an average; a profile is a distribution. Two different distributions can share the same average. A market with activity concentrated near the middle and a market with activity split between two distant areas may therefore have similar VWAP values while presenting very different structures.
Use a profile when that distinction matters. If the average lies in a relatively thin area between two concentrations, calling it the most accepted price would be misleading. The volume POC identifies the most active row, while VWAP balances the complete sample by quantity. Neither should be substituted for the other without explanation.
In practice, a profile can frame the earlier areas of activity and VWAP can track the cumulative reference through the current session. Add order-flow detail only when you have a specific question about a test. More lines do not automatically create more information.
Indian-market context and price sources
Use the volume of the instrument you are actually studying. A futures VWAP belongs to that contract, and an option VWAP belongs to that strike and expiry. Neither is automatically the volume-weighted average of the cash index. An index-derived reference requires a clearly stated data method.
For options, a premium's movement reflects several changing inputs. A crossing of its VWAP should not be interpreted as proof that the underlying has changed direction. Compare the underlying separately and consider whether the option is sufficiently liquid for its average to be informative over the selected period.
During rollover, check the contract and historical series. If a continuous chart combines contracts, understand how the price and volume history has been constructed. A visually smooth series may be convenient for structure, but execution-based conclusions need care around any adjustments or changes in the underlying contract.
Build the study inside FutPrint
Start from a conventional price chart, establish the symbol and interval, then select the VWAP study available in the indicator tools. Inspect its settings rather than assuming a default anchor or price source. Keep the chart readable: structure marks, the chosen average and perhaps a single supporting view are enough for an initial study.
Use replay to observe how both price and the indicator develop. Confirm that the study is calculated from the data available at each replay point. A final session reference should not be used to justify a decision from the morning unless that reference was already known at the time.
Save the workspace after verifying the configuration. If you maintain separate session and anchored studies, name or colour them clearly. A later screenshot should make it obvious which average you are discussing without requiring the reader to infer it from the line's location.
Review exercise: separate crossing from confirmation
Choose ten consecutive sessions and define one crossing rule in advance. For example, observe the first completed bar that crosses session VWAP after an initial directional move. Record the surrounding swing sequence, distance from the open, elapsed session time and what happens over a fixed next interval.
Then classify the responses descriptively: sustained trading on the new side, immediate return, or repeated crossings without clear relocation. Compare the groups before proposing any execution rule. You may find that the crossing itself is common while the subsequent structure provides the more useful distinction.
Do not change the definition halfway through the sample. If you discover a better question, finish the current record and test the revised question separately. This preserves the value of the first exercise and prevents gradual rule changes from making the past look artificially consistent.
A concise pre-observation checklist
- Identify the instrument, contract and volume source.
- State how swings are defined and which timeframe supplies the structure.
- Confirm the VWAP start point, session and calculation settings.
- Separate a line crossing from evidence of a sustained change.
- Treat band distances as measurements rather than guaranteed reversal zones.
- Save the observation before revealing the outcome in replay.
The combination becomes useful when both tools retain clear roles. Structure describes the path; VWAP provides an average over a defined sample. Your task is to explain their relationship with observable evidence, including the occasions when the relationship remains inconclusive.
Review the references that existed at the time
When saving an example, distinguish confirmed swings from developing ones. A swing that requires later bars for confirmation was not yet a confirmed reference at the apparent turning point. Mark the confirmation time in your review. Otherwise the chart can suggest that a clean structural signal was available earlier than it actually was.
Apply the same discipline to anchored VWAP. An anchor chosen after observing the whole move can provide a helpful retrospective description, but it does not demonstrate that you would have selected that anchor in advance. Keep a separate record of preselected anchors and exploratory anchors. Both can support learning, provided their roles remain explicit.
Finally, preserve a screenshot at the decision time as well as the completed session. Compare the developing line, available swing structure and your written hypothesis. This often reveals that the most important improvement is not another indicator setting, but a clearer account of which references were available and how much confirmation they required. A chart should help reconstruct a decision rather than quietly replace it with hindsight.
Further reading
These references provide additional explanations of the concepts covered here. Examples and exercises in this guide are original; platform controls and data conventions may differ.