Time & Sales
The Time & Sales Panel (also called the Tape) shows live trade prints for a selected instrument, with price, quantity, side, and notional value. It’s optimized for speed and clarity with color-coded rows and a virtualized list to handle high-throughput markets.
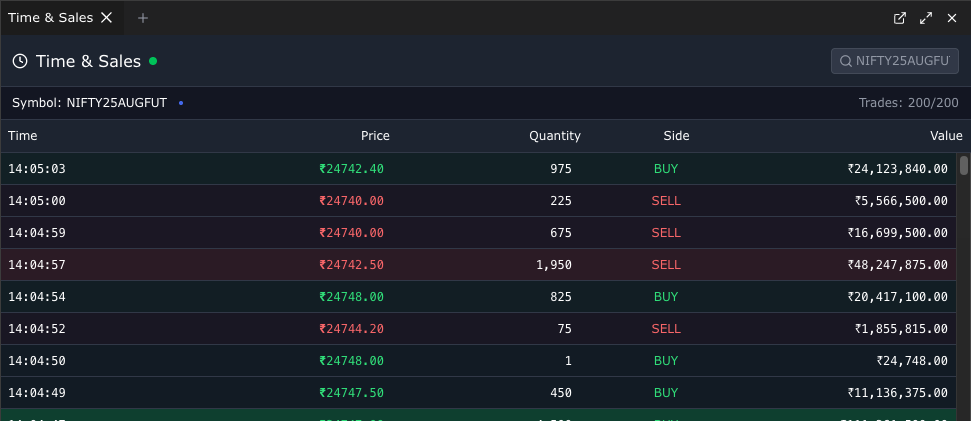
Time & Sales panel in FutPrint
1. Header and Live Status
- Title: “Time & Sales”.
- Live indicator: A green dot appears when the panel is connected and receiving real-time trade data.
- Selected symbol summary: When a symbol is selected, the header area shows symbol and an animated live dot. It also displays the number of trades currently shown out of the internal limit.
2. Selecting a Symbol
- Search box: Start typing to search instruments (minimum 3 characters). Results show symbol with exchange and type.
- Click to select: Choose a symbol to start streaming its trades.
- From Watchlist: You can also open Time & Sales directly from the Watchlist hover menu; the panel will load with that symbol preselected. See the Watchlist guide.
3. Tape Fields and Formatting
Each trade row contains:
- Time: Exchange time of the print.
- Price: Trade price (₹ formatted).
- Quantity: Trade size.
- Side: Buy, Sell, or Unknown (if not derivable from stream metadata).
- Value: Notional value = price × quantity (₹ formatted).
4. Color Coding and Intensity
- Buy prints: Green background tint.
- Sell prints: Red background tint.
- Unknown: Neutral gray tint, adapting to the active theme.
- Quantity-based intensity: The tint intensity scales with trade size relative to the current list, making larger trades visually stand out.
5. Performance and Behavior
- Virtualized list: The panel uses virtualization to maintain smooth scrolling and rendering even during high volumes.
- Auto-scroll to latest: As new trades arrive, the list automatically focuses to the newest print.
- Row limit: Up to 200 most recent trades are kept in memory; older rows roll off automatically.
- Live connection: When connected, the header shows a green dot. If the stream pauses, the dot is hidden.
Tips
- Switch symbols quickly using the search box in the header.
- Open from Watchlist via hover actions to jump straight to the tape for any instrument.
- Use alongside Chart and Option Chain for a complete picture of price action and order flow.
Looking for price charts? See the Chart Overview. To curate instruments, use the Watchlist.