Chart Overview
The Chart Panel stands as one of the most vital components within FutPrint, specifically designed with the needs of active traders in mind. Delivering precise, real-time market data alongside a robust suite of graphical and analytical tools, it empowers users to make informed and timely trading decisions. The following guide provides a professional and detailed overview of core chart features, control areas, and customization options available in FutPrint.
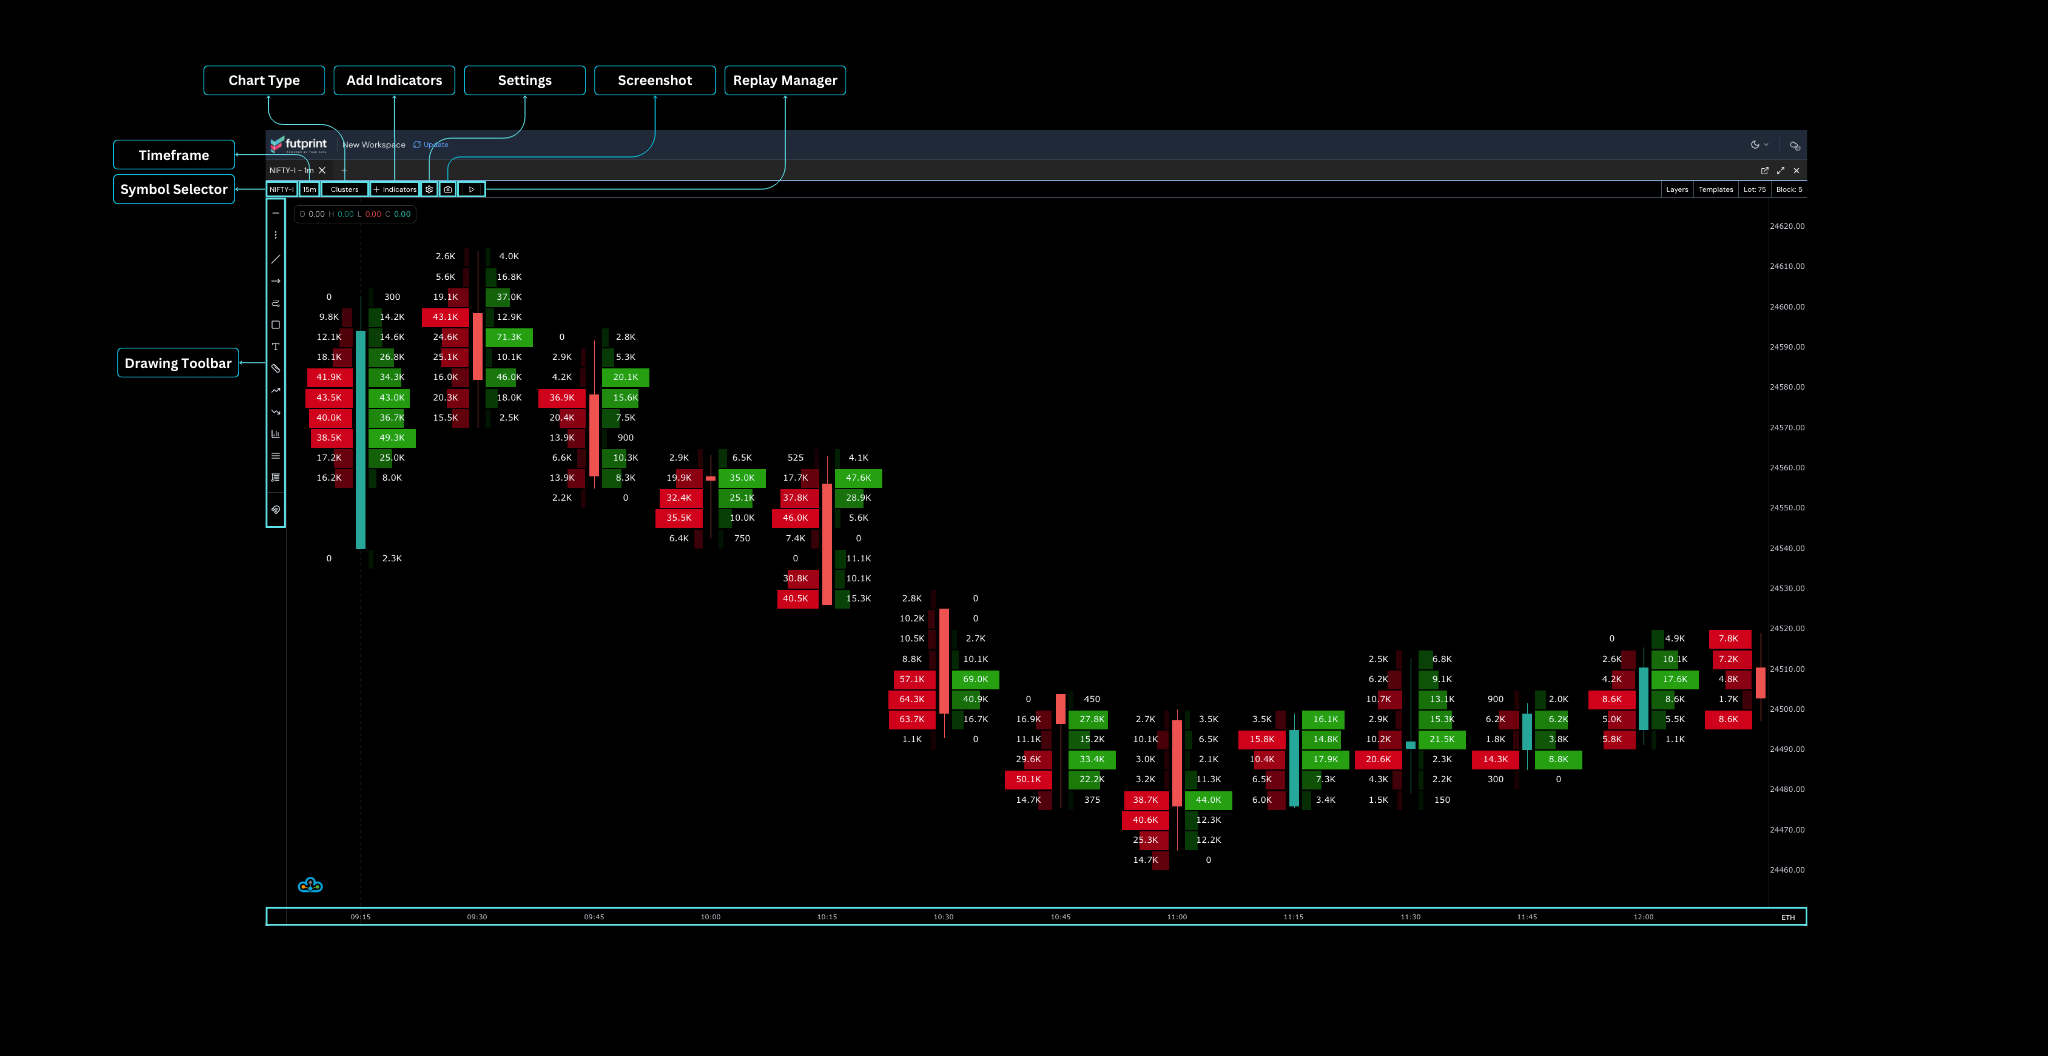
Main parts of Chart panel in FutPrint
Structure of the Chart Panel
The Chart Panel is intuitively divided into several distinct sections, each serving a specific function within the trading workflow:
-
Chart Top Toolbar
Provides access to primary controls such as symbol selection, timeframe navigation, indicator and settings menus, chart type adjustment, and additional management features. -
Chart Area
The central visual region displaying price action, overlays, technical indicators, and custom drawings. -
Drawing Toolbar
A dedicated vertical toolbar for inserting and managing graphical objects and studies. -
Time and Price Axes
Includes the dynamic Time Scale and Price Scale for temporal and price navigation. -
Chart Info Area
Displays contextual details such as current candle data, active indicators, and other pertinent information.
1. Chart Top Toolbar
The Top Toolbar is designed for seamless, one-click access to the most frequently used chart controls and information displays. Key features include:

Chart Top Toolbar in FutPrint
-
Symbol Lookup: Rapidly search and select trading instruments from an extensive directory.
-
Timeframe & Chart Type Selector: Switch between multiple time intervals and chart types for tailored market views.
Supported Chart Types and Styles include:- Candlestick
- OHLC (Open-High-Low-Close)
- Line
- Area
- Cluster (Footprint) Charts
- Heiken Ashi
-
Add Indicator: Effortlessly insert technical indicators from a comprehensive library.
-
Settings Menu: Access granular chart configuration options for a personalized workspace.
-
Replay Manager: Engage with historic data and simulate trading sessions through an interactive replay interface.
-
Chart Screenshot: Instantly capture the current chart view for analysis, sharing, or record keeping.
-
Layer Manager: Organize and manage chart layers, isolating overlays, indicators, and drawings for efficient modifications.
-
Template Manager: Save, import, and export chart templates to streamline consistent workflows across multiple sessions.
-
Lot Size Display: Clearly see the lot size associated with the selected trading instrument.
-
Block Size Display: Instantly view the current block size as determined by the instrument's tick size.
2. Chart Area Controls
At the center of the Chart Panel, the Chart Area provides a transparent, data-rich interface for monitoring price movement and conducting detailed analysis. In addition to displaying price action and technical overlays, the area offers:
-
Zoom Controls:
- X-axis Zoom: Use the mouse wheel to zoom in and out horizontally (time axis).
- Y-axis Zoom: Hold
Ctrl(orCommandon Mac) and scroll the mouse wheel to zoom vertically (price axis).
-
Pan Controls:
- Freely pan the chart by clicking and dragging with a mouse, or by using touch gestures on compatible devices.
- Supports intuitive navigation along both price and time dimensions for in-depth examination.
3. Drawing Toolbar
The Drawing Toolbar is positioned laterally and equips traders with a powerful set of visual annotation and analysis tools. Key functionalities:
-
Add Drawing Tools:
- Select from a wide array of drawing objects (trendlines, Fibonacci tools, shapes, text, and more).
-
Manage All Objects:
- Quickly delete all objects, enable/disable magnet mode for precise point alignment, and access advanced object settings.

Drawing Toolbar in FutPrint
4. Time and Price Axes
Situated at the borders of the chart area, these axes enable:
- Time Scale: Adjust the chart’s temporal granularity, aligning data resolution to your trading style.
- Price Scale: Configurable price intervals, fixed scales, and autoscale features for clearer market structure visualization.
5. Chart Info Area
Situated at the left-top of the chart area, this area displays:
- Current candle data: Displays the current candle data, including open, high, low, close, and volume.
- Active indicators: Displays the list of all applied indicators.
- Immediate symbol and market session details: Displays the immediate symbol and market session details.
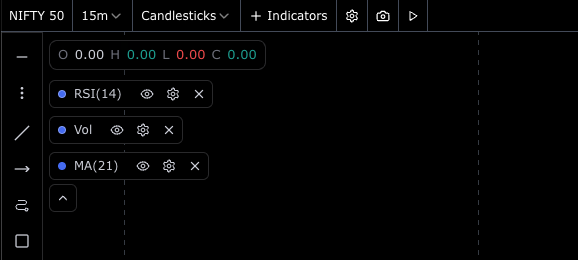
Chart Info Area in FutPrint
Best Practices & Additional Features
-
Customization:
Layouts, color schemes, indicator parameters, and toolbar arrangements are fully customizable, allowing you to create a workspace tailored to your trading preferences. -
Multi-Chart Management:
Open and configure multiple chart panels per workspace, enabling cross-market or multi-timeframe analysis simultaneously. -
Performance:
All tools, overlays, and drawing objects are optimized for smooth, real-time updates—even with high-frequency data streams.
By mastering each section and control of the FutPrint Chart Panel, traders can harness advanced analytics, execute rapid strategies, and develop a workflow that is both efficient and uniquely their own.