Gann Levels
What are Gann Levels?
Gann Levels are price levels based on W.D. Gann’s concepts of geometry, time, and price relationships. They are used to identify potential support/resistance and trend inflection points.
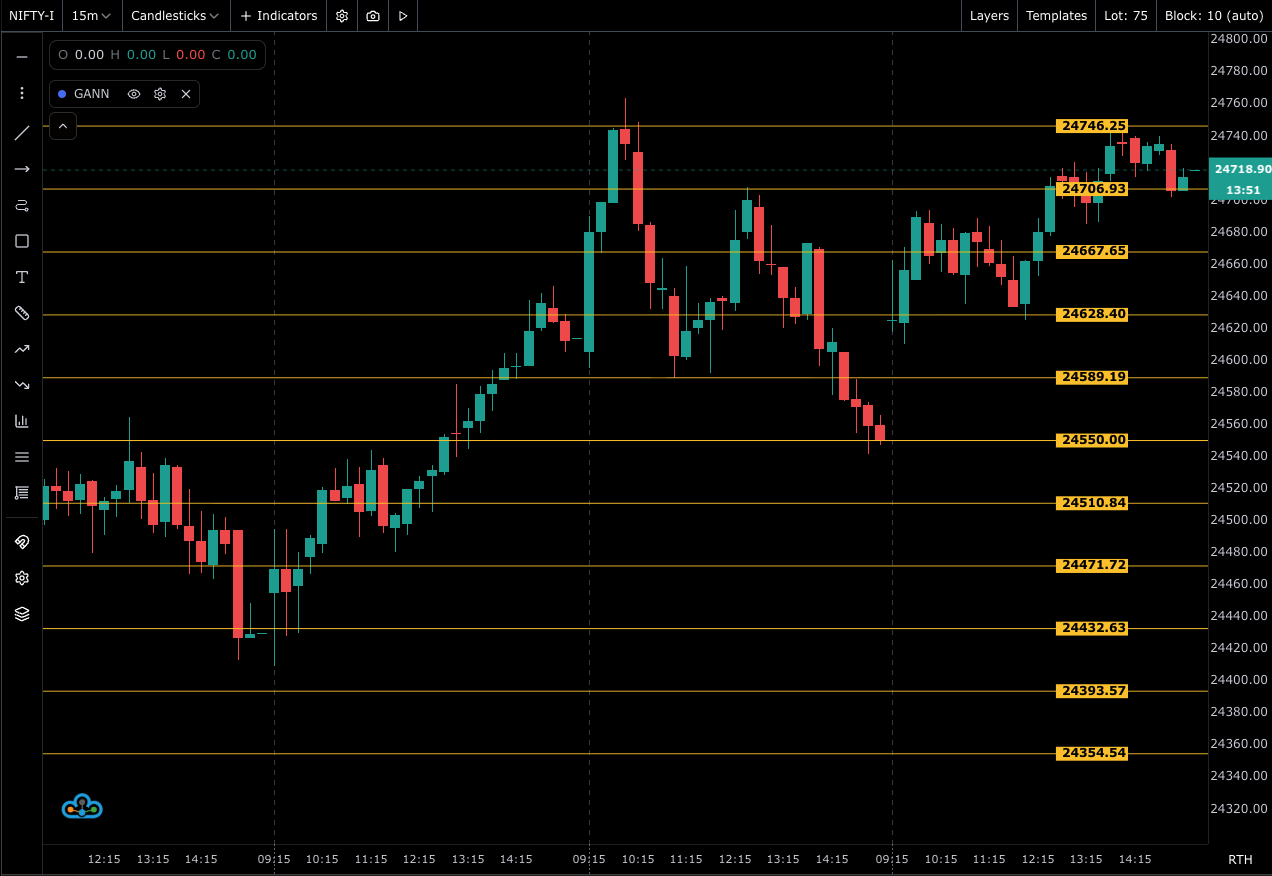
How Gann Levels Work
Common implementations include:
- Gann Fan: Diagonal trendlines at specific angles (e.g., 1x1, 1x2, 2x1) projecting potential dynamic support/resistance.
- Gann Squares/Levels: Horizontal levels derived from price/time square relationships or percentage steps from a reference.
Interpretation:
- Confluence of multiple Gann angles/levels may mark pivotal zones.
- Use alongside swing structure and volume to validate reactions.
Available Settings in FutPrint
- Anchor Point: Reference swing/high/low
- Angles/Steps: Select standard ratios/angles
- Style: Colors and line styles for levels/angles
Practical Usage and Best Practices
- Anchor from significant swing highs/lows or session opens.
- Combine with trend tools (MA/ADX) and momentum (RSI/MACD).
- Avoid overfitting; rely on confluence rather than single-line signals.
Limitations:
- Interpretive; results vary by anchor and scaling choices.
Using Gann Levels in the Platform
- Add Gann Levels from Trend & Directional indicators.
- Select an anchor swing and configure angles/steps.
- Customize visuals for clarity.