Moving Averages (SMA/EMA/WMA/VWMA)
What are Moving Averages?
Moving Averages (MAs) smooth price data to help identify trend direction and reduce market noise. Different types respond differently to recent prices.
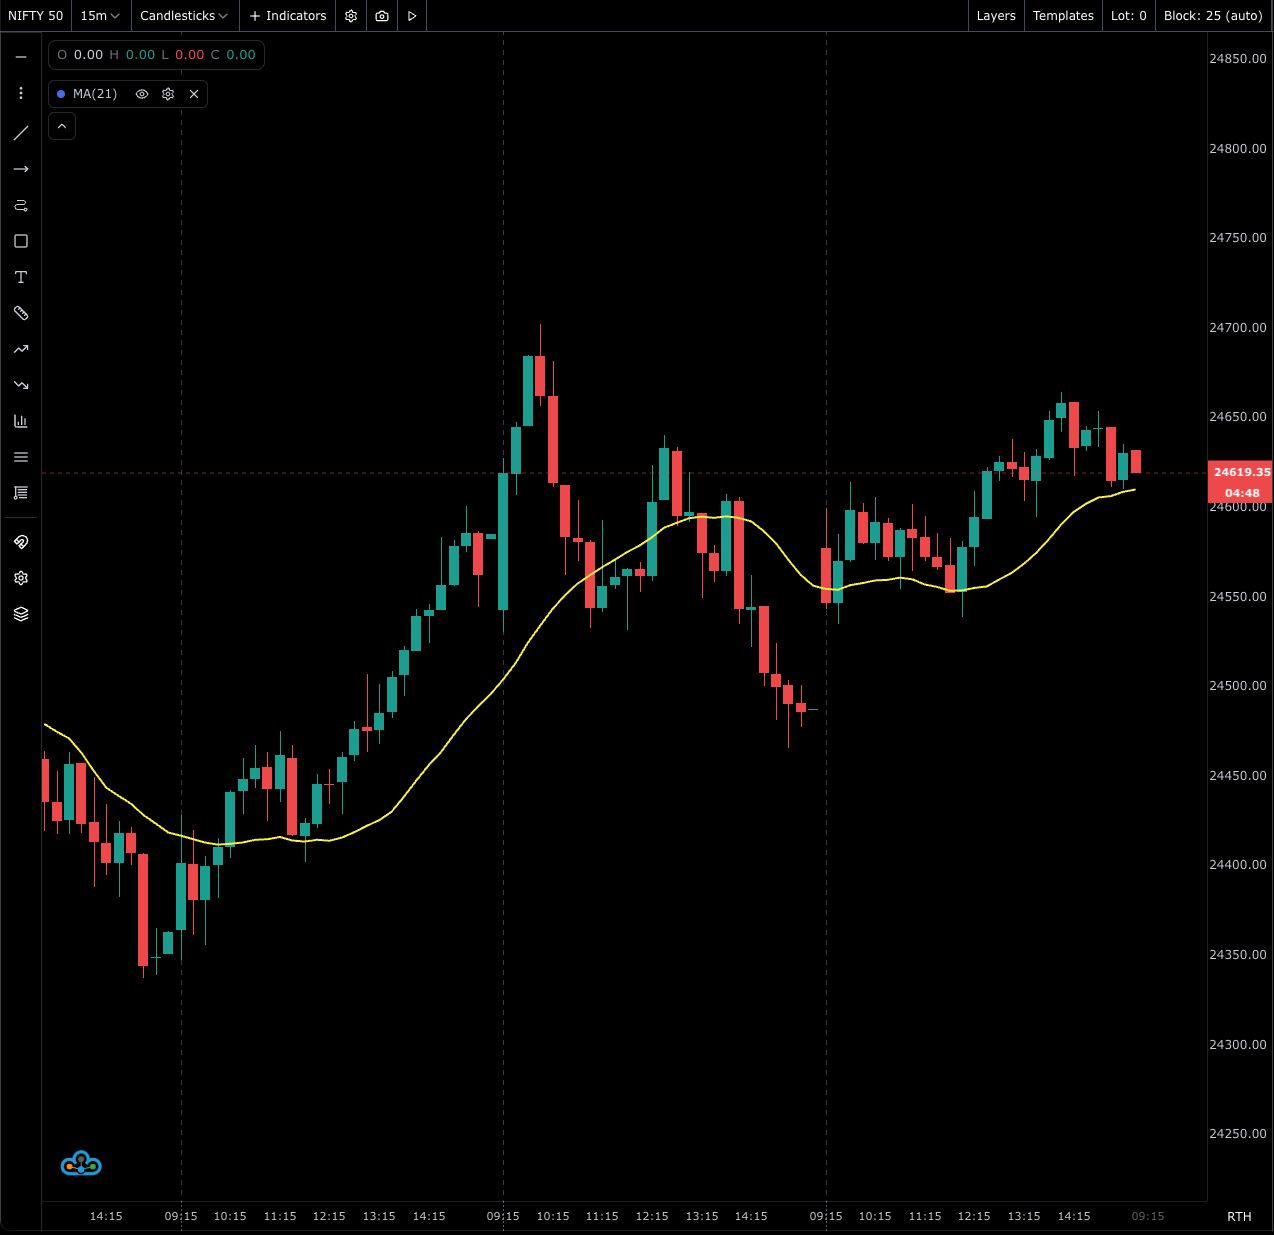
Types of Moving Averages
- SMA (Simple): Arithmetic mean of prices over the period.
- EMA (Exponential): Weights recent prices more heavily; reacts faster.
- WMA (Weighted): Linear weights with recent prices having higher impact.
- VWMA (Volume-Weighted): Weights closes by traded volume.
Common interpretations:
- Trend Bias: Price above MA suggests bullish bias; below suggests bearish bias.
- Dynamic Support/Resistance: MAs often act as moving support/resistance.
- Crossovers: Short MA crossing above long MA can signal bullish shift (and vice versa).
Calculation (Conceptual)
- SMA = Sum(Price over N) / N
- EMA = EMA(previous) + α × (Price − EMA(previous)), where α = 2 / (N + 1)
- WMA = Sum(Weight × Price) / Sum(Weights)
- VWMA = Sum(Volume × Price) / Sum(Volume)
Available Settings in FutPrint
- Type: SMA, EMA, WMA, VWMA
- Period: Default
20(commonly 9/20/50/100/200 are used) - Source: Close (or configurable)
- Offset/Shift: Optional visual shift
- Style: Line color, thickness
Practical Usage and Best Practices
- Use a fast MA (e.g., 9) with a slow MA (e.g., 21/50) for crossovers.
- Align entries with higher-timeframe MA direction for trend-following.
- Combine with ATR/Bollinger Bands to gauge volatility context.
Limitations:
- All MAs are lagging; aggressive settings may increase noise.
- Crossovers in choppy markets can whipsaw.
Using MAs in the Platform
- Add from Technical Indicators → Moving Averages.
- Select type and period; adjust style and source as needed.
- Optionally add multiple MAs for a ribbon/crossover system.