Average Directional Index (ADX) Indicator
What is ADX?
The Average Directional Index (ADX) quantifies trend strength on a scale from 0 to 100. It is derived from the Directional Movement System, which also includes +DI and −DI components.
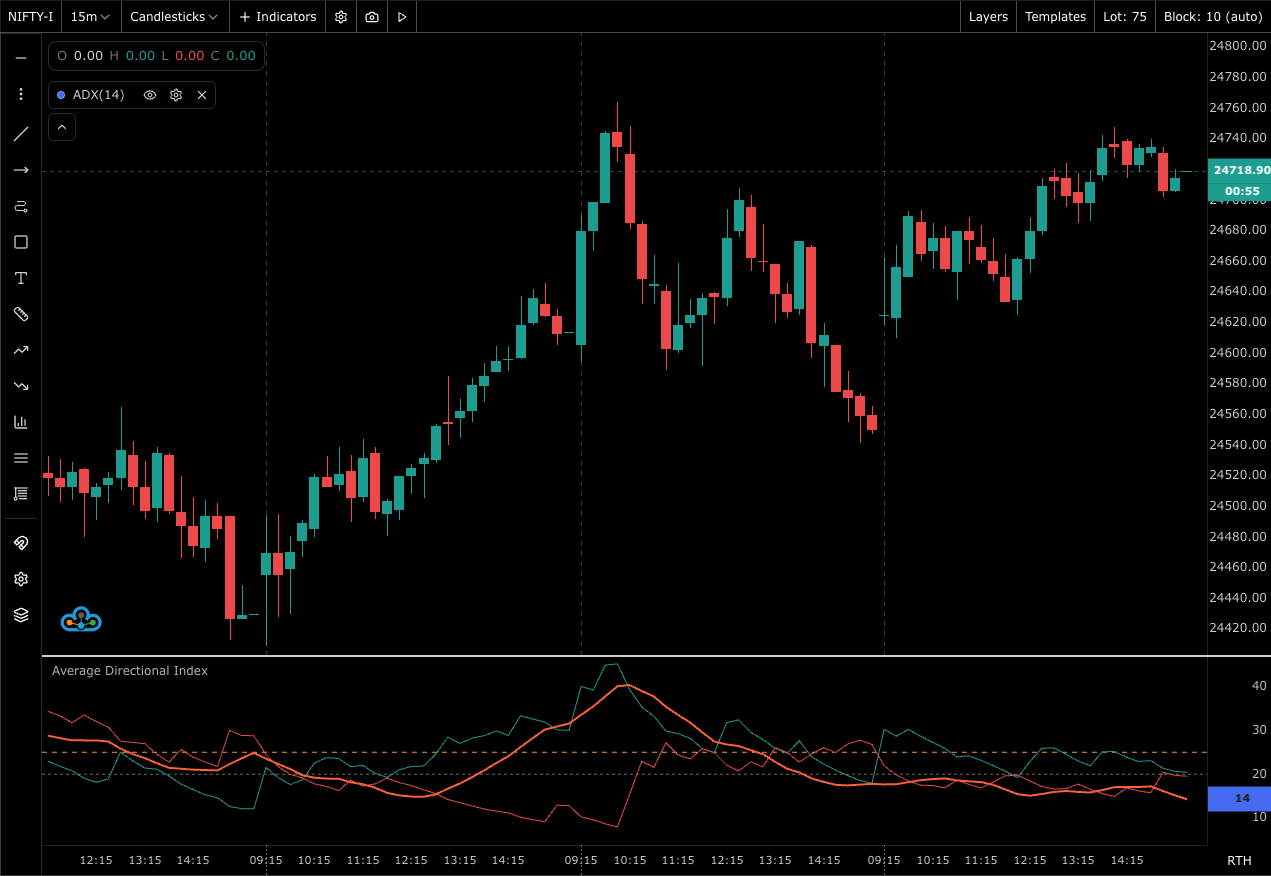
How the ADX Indicator Works
- +DI / −DI: Measure upward and downward directional movement.
- ADX: Smoothed average of the Directional Movement Index (DMI) that reflects the strength of the prevailing trend, regardless of direction.
Interpretation:
- ADX < 20: Weak or ranging conditions
- ADX 20–40: Emerging/normal trend
- ADX > 40: Strong trend
Crossovers:
- When +DI crosses above −DI, bullish directional bias; the reverse suggests bearish bias.
Available Settings in FutPrint
- Period: Default
14 - Smoothing: Wilder’s smoothing (typical)
- Style: Colors for ADX, +DI, −DI and line thickness
Practical Usage and Best Practices
- Use ADX to filter signals: prefer trend strategies when ADX is above a threshold.
- Combine +DI/−DI crossovers with price structure (higher highs/lows) for entries.
- Avoid countertrend trades when ADX is rising strongly against the position.
Limitations:
- ADX can lag; wait for pullbacks rather than chasing late signals.
Using ADX in the Platform
- Add ADX from Trend & Directional indicators.
- Configure Period and style colors for ADX, +DI, and −DI.
- Optionally add a threshold line (e.g., 20/25) for quick filtering.