Relative Strength Index (RSI) Indicator
What is the Relative Strength Index (RSI) Indicator?
The Relative Strength Index (RSI) is a momentum oscillator that measures the speed and magnitude of recent price changes to evaluate overbought or oversold conditions in the price of an asset.
The RSI oscillates between 0 and 100.
- Traditionally, RSI is considered:
- Overbought when above
70 - Oversold when below
30
- Overbought when above
- Traders may also use adjusted thresholds (e.g., 80/20) depending on the asset and timeframe.
- RSI is used to:
- Identify potential trend reversals
- Confirm trend strength
- Spot divergences between price and momentum
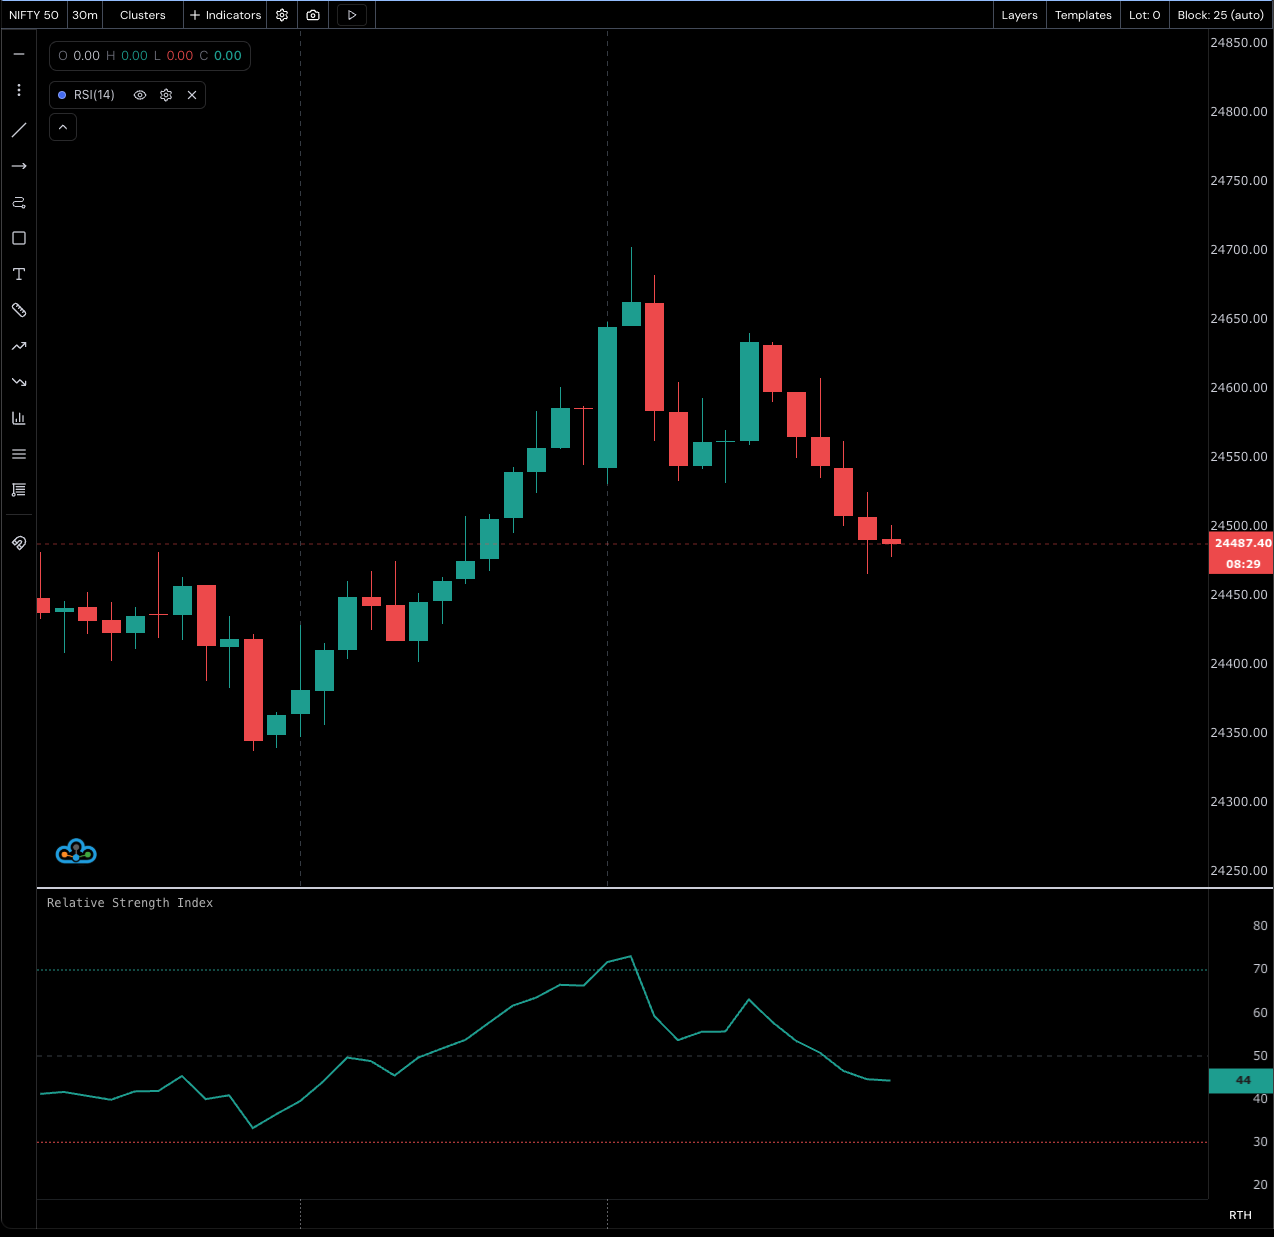
How the RSI Indicator Works
-
Overbought/Oversold Levels:
RSI is considered overbought when above70and oversold when below30.
These levels can be customised. For an asset frequently hitting 70, consider raising the overbought threshold to 80 (and vice-versa for oversold).Note: During strong trends, RSI can remain overbought or oversold for extended periods.
-
RSI Chart Patterns:
RSI can form chart patterns such as:- Double tops/bottoms
- Trendlines
- Support/Resistance zones not always visible on price charts.
-
Trend Ranges:
- In an uptrend, RSI often stays between 40–90, with 40–50 acting as support.
- In a downtrend, RSI often stays between 10–60, with 50–60 acting as resistance.
(These ranges can vary based on settings and the asset’s volatility.)
-
Divergences:
If price makes a new high or low unconfirmed by RSI, this divergence can signal a reversal.- Top Swing Failure: RSI forms a lower high, then moves below a prior low.
- Bottom Swing Failure: RSI forms a higher low, then moves above a prior high.
RSI Calculation Formula
While there are multiple computational approaches (smoothed or exponential forms), the classic formula is: