Money Flow Index (MFI) Indicator
What is the Money Flow Index (MFI)?
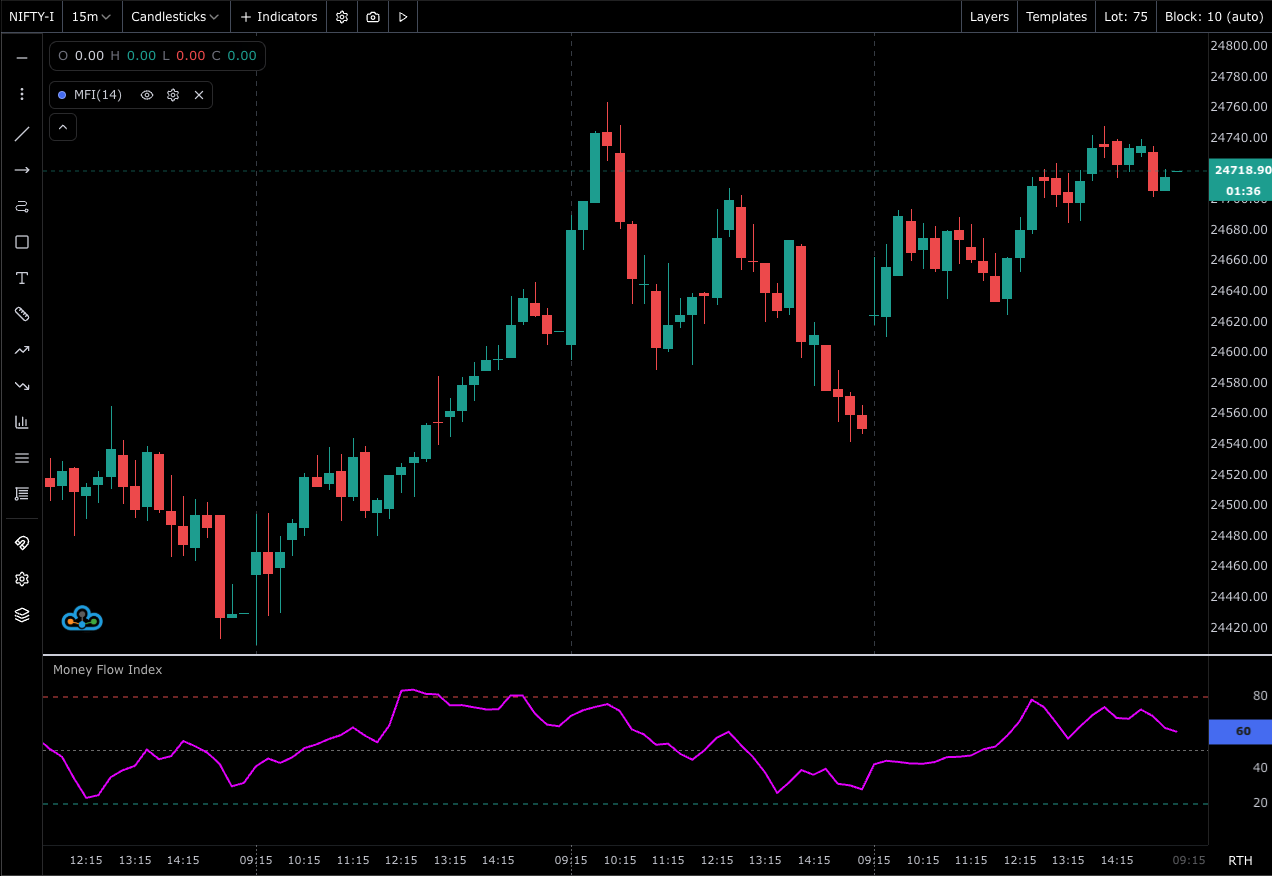
The Money Flow Index (MFI) is a volume-weighted momentum oscillator that uses both price and volume to identify overbought/oversold conditions and potential trend reversals. It oscillates between 0 and 100.
How the MFI Indicator Works
Steps:
- Calculate Typical Price (TP) = (High + Low + Close) / 3
- Compute Raw Money Flow (RMF) = TP × Volume
- Classify Positive/Negative Money Flow based on whether TP increased or decreased
- Sum positive and negative flows over the selected period
- Compute Money Flow Ratio (MFR) = Positive Flow / Negative Flow
- Derive MFI = 100 − [100 / (1 + MFR)]
Interpretation:
- Overbought/Oversold: Above
80may be overbought; below20may be oversold. - Divergence: Price making new highs/lows unconfirmed by MFI can signal reversals.
- Trend Confirmation: Sustained MFI above 50 suggests accumulation; below 50 suggests distribution.
Note: Strong trends can keep MFI in extreme zones longer than expected.
Available Settings in FutPrint
- Period: Default
14 - Levels: Overbought
80, Oversold20(editable) - Price Source: High/Low/Close (used for Typical Price)
- Style: Line color, thickness, and level colors
Practical Usage and Best Practices
- Use extremes (80/20) as context, not standalone signals.
- Combine with price structure (break of swing high/low) to validate signals.
- Look for divergences at key support/resistance zones.
- Align with higher-timeframe trend to improve reliability.
Limitations:
- Volume data quality impacts accuracy.
- In ranging markets, oscillators can produce frequent signals.
Using MFI in the Platform
- Add MFI from the Oscillators list.
- Set Period and customize Overbought/Oversold levels as needed.
- Combine with RSI or MACD for confirmation.