Moving Average Convergence Divergence (MACD) Indicator
What is the MACD Indicator?
The Moving Average Convergence Divergence (MACD) is a trend-following momentum indicator that shows the relationship between two exponential moving averages (EMAs). It helps identify trend direction, momentum shifts, and potential entry/exit points.
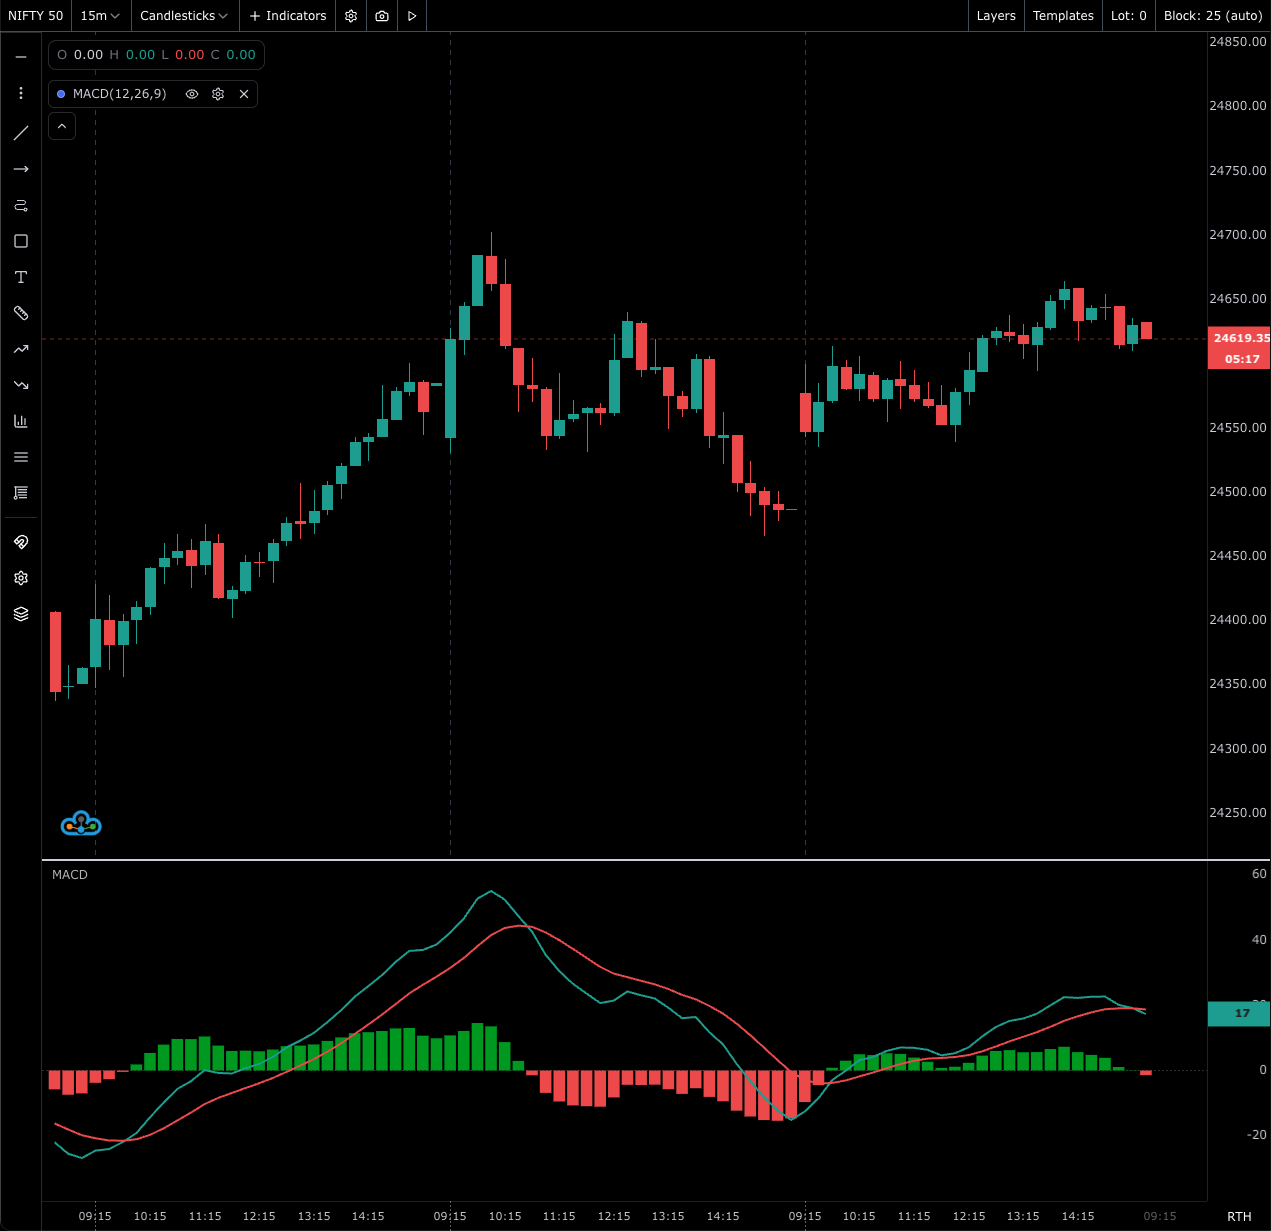
How the MACD Indicator Works
- MACD Line: The difference between a fast EMA and a slow EMA.
- Signal Line: An EMA of the MACD line used to generate signals.
- Histogram: The difference between the MACD line and the Signal line; visualizes momentum.
Common interpretations:
- Line Crossovers: When the MACD line crosses above the Signal line, it suggests bullish momentum; crossing below suggests bearish momentum.
- Zero-Line Cross: MACD above zero indicates the fast EMA is above the slow EMA (bullish bias); below zero suggests a bearish bias.
- Divergences: Price making new highs/lows without confirmation from MACD may foreshadow reversals.
Note: In strong trends, MACD can remain above/below zero for extended periods.
MACD Calculation Formula
- Fast EMA (typically 12)
- Slow EMA (typically 26)
- Signal EMA of MACD (typically 9)
Formally:
- MACD Line = EMA(fastPeriod) − EMA(slowPeriod)
- Signal Line = EMA(MACD Line, signalPeriod)
- Histogram = MACD Line − Signal Line
Available Settings in FutPrint
- Fast Period: Default
12 - Slow Period: Default
26 - Signal Period: Default
9 - Price Source: Close (configurable if supported)
- Style: Colors and thickness for MACD line, Signal line, and Histogram
Practical Usage and Best Practices
- Trend Confirmation: Prefer long setups when MACD > 0 and short setups when MACD < 0.
- Momentum Entries: Use line crossovers near the zero line for earlier signals; farther from zero may be late.
- Divergence: Combine bearish/bullish divergences with support/resistance for higher conviction.
- Multi-Timeframe: Confirm signals on a higher timeframe to reduce false triggers.
Limitations:
- Lagging Nature: As a moving-average-based indicator, MACD can lag price—especially after sharp reversals.
- Whipsaws: In choppy markets, frequent crossovers can cause false signals.
Using MACD in the Platform
- Add the indicator from the Oscillators list.
- Adjust Fast/Slow/Signal periods to suit the asset’s volatility.
- Customize colors for the MACD line, Signal line, and Histogram.
- Optionally combine with RSI/ATR/Bollinger Bands for context.