Heatmap
The Heatmap Panel provides a high-level view of market performance. See groups of instruments as colored tiles where color reflects price performance and size can reflect either performance or volume. Switch between real-time and historical modes, add symbols on the fly, and open linked panels via hover actions.
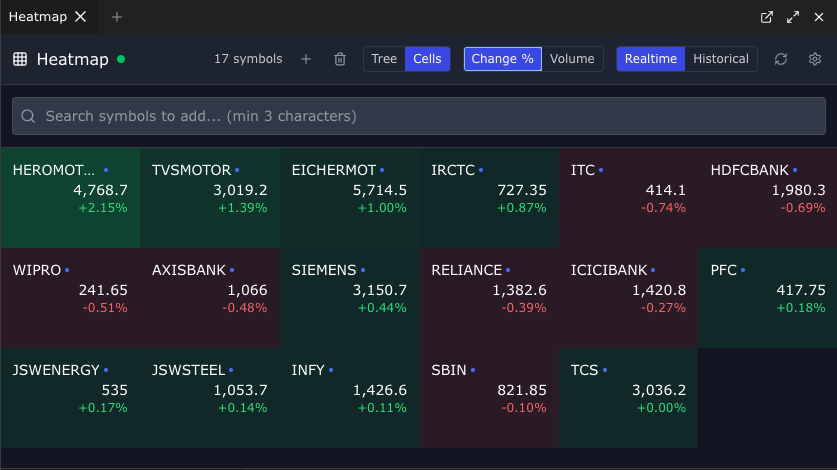
Heatmap panel in FutPrint
1. Header and Controls
- Title and live indicator: A green dot appears when any symbol tile is receiving real-time updates.
- Symbol count: Displays how many instruments are in the Heatmap.
- Add symbol: Opens and focuses search so you can add instruments quickly.
- Clear all: Removes all symbols from the Heatmap.
- View mode: Toggle between Treemap and Cells.
- Tile metric: Choose Change % or Volume for sorting/sizing emphasis.
- Data mode: Switch between Realtime and Historical.
- Historical mode adds a date picker and a manual Refresh button.
- Settings: Opens a drawer with performance and volume metric options.
2. Search and Add Symbols
- Search-as-you-type: Type at least 3 characters to search. Results are grouped by instrument type (e.g., Spot/Cash, Futures, Options, Index).
- Add with one click: Click a result to include it in the Heatmap.
- Remove: Hover any tile and click the trash icon to remove that symbol.
- Persistence: The Heatmap symbols are saved in your browser and restored on reload.
Tip: Use the Heatmap with your Watchlist for quick symbol discovery and drill-down.
3. Realtime vs Historical Data
- Realtime: Each symbol subscribes to a live stream. Tiles show a pulsing green dot when connected.
- Historical: Fetches up to 30 days of OHLCV and computes performance metrics. Auto-refresh is available in realtime mode; you can also refresh manually.
- Status badges: A blue dot on a tile indicates that historical data is available for that symbol.
4. Tile Appearance and Metrics
- Color by performance: Positive change is green; negative is red. Intensity scales with the magnitude (clamped around ±5% for full intensity).
- Size by metric:
- In Treemap, tile size adapts via grid spans based on the selected metric.
- In Cells, each tile uses a fixed size for easier scanning.
- Displayed values:
- Symbol and last price (when available)
- Selected performance metric (e.g., 1D, 1W, 1M, Gap)
- Optional volume label when the tile metric is set to Volume
- Larger tiles: Show additional details like the selected performance metric label and formatted volume indicators.
5. Settings
- Performance Metric: Choose one—1H, 4H, 1D, 1W, 1M, Opening Gap.
- Volume Metric: Choose one—1 Day, 1 Week, 1 Month.
- Info text includes last historical update time when available.
6. Hover Quick Actions
Hover over any tile to open quick actions:
- Chart: Open a chart panel for the symbol.
- Option Chain: Open the option chain for derivatives.
- Time & Sales: Open a live trade tape.
These actions require the terminal workspace. If you don’t see the menu, ensure the workspace is active.
Tips
- Treemap for breadth: Use Treemap to quickly spot leaders/laggards; switch to Cells for uniform scanning.
- Change vs Volume: Toggle metrics to reveal either performance-driven or activity-driven themes.
- Combine views: Pair Heatmap with Chart Overview and Watchlist to move from market-wide context to symbol-level execution.