Bollinger Bands Indicator
What are Bollinger Bands?
Bollinger Bands consist of a middle moving average with upper and lower bands at a defined number of standard deviations. Bands expand during high volatility and contract during low volatility.
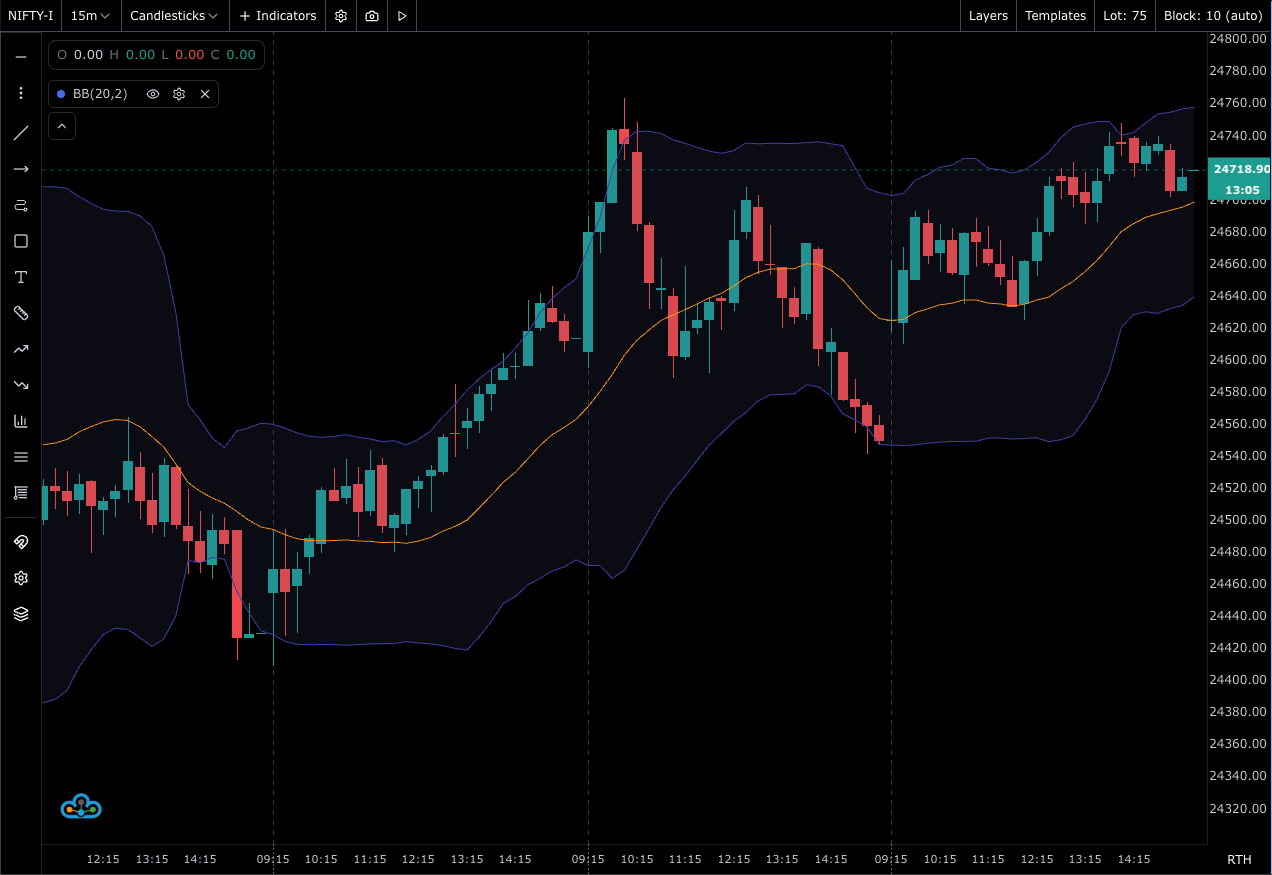
How the Indicator Works
- Middle Band: Simple Moving Average (SMA)
- Upper Band: SMA + (Standard Deviation × Multiplier)
- Lower Band: SMA − (Standard Deviation × Multiplier)
Interpretation:
- Squeezes: Narrow bands often precede large moves.
- Touches: Price touching outer bands indicates momentum but not necessarily reversal.
- Mean Reversion: Price often reverts to the middle band in ranges.
Available Settings in FutPrint
- Period: Default
20 - StdDev Multiplier: Default
2.0 - Source: Close (configurable)
- Style: Colors for each band and fill options
Practical Usage and Best Practices
- Combine with RSI/MACD to filter false signals.
- Use band width to detect volatility regime shifts.
- In trends, pullbacks to the middle band can offer entries.
Limitations:
- In strong trends, multiple touches of outer bands are common; avoid countertrend trades without confirmation.
Using Bollinger Bands in the Platform
- Add from Volatility indicators.
- Set Period and StdDev to suit the asset’s volatility.
- Optionally enable band filling for visual clarity.