Chart Types
FutPrint provides a diverse suite of chart types designed to accommodate a variety of trading strategies and analytical preferences. You can effortlessly switch between these chart representations using the Chart Type menu for rapid contextual analysis.
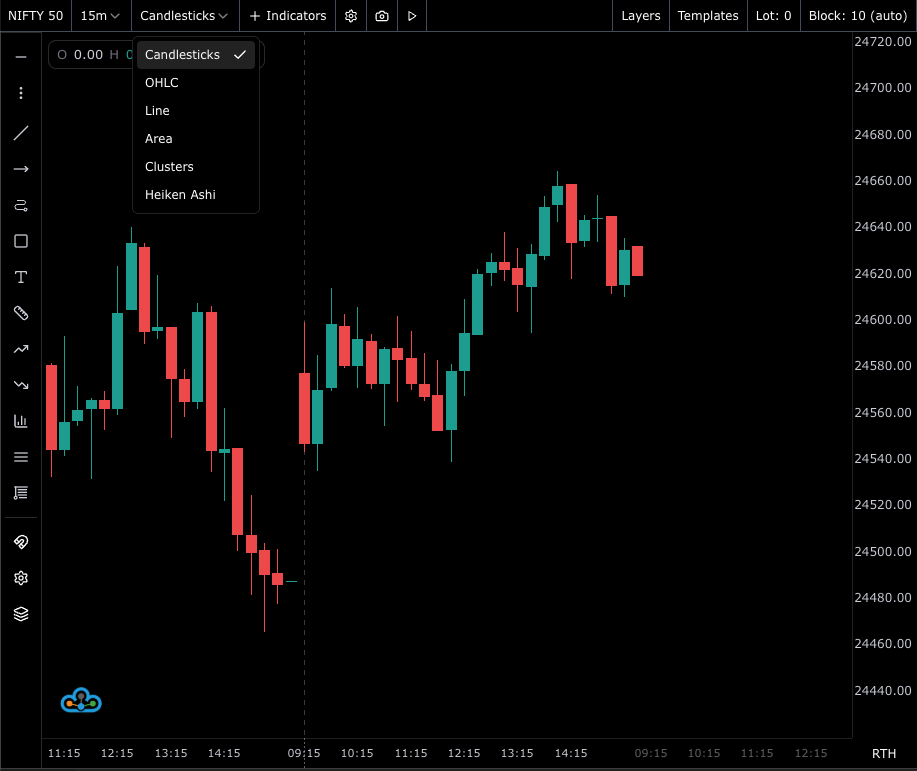
All chart types available in FutPrint
Available Chart Types
Beyond aggregation, FutPrint enables users to select their preferred visual style for price representation. You may choose from the following styles:
- Cluster: Constructs bars based on a specific price range, filtering out market noise.
- Tick Range: Displays price movement in terms of tick range, providing a granular view of market activity.
- Tick Number: Shows price changes in terms of tick counts, offering a clear view of market volatility.
- Candlestick: The classic candlestick chart for comprehensive open-high-low-close analysis.
- OHLC: Traditional bar chart with OHLC information.
- Line: Simple visualization connecting close prices for an uncluttered overview.
- Area: Filled-area under the price line, offering immediate visual cues on market movement.
- Heiken Ashi: Smoothed price representation, widely used for trend identification.
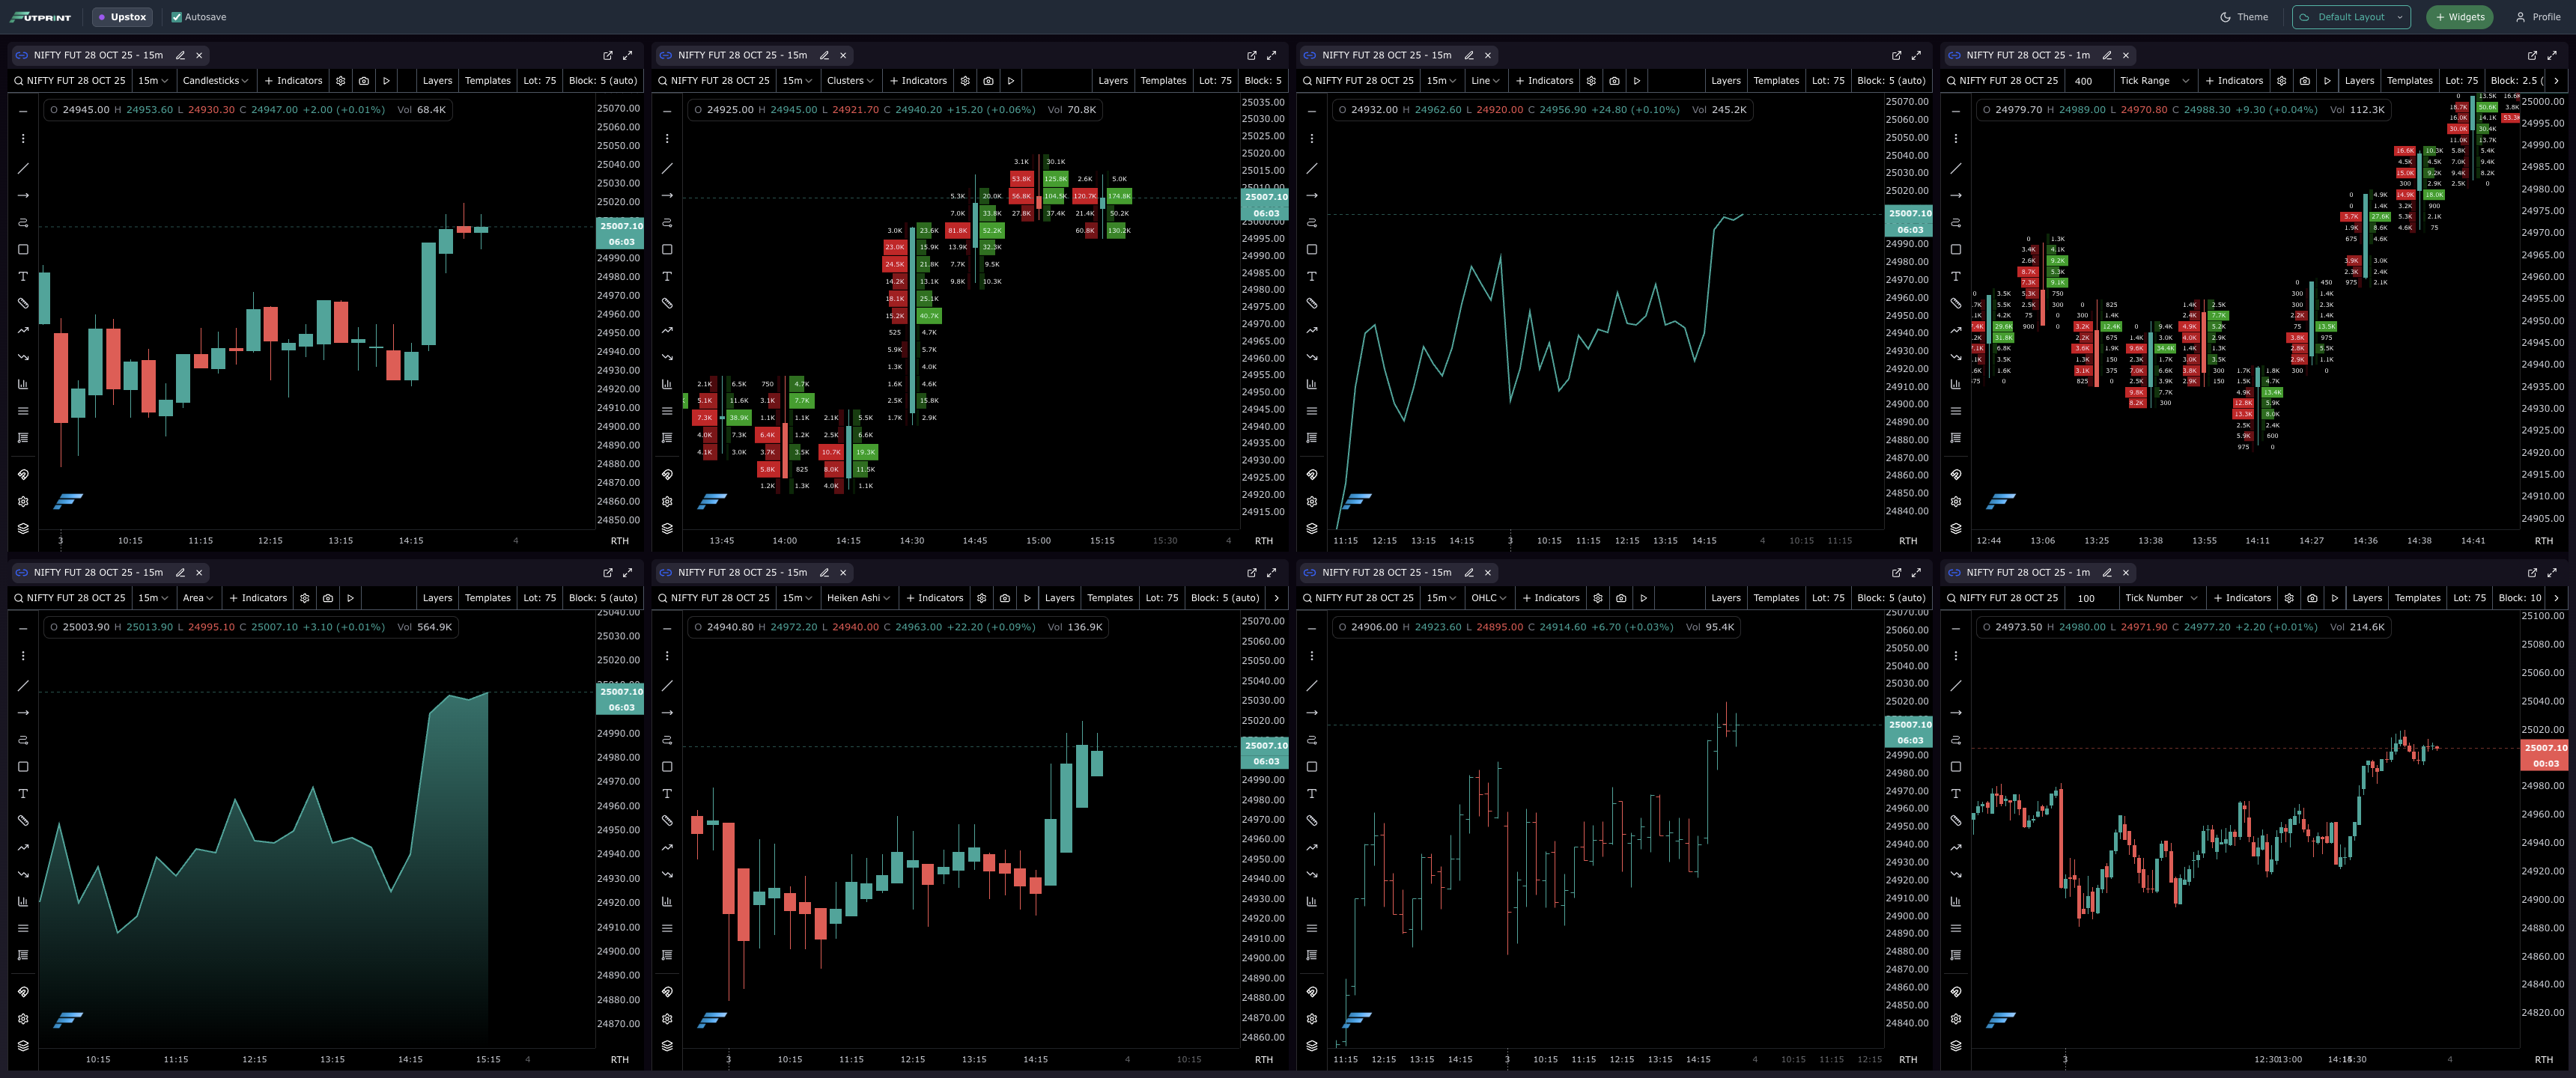
Chart Types demo in FutPrint
Selecting the Optimal View
With this extensive suite of chart types, FutPrint empowers you to match your chart view to your specific trading methodology—whether you rely on classic time-based charts or prefer advanced price and volume-driven models.
Easily switch and experiment within the panel to discover the configurations that best fit your trading processes.